Research
SKI Report 2007:06
Probabilistic Safety Goals
Phase 1 – Status and Experiences in Sweden and Finland
Jan-Erik Holmberg
Michael Knochenhauer
SKI-PERSPEKTIV Bakgrund
En probabilistisk säkerhetsanalys (PSA) för ett kärnkraftverk genererar både kvalitativa och kvantitativa resultat. Kvantitativa resultat presenteras typiskt som frekvensen för härdskada eller som frekvensen för oacceptabla radioaktiva utsläpp. För att kunna bedöma om resultaten från en PSA är acceptabla behövs kriterier för tolkning och värdering av resultaten. Acceptanskriterierna har normalt en dubbel funktion, d.v.s. de definierar en acceptabel säkerhetsnivå, men har också en bredare och mera generell roll som beslutskriterier.
SKI:s och rapportens syfte
I denna projektfas har syftet i första hand varit att ge en klar beskrivning av temat i sig, probabilistiska säkerhetsmåltal för kärnkraftverk, att beskriva termer och begrepp som används i definition och tillämpning av probabilistiska måltal, samt att beskriva status och erfarenheter i Finland och Sverige.
Resultat
Utgående från en serie intervjuer och en begränsad internationell överblick beskriver projektet de probabilistiska säkerhetsmåltalens historia och aktuella status i Sverige och Finland. Ett antal områden diskuteras mera i detalj, inklusive måltalens status mot bakgrund av att de har överskridits under delar av den tid de varit i bruk, strategier för hantering av överskridanden, och kopplingen mellan säkerhetsmåltal på olika nivåer, exempelvis härdskada respektive oacceptabla utsläpp. Projektets resultat kan användas som en plattform för kraftbolagens diskussioner om hur man skall definiera och använda säkerhetsmåltal, och kan också användas av myndigheter som en referens för riskinformerade aktiviteter. Projektresultaten kan också påverka krav på PSA, t.ex. rörande kvalitet, omfattning, detaljeringsnivå och dokumentation. Slutligen bedöms resultaten kunna vara av generellt intresse som ett stöd för pågående och planerade riskinformerade tillämpningar.
Eventuell fortsatt verksamhet inom området
Ett antal av de områden som identifierats som intressanta eller problematiska kommer studeras mera i detalj under nästa projektfas. Detta inkluderar användning av måltal i situationer när PSA-resultat varierar över tiden, kopplingen mellan probabilistiska och deterministiska beslutskriterier, och kriterier för oacceptabla utsläpp (PSA nivå 2), Dessutom kommer en fördjupad lägesbeskrivning att göras genom att utvidga den internationella överblicken och även studera användningen av måltal inom vissa andra industrigrenar.
Effekt på SKI:s verksamhet
Resultaten bidrar till ökad förståelse för användningen av probabilistiska måltal som besluts- och acceptanskriterier.
Projektinformation
SKI:s handläggare: Ralph Nyman
Diarienummer: SKI 2005/1061
SKI PERSPECTIVE Background
The outcome of a probabilistic safety assessment (PSA) for a nuclear power plant is a combination of qualitative and quantitative results. Quantitative results are typically presented as the Core Damage Frequency (CDF) and as the frequency of an unaccepta-ble radioactive release. In order to judge the acceptability of PSA results, criteria for the interpretation of results and the assessment of their acceptability need to be defined. However, safety goals usually have a dual function, i.e., they define an acceptable safety level, but they also have a wider and more general use as decision criteria. The aim of SKI and of the report
In this first phase of the project, the aim has been on providing a clear description of the issue of probabilistic safety goals for nuclear power plants, to define and describe important concepts related to the definition and application of safety goals, and to describe experiences in Finland and Sweden.
Results
Based on a series of interviews and on literature reviews as well as on a limited interna-tional over-view, the project has described the history and current status of safety goals in Sweden and Finland. A number of issues were discussed more in detail, including the status of the safety goals in view of the fact that they are often exceeded, strategies for handling violations of safety goals, and relation between safety goals defined on diffe-rent levels, e.g., for core damage and for unacceptable release. The results from the project can be used as a platform for discussions at the utilities on how to define and use quantitative safety goals. The results can also be used by safety authorities as a
reference for risk-informed regulation. The outcome can have an impact on the
requirements on PSA, e.g., regarding quality, scope, level of detail, and documentation. Finally, the results can be expected to support on-going activities concerning risk-informed applications.
Possible continued activities within the area
A number of the issues identified as interesting or problematic will be studied more in detail in the next project phase. This includes consistency in the usage of safety goals, realtions between deterministic and probabilistic safety goals,a and criteria for
unacceptable releases (level 2 PSA). In addition, the international overview will be extended, and safety goals in some other industries will be studied.
Effect on SKI activities
The project results are expected to increase the understanding of probabilistic target values as decision and acceptance criteria.
Project information
Project responsible at SKI: Ralph Nyman
Project number: SKI 2005/1061
Research
SKI Report 2007:06
Probabilistic Safety Goals
Phase 1 – Status and Experiences in Sweden and Finland
Jan-Erik Holmberg
VTT, P.O.Box 1000, FI-02044 VTT, Finland
Michael Knochenhauer
Relcon Scandpower AB, 172 25 Sundbyberg, Sweden
February 2007
This report concerns a study which has been conducted for the Swedish Nuclear Power Inspectorate (SKI). The conclusions and viewpoints presented in the report are
Sammanfattning
En probabilistisk säkerhetsanalys (PSA) för ett kärnkraftverk genererar både kvalitativa och kvantitativa resultat. Kvantitativa resultat presenteras typiskt som frekvensen för härdskada eller som frekvensen för oacceptabla radioaktiva utsläpp. För att kunna bedöma om resultaten från en PSA är acceptabla behövs kriterier för tolkning och värdering av resultaten. Ytterst skall dessa kriterier eller måltal definiera nivån för acceptabel risk från driften av ett kärnkraftverk. Acceptanskriterierna har dock normalt en dubbel funktion, d.v.s. de definierar en acceptabel säkerhetsnivå, men har också en bredare och mera generell roll som beslutskriterier. Den exakta nivån för dessa kriterier varierar mellan olika organisationer och länder. Det finns också skillnader i definitionen av måltalen och i deras formella status, d.v.s. om de är tvingande eller ej.
I denna projektfas har syftet i första hand varit att ge en klar beskrivning av temat i sig, probabilistiska säkerhetsmåltal för kärnkraftverk, att beskriva termer och begrepp som används i definition och tillämpning av probabilistiska måltal, samt att beskriva status och erfarenheter i Finland och Sverige.
Utgående från en serie intervjuer och en begränsad internationell överblick beskriver projektet de probabilistiska säkerhetsmåltalens historia och aktuella status i Sverige och Finland. Ett antal områden diskuteras mera i detalj, inklusive följande:
x Måltalens status mot bakgrund av det faktum att de har överskridits under stora delar av den tid de varit i bruk, liksom implikationer av dessa överskridanden. x Säkerhetsmåltal som tvingande respektive vägledande kriterier.
x Strategier för hantering av överskridanden, inklusive graderade angreppssätt av typen ALARP (As Low As Reasonably Practicable).
x Kopplingen mellan säkerhetsmåltal på olika nivåer, exempelvis härdskada respektive oacceptabla utsläpp.
Ett antal av dessa områden kommer studeras mera i detalj under nästa projektfas. Projektets resultat kan användas som en plattform för kraftbolagens diskussioner om hur man skall definiera och använda säkerhetsmåltal, och kan också användas av myndigheter som en referens för riskinformerade aktiviteter. Projektresultaten kan också påverka krav på PSA, t.ex. rörande kvalitet, omfattning, detaljeringsnivå och dokumentation. Slutligen bedöms resultaten kunna vara av generellt intresse som ett stöd för pågående och planerade riskinformerade tillämpningar.
Summary
The outcome of a probabilistic safety assessment (PSA) for a nuclear power plant is a combination of qualitative and quantitative results. Quantitative results are typically presented as the Core Damage Frequency (CDF) and as the frequency of an unaccepta-ble radioactive release. In order to judge the acceptability of PSA results, criteria for the interpretation of results and the assessment of their acceptability need to be defined. Ultimately, the goals are intended to define an acceptable level of risk from the opera-tion of a nuclear facility. However, safety goals usually have a dual funcopera-tion, i.e., they define an acceptable safety level, but they also have a wider and more general use as decision criteria. The exact levels of the safety goals differ between organisations and between different countries. There are also differences in the definition of the safety goal, and in the formal status of the goals, i.e., whether they are mandatory or not. In this first phase of the project, the aim has been on providing a clear description of the issue of probabilistic safety goals for nuclear power plants, to define and describe important concepts related to the definition and application of safety goals, and to describe experiences in Finland and Sweden.
Based on a series of interviews and on literature reviews as well as on a limited interna-tional over-view, the project has described the history and current status of safety goals in Sweden and Finland, and elaborated on a number of issues, including the following:
x The status of the safety goals in view of the fact that they have been exceeded for much of the time they have been in use, as well as the possible implications of these exceedances.
x Safety goals as informal or mandatory limits.
x Strategies for handling violations of safety goals, including various graded approaches, such as ALARP (As Low As Reasonably Practicable).
x Relation between safety goals defined on different levels, e.g., for core damage and for unacceptable release.
A number of important issues have been identified for continued studies in the next project phase.
The results from the project can be used as a platform for discussions at the utilities on how to define and use quantitative safety goals. The results can also be used by safety authorities as a reference for risk-informed regulation. The outcome can have an impact on the requirements on PSA, e.g., regarding quality, scope, level of detail, and
documentation. Finally, the results can be expected to support on-going activities concerning risk-informed applications.
Acknowledgements
We want to express our thanks to the many people who have participated in the interviews – they are all listed in Attachment 1. These interviews have accumulated a large body of information, and are the backbone of the project. We also thank the NKS (Nordic nuclear safety research) and the members of NPSAG (Nordic PSA Group) and SAFIR (The Finnish Research Programme on Nuclear Power Plant Safety 2003–2006)
Table of contents
1 INTRODUCTION ... 1
1.1 BACKGROUND... 1
1.2 PROJECT AIM AND SCOPE... 2
1.3 PREVIOUSNORDIC RESEARCH PROJECTS RELATED TO SAFETY GOALS FOR NUCLEAR POWER PLANTS 3 2 BACKGROUND TO SAFETY GOALS... 5
2.1 CONCEPTS... 5
2.1.1 Probability and risk concepts ... 5
2.1.2 Risk acceptance concepts ... 7
2.2 DECISION THEORETIC BACKGROUND... 9
2.2.1 The theory of expected utility... 9
2.2.2 Risk-based approach using value theory... 10
2.2.3 Risk-informed approach ... 11
2.2.4 Risk decision making as an investment problem ... 12
2.2.5 Risk decision making from the regulatory perspective... 12
2.3 CONTEXT OF SAFETY GOALS... 13
3 THE EVOLVEMENT OF SAFETY GOALS ... 15
3.1 INTRODUCTION... 15
3.2 HISTORY OF PSA SAFETY GOALS IN FINLAND... 16
3.2.1 Radiation and Nuclear Safety Authority of Finland (STUK)... 16
3.2.2 Teollisuuden Voima Oy (TVO)/Olkiluoto NPP... 19
3.2.3 Fortum/Loviisa NPP... 19
3.2.4 Finnish experience... 20
3.3 HISTORY OF PSA SAFETY GOALS IN SWEDEN... 21
3.3.1 Overview of early PSA activities in Sweden ... 21
3.3.2 Swedish Nuclear Power Inspectorate (SKI) ... 22
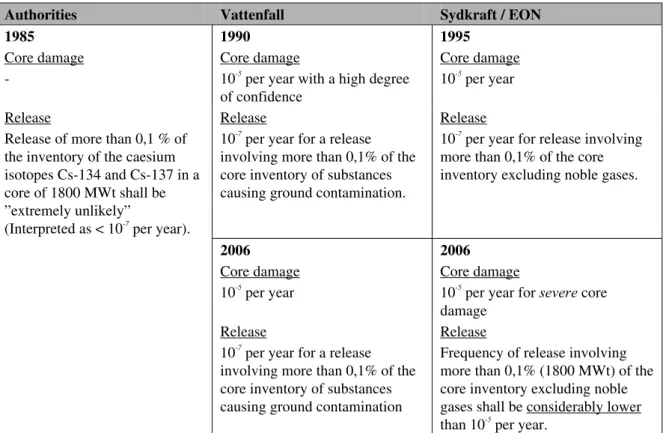
3.3.3 Sydkraft/E.ON – Barsebäck and Oskarshamn NPP:s ... 26
3.3.4 Vattenfall – Ringhals and Forsmark NPP:s ... 28
3.3.5 Westinghouse Electric (previously ASEA Atom) ... 30
3.3.6 Summary of Swedish safety goals... 31
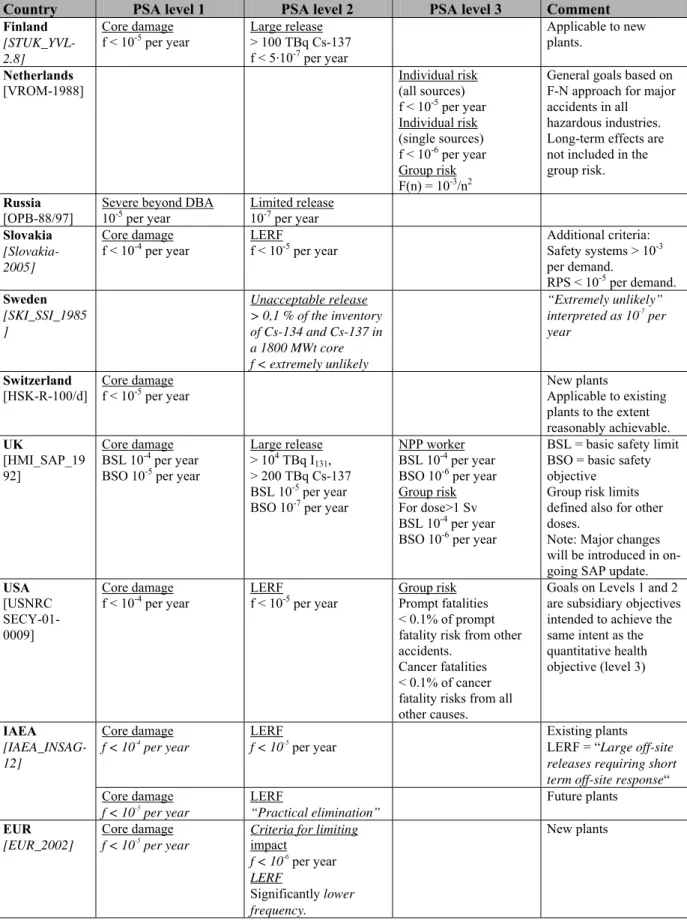
3.4 LIMITED INTERNATIONAL OVERVIEW... 33
4 SELECTED ISSUES ... 35
4.1 USE OF SAFETY GOALS IN DECISION MAKING... 35
4.2 AMBIGUITIES IN DEFINITIONS OF SAFETY GOALS... 36
4.3 TREATMENT OF UNCERTAINTIES IN THE APPLICATION OF SAFETY GOALS... 37
4.4 AMBIGUITIES IN THE SCOPE SAFETY GOALS... 39
4.5 RELATIONSHIP BETWEEN GOALS ON DIFFERENT LEVELS... 40
4.6 USE OF SAFETY GOALS FOR NEW PLANTS VS. FOR OPERATING PLANTS... 42
4.7 COMPARISON OF SAFETY GOALS DEFINED IN DIFFERENT CONTEXTS... 43
5 CONCLUSIONS ... 43
6 REFERENCES ... 47
7 ACRONYMS AND ABBREVIATIONS... 52
Tables
Table 1. Overview of PSA activities in Sweden and Finland from 1975 until today. ....15 Table 2. Numerical design objectives defined in different versions of STUK’s PSA
guide YVL-2.8...18 Table 3. Probabilistic safety goals in Sweden – a summary ...31 Table 4. Safety goals defined by some countries and organisations. ...34
Figures
Figure 1. Hypothetical F-N curve of risk associated with a system in log-log scale....7 Figure 2. Societal risk curve with ALARP region as defined by VROM [VROM-1988].8 Figure 3. A utility theoretic approach to risk assessment and decision making. ...10 Figure 4. A value theoretic approach to risk assessment and decision making. ...11 Figure 5. An informal approach to risk assessment and decision making. ...12 Figure 6. Simplified comparison of risks from exposure to radon with other common risks [SKI_SSI_1985]...24 Figure 7. Safety case or goal based approach for showing the compliance with safety objectives by means of PSA [Bishop_SC]. ...39 Figure 8. Simplified PSA event tree and corresponding levels of defence-in-depth
(DID) linking event tree branches with different high level and surrogate safety goals [IAEA_INSAG-10]. ...41
1 Introduction
1.1 Background
The outcome of a probabilistic safety assessment (PSA) for a nuclear power plant is a combination of qualitative and quantitative results. Quantitative results are typically presented as the Core Damage Frequency (CDF) and the frequency of an unacceptable radioactive release. The radioactive release is a more complex outcome, and usually important sub-categories are defined, e.g., the Large Early Release Frequency (LERF). In order to judge on the acceptability of PSA results, criteria for the interpretation of results and the assessment of their acceptability need to be defined.
Target values for PSA results, both for CDF and for radioactive releases, are in use in most countries having nuclear power plants. In some countries, the safety authorities define these target values or higher level safety goals. In other countries, they have been set only by the nuclear utilities. Ultimately, the goals are intended to define an accepta-ble level of risk from the operation of a nuclear facility. There are usually also
important secondary objectives, such as providing a tool for identifying and ranking issues with safety impact, which includes both procedural and design related issues. Thus, safety goals usually have a dual function, i.e., they define an acceptable safety level, but they also have a wider and more general use as decision criteria. The exact levels of the safety goals differ between organisations and between different countries. There are also differences in the definitions of the safety goals, and in the formal status of the goals, i.e., whether or not they are mandatory.
Defining quantitative goals for reactor safety may have a large impact on both the analysis burden and on requirements for safety improvements at nuclear power plants. It is therefore of great importance that safety goals are soundly based, that they can be effectively and unambiguously applied, and that they can be accepted and understood by all parties concerned (nuclear utilities, decision makers, analysts, etc.).
The notion of risk acceptance appeared already in 1967 in a paper on siting criteria by F.R. Framer [Farmer_1967] where he outlined the concept of probabilistic safety assessment. He proposed a safety criterion based on the F-N curve. Subsequently, the reactor safety study [WASH-1400] and some pioneering PSA:s, e.g., [NUREG-1150] made comparisons of individual and societal risks from nuclear power plant with other industrial risks.
In most countries, safety goals started to be discussed and defined in the late 1980s [NUREG-0880, IAEA_INSAG-3]. At that time, PSA models were rather limited in scope, often consisting mainly of internal process events (transients and LOCA) during power operation. For various reasons, including limitations in analysis scope and capa-city problems with the computer codes used for the analyses, the level of detail of the PSA models was also rather limited. In addition, the focus was on level 1 PSA, i.e., on calculation of CDF. Furthermore, the actual use of early PSA:s was generally rather limited, even if the issue of Living PSA (LPSA) received considerable attention during the 1980s.
During the 1990s, PSA models expanded considerably, both regarding operating states and classes of initiating events. The level of detail of the analyses also increased, espe-cially regarding initiating events (definition of common cause initiator events, CCI), inclusion of functional dependencies (signals, power supply, control logics), and model-ling of non-safety systems. In parallel, PSA:s were expanded to level 2, making it possible to calculate the frequency of radioactive releases.
Thus, the scope, level of detail and areas of use of PSA have changed considerably since the time the safety goals were originally defined. This is a change both in quality and in maturity of the PSA technique. At the same time, PSA applications are becoming more and more important. This has lead to an increased interest and need to make active use of PSA results, and thus to make judgments concerning the acceptability of risk contributions calculated with PSA.
1.2 Project aim and scope
The project has been financed jointly by NKS (Nordic Nuclear Safety Research), SKI (Swedish Nuclear Power Inspectorate) and the Swedish and Finnish nuclear utilities. The national financing went through NPSAG, the Nordic PSA Group (Swedish butions) and SAFIR, the Finnish research programme on NPP safety (Finnish contri-butions).
The first phase of the project “The Validity of Safety Goals” was carried out mainly during 2006, and the phase 1 results are presented in this project report. The overall aim in this phase has been to discuss and document current views, mainly in Finland and Sweden, on the use of safety goals, including both benefits and problems. Another important aim has been to identify and clearly define the concepts involved in the definition, interpretation and use of safety goals.
The main objective has been to clarify the basis for the evolvement of safety goals for nuclear power plants in Sweden and Finland and to describe the experiences gained. This has been achieved by performing a rather extensive series of detailed interviews with people who are or have been involved in the formulation and application of the safety goals, putting the focus on the question of where the safety goals came from, what they are perceived to stand for, and how they are interpreted. The experiences from their use has also been discussed, as well as development needs. To provide further perspective, crucial references related to the formulation and use of safety goals have been identified and reviewed.
In addition, a limited review of the current status internationally has been performed by letting a number of people and organisations outside the Nordic countries answer a revised version of the questionnaire used for the Nordic interviews.
The results of this project phase was presented at a project seminar in Stockholm in November 2006 [SG_Semin_2006]. The project has also been presented at PSAM 8, an international conference on Probabilistic Safety and Management [PSAM8-0162]. The project report includes the following parts:
Chapter 1. Introduction and background
Chapter 2. Background to safety goals
Concepts; Quantification of risk; Consequences; Risk criteria; Decision theory.
Chapter 3. The evolvement of safety goals
Historical review; Reasons for defining safety goals; Context of goals; Parties involved; Areas of application; Experiences with safety goals; Limited international overview.
Chapter 4. Specific issues
Discussion of status related to a number of important issues associated with the definition, interpretation and use of probabilistic safety goals. Chapter 5. Conclusions
Conclusions, including a summary of planned activities for phase 2 of the project.
1.3 Previous Nordic research projects related to safety
goals for nuclear power plants
The issue of safety goals has been discussed in several previous Nordic projects, especially within the NKS programme, i.e., the same framework within which the present project has been performed.
In the NKA1 programme 1981–84, the project NKA/SÄK-1 “PRA uses and techniques”
focused on method development of PSA (called PRA in that time) [NKA/SÄK-1]. The question of implementation of PSA safety goals in regulatory work was left open, since there was little interest in the Nordic countries concerning the possible implementation
of quantitative safety goals. Using PSA results in a qualitative manner was preferred,
because there were limited experience from the performance and use of PSA.
In the NKA programme 1985–89 [NKA_1989:91], several projects dealt with safety goals. The project NKA/RAS 490 “Principles for risk assessment and decision making” developed a scheme for decision making involving risk [NKA/RAS-490]. Cost-benefit evaluations were considered as a possible approach, but such a trade-off was recognised to be surrounded by controversy.
The project NKA/RAS 450 ”Optimization of technical specifications by use probabilis-tic methods” developed methods and decision making criteria for comparison of alternative requirements in Technical Specifications [NKA_1990:33]. Various acceptance and optimisation criteria were discussed, but no formal cost-benefit ratio was addressed. The following procedure was recommended: 1) Quantitative
demonstration of numerical acceptability with or without the use of a formal criterion; 2) Case-by-case decision based on weighing of quantitative results against qualitative boundary conditions.
The project NKA/RAS 470 “Dependencies, human interactions and uncertainties in probabilistic safety assessment” concentrated on limitations in PSA techniques
[NKA_1990:57]. One conclusion of the project was that intrinsic and practical limita-tions of PSA make the use of absolute probabilistic criteria in decision making difficult. In the next NKS programme 1990–94, the project NKS/SIK-1 “Safety evaluation by living probabilistic safety assessment and safety indicators” developed the concept of living PSA [SKI_1994:2]. Risk criteria needed in different LPSA applications were presented. It was concluded, that probability based criteria could give guidance of first indication about the acceptability of decision alternatives, but that they alone are not sufficient in complex decision making situations [VTT Publ 146]. In the same project, multi-attribute decision analysis as a tool to support risk decision making was demon-strated [RiskAnal 94 983-991], and the decision analysis panel method was further demonstrated in two cases [STUK-YTO-TR 61].
The External Events2 Programme (1994–97) of the Swedish utilities and the SKI
included the project “Presentation and Interpretation of Results in the Probabilistic Analysis of External Events” [SKI_1997:49]. It was concluded, that many PSA applications presuppose the comparability of results, i.e., that relevant quantitative comparisons can be made between the various parts of the PSA (e.g. between the risks from transients and internal fires). This was perceived to be a problem, as most PSA analyses of area events were based on simplified models and on a mixture of conserva-tive and non-conservaconserva-tive assumptions. The report discusses the prerequisites for comparability and provides an outline of two alternative methods for performing the comparison.
In 1994-97, NKS/RAK-1 “Strategies for Reactor Safety,” explored strategies for safety management of NPP:s in Finland and Sweden [NKS(97)FR1]. Quantitative safety goals and other probabilistic decision criteria were discussed only implicitly.
In the next NKS programme, NKS/SOS (1998–2001), the project NKS/SOS-1 “Nuclear Safety in Perspective” aimed at enhancing the common understanding about require-ments for nuclear safety by finding improved means of communicating the subject in society [NKS-60].
The project NKS/SOS-2 “Advances in Operational Safety and Severe Accident Research” performed studies related to uncertainty and incompleteness in PSA [NKS-61]. Various probabilistic criteria were reviewed and their use was discussed [NKS-44]. A decision analytic framework for evaluating the criteria was developed, and the
different criteria were analysed with regard to their behaviour under incompleteness or uncertainty of the PSA model. Recommendations on the application of the criteria in different decision situations were given.
A comparison was made of the PSA:s for two nearly identical NPP:s, Forsmark 3 and Oskarshamn 3, both third generation ABB Atom BWR:s [NKS-36]. The results of the project indicated that PSA is not a robust method regarding absolute quantitative results, and that results and conclusions can vary a lot between different versions. Therefore a harmonisation of methods would be needed before reasonable comparison of results can be done. In consequence, the use of absolute risk criteria in decision making is problematic, since the scope and level of realism varies between studies.
2 Background to Safety Goals
2.1 Concepts
2.1.1 Probability and risk concepts
Probability expresses quantitatively the uncertainty related to an event. Mathematically,
it is a measure that assigns a number [0,1] to a subset of a given set, and it follows the axioms of the probability theory. In practical application, the interpretation of a subset can be an event, so that the assigned probability represents the uncertainty of the event. When using probabilities and probability models in decision making, it is important to agree with the interpretation of the probability. The two main interpretations are the
subjective interpretation (also called Bayesian), and the frequency interpretation.
According to the frequency interpretation, the probability of an event is the relative frequency with which the event occurs in an infinitely long experiment. This means that the probabilities cannot be known exactly, since in practice there are no infinite series of experiments. However, the frequency interpretation makes it possible to estimate probabilities and to determine confidence bounds for unknown probabilities.
According to the subjective or Bayesian interpretation, probability is a rational degree of belief about the occurrence of an event. The probability depends on the information which the observer has about the occurrence of an event, which means that the assumed probabilities of different observers may be different. The Bayesian approach requires that all uncertainties are modelled with probabilistic concepts, and that the rules of probability calculus are followed in all inference.
The two interpretations of probability understand uncertainties differently. In the Bayesian approach, the probability is the measure of uncertainty, i.e., the uncertainty about the probability can be expressed by probability. This probability of probability, however, disappears when, e.g., finally assessing the uncertainty about an event. In the frequency approach, confidence bounds can be derived for the probability estimate. The confidence bounds cannot be compared with the Bayesian metaprobabilities, since they are answers to different questions.
Two types of uncertainties are distinguished: epistemic and aleatory. Epistemic
uncer-tainty is attributable to incomplete knowledge about a phenomenon that affects our
ability to model it. Acknowledging epistemic uncertainty would, e.g., mean that the probability of a failed component function can be said to be in certain range, without the possibility to specify it more in detail. Epistemic uncertainty may be reduced with time as more data is collected and more research is completed.
Aleatory uncertainty is caused by the nondeterministic (stochastic, random) nature of
phenomena. Aleatory uncertainty is also called variability. Acknowledging aleatory uncertainty would, e.g., mean saying that the probability of a failed function of a generic component is p, but as conditions vary between specific components and contexts, the failure probability of a specific component is within a certain range. Aleatory uncertainty cannot be reduced by further study, as it expresses the inherent variability of a phenomenon.
Since most probability estimates include both aleatory and epistemic uncertainties, the range of estimates that would account for both factors will generally be broader than either range assessed separately.
Risk is defined relative to hazards or accidents. A hazard is something that presents a
potential for health, economical or environmental harm. Risk associated with the hazard is a combination of the probability (or frequency) of the hazardous event and the magni-tude of the consequences. The consequences can be represented in several dimensions. A usual engineering definition of risk associated with an event i is:
Risk(event i) = “the probability of an event i” · “the consequences of an event i”. To assess the risk associated with a system (e.g. a nuclear power plant), integration over all accidental events associated with the system must be carried out.
In the classical approach to risk assessment, the probability p = P(A) of the unwanted event A is understood in a frequentist sense. p is estimated by using a model linking p and some parameters q, p = f(q). The parameters q can be estimated from data, thus yielding an estimator p* of p, i.e., p* = f(q*). With this approach, the only type of uncertainty that can be quantified is the statistical variation of q* [RESS_61(1998)3]. In the Bayesian approach, a clear distinction is made between observable quantities (events) and unobservable model parameters, so that the model for the probability of A is P(A) = g(q). Uncertainties are modelled explicitly using the Bayesian approach. The uncertainty of A is epistemic [RESS_75(2002)93].
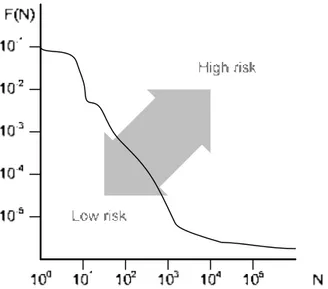
The individual risk is the risk faced by any specific individual as a result of an acciden-tal event. Typically, in risk analysis this is calculated for an anonymous person in the most exposed position. The collective, group or societal risk is the expected total risk in the population exposed to risk, often expressed as the number of casualties per unit time. Collective risk can be expressed by an F-N curve3 (The top right corner is associated with the high risk, and bottom left corner with the low risk.
Figure 1), which demonstrates the relation between the collective risk from small and large accidents. In F-N space, the top right corner is associated with the high risk, and bottom left corner with the low risk. If F-N curves for two systems do not intercept, it can be stated which system has lower risk and which has higher. If the F-N curves intercept, a risk comparison cannot be made without a utility function which expresses how much weight is put on smaller vs. larger accidents (see further discussion in the next chapter).
Risk measure and risk metrics are two concepts used in the presentation and interpre-tation of results from a risk assessment. The risk measure is an operation for assigning a number to something, and the risk metrics is our interpretation of the assigned number. In the PSA context, the various numeric results obtained from the quantification of the model are risk measures. The interpretations of these numbers as core damage risk, plant risk profile, safety margin, etc., are risk metrics.
Risk criteria refer to any quantitative decision making criterion used when results of
risk assessment are applied to support decision making. Various types of criteria can be
used, such as: absolute criteria, relative criteria, differential criteria and trade-off criteria [RESS_36(1992)23]. Absolute criteria are discussed in the next chapter.
N = number of casualties, F(N) = the frequency of an accident with N or more casualties.
The top right corner is associated with the high risk, and bottom left corner with the low risk.
Figure 1. Hypothetical F-N curve of risk associated with a system in log-log scale.
2.1.2 Risk acceptance concepts
Risk is acceptable if it is tolerated by a person or group. Whether a risk is "acceptable" or not, will depend upon the advantages that the person or group perceives to be obtainable in return for taking the risk, whether they accept whatever scientific and other advice is offered about the magnitude of the risk, and numerous other factors, political, social, and psychological.
Risk acceptance is often presented using the ALARP4 (As Low As Reasonably
Practicable) framework. ALARP divides levels of risk into three regions: 1. Unacceptable (intolerable) region. Risk cannot be justified on any grounds.
2. The ALARP or tolerability region. Risk is tolerable if the benefit is desired. Trade-off analysis is made to evaluate the need for risk reductions.
3. Broadly acceptable region. Risk is negligible. No need for further risk reduction. ALARP can be applied to a single risk metric. It can be also defined with an F-N curve. Figure 2 presents the risk acceptance criteria for major industrial accidents defined by the Dutch safety authority [VROM-1988].
F(N) = 10-3 N-2
.
4 Somemetimes also referred to as ALARA (As Low As Reasonably Achievable), with the same
A risk neutral acceptance criterion has the form k N-1
, where k is a non-negative factor. Thus, the Dutch criterion for unacceptable risk has an added aversion to large accidents.
While the F-N curve represents a high level safety goal, the CDF and LERF criteria used for interpreting PSA results can be regarded as surrogate safety goals of the high level safety goals. By using surrogate safety goals, which are easier to address, the role and importance of individual safety barriers can be assessed.
N F(N) 100 1 10-5 10-4 10-6 10-7 10-8 Unacceptable risk Acceptable risk ALARP region 10 Limit Target, objective
Figure 2. Societal risk curve with ALARP region as defined by VROM [VROM-1988]. Residual risk is the remaining risk which cannot be defined in more detail after
elimination or inclusion of all conceivable quantified risks in a risk consideration. Reactor vessel rupture is often given as an example of a residual risk. Based on
[WASH-1400], this has been interpreted to correspond to an event with a frequency of about 10-7 per year. The residual risk concept is applied in safety analysis as a screening criterion, e.g., as defined in [SKIFS 2004:2].
Safety objectives are the objectives to be achieved, e.g., for safe operation of nuclear
power plants (see e.g. [IAEA_INSAG-12]). In the implementation of safety objectives, quantitative targets called (quantitative) safety goals or numerical safety objectives need to be defined.
Regarding safety goals, the terminology varies between different references and
countries. For instance, EUR, the European utility requirements document for new light water reactors use the concepts “safety targets” and “probabilistic design targets” [EUR_2002]. EUR defines “targets” as values established by the utilities (e.g. related to the frequency of release of radioactivity), which are more demanding than current regulatory limits, but which are considered reasonably achievable by modern, well designed plants. On the other hand, the UK NII translates the risk acceptance criteria (limit of tolerability) into a Basic Safety Limit (BSL), which has the function of the upper bound of the ALARP region. The lower bound of the ALARP region is called
2.2 Decision theoretic background
In decision theory, decision making means comparison of alternatives using some rule. There is no theory providing a framework for rational collective decision making5 under
risk [NED_93(1986)319]. Nevertheless, decision theory provides a framework for characterising and comparing aspects of different approaches to risk decision making and use of safety goals.
Three types of approaches to risk decision making can be distinguished [NKS-44]. These are defined by the way deterministic analyses and risk analyses together address uncertainties and how the decision makers view the completeness and credibility of the related risk assessment.
1. An approach based on the theory of expected utility. 2. Value theoretic approach (risk-based).
3. Risk-informed approach.
These approaches are all described below. The two main points of view in nuclear risk decision making are also discussed, i.e., the investor’s point of view and the regulator’s point of view. In simplified terms, the investor makes comparison between risks and benefits of different investments, while the regulator makes comparison between risks (and perhaps benefits) of different risks in society.
2.2.1 The theory of expected utility
The first approach, and the normative way of risk decision making, is the subjective expected utility theory. According to the this theory, a decision maker is rational, when he/she chooses the decision option, which maximises the expected utility
[French_1986]. This requires that the decision maker is in a position to formulate all the criteria explicitly and to measure the outcomes of different decision options with
respect to these.
The risk model completely represents the best state of knowledge, and deterministic models and analyses have a supporting role only in defining the risk model. Insights obtained from these are redundant or embedded in the risk model. In this approach, all uncertainties are expressed as subjective probabilities (see Figure 3).
Risk acceptance criteria play no role in the expected utility framework. A risk, i.e., a decision option involving a risk, is accepted if it is better than the alternatives. The expected utility of the alternatives determines the acceptance.
Risk model Subjective probability distribution of consequences Decision options
Multiattribute utility function describing the preferences of
the decision maker or stakeholder Decision option with maximum expected utility
selected Deterministic
models
Figure 3. A utility theoretic approach to risk assessment and decision making.
The applicability of the theory of expected utility as a practical guideline in decision making under risk can be questioned for several reasons. The theory supposes that possible outcomes and associated probabilities can be fully assessed, which is a very hard requirement for real world cases. Both the assessment of outcomes and of probabi-lities are demanding exercises. Secondly, real world cases are usually diffuse and complex, so that any model only reflects a small piece of the decision making problem. Thirdly, the points of view of multiple stakeholders should be accounted for. If stake-holders do not agree on the probabilities and outcomes, the problem is outside of the theory of expected utility. Finally, in practical decision making, people do not behave according to the axioms of the theory [Kahneman-Tversky]. These situations deal more with decision making under uncertainty, where the probabilities of outcomes are not well explicated.
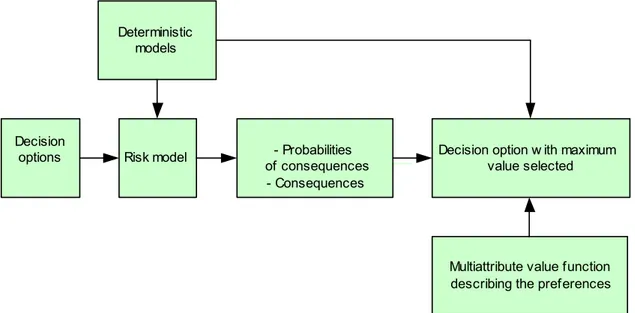
2.2.2 Risk-based approach using value theory
The second approach to risk assessment is based on the use of value theory
[Fishburn_1970]. The risk model yields probabilities of defined adversarial consequen-ces. The decision maker expresses his/her preferences in the form of a value function aggregating the different attributes, which are now the probabilities and the correspon-ding consequences. The decision option with the maximum value is selected.
In this approach, deterministic models have a double role; in addition to supporting the definition of the risk model, they provide evidence related to deterministic decision criteria, as shown in Figure 4. The deterministic decision criteria may be incorporated into the value model, and it is possible to make trade-offs between the different criteria. The deterministic criteria are typically related to design and/or safety principles, etc., which are models in themselves. The deterministic analyses guide the development of the risk assessment which, in turn, completes the insights obtained from the
)
,
( x a d P
Risk model - Probabilities of consequences
- Consequences Decision
options
Multiattribute value function describing the preferences Decision option w ith maximum
value selected Deterministic
models
Figure 4. A value theoretic approach to risk assessment and decision making.
It should be noted that known probabilities, e.g., CDF and LERF, are possible to treat as decision criteria in the approach. It is therefore possible to interpret e.g. the ALARP-principle and risk-based decision making from this perspective. Acceptable risk can be used as a boundary condition of the value function.
2.2.3 Risk-informed approach
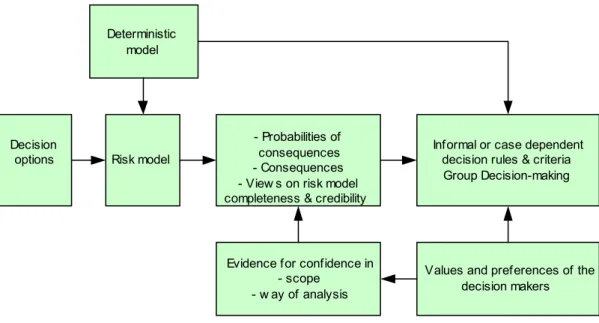
The third approach to risk assessment is risk informed decision making, which is more informal compared to the previous approaches. It admits a very complex decision context, and only some of its aspects can be described with deterministic and probabi-listic models. The risk analysis yields the probabilities of consequences, but the uncertainties are significant, which means there is a need for the stakeholders to establish among themselves a shared understanding of the risk assessment results. The decision rule(s) and criteria are determined for each case separately, and the values and preferences of the decision maker(s) are informally linked to the risk assessment. Decision panels or other group decision approaches are utilised (Figure 5).
It is important to note that the stakeholders and the decision maker(s) search for evidence consolidating their personal confidence regarding the risk assessment scope and the risk analysis method. Completeness and credibility are important attributes in this process. This informal approach to risk assessment corresponds to the risk informed decision making process.
) , ( x a d P Risk model - Probabilities of consequences - Consequences - View s on risk model completeness & credibility Decision
options
Values and preferences of the decision makers Informal or case dependent
decision rules & criteria Group Decision-making
Evidence for confidence in - scope
- w ay of analysis Deterministic
model
Figure 5. An informal approach to risk assessment and decision making.
2.2.4 Risk decision making as an investment problem
In an investment decision making situation, the following elements need to be assessed and explicated:
x benefits of the intended enterprise (e.g. operation of a nuclear power plant) in monetary terms
x risks (costs and probabilities) associated with the enterprise
x comparison of investor’s preferences over different types of investments. If the investment is accepted, a boundary for the level of acceptable risk can be calculated. The alternative is not to make the investment. In the case of an operating plant, the ultimate alternative for judging the level of acceptable risk is the terminal plant shutdown.
The acceptable risk is specific to the decision making situation. It varies between different plants, it is different for a new plant compared to an operating plant, and it changes during the lifetime of the plant.
2.2.5 Risk decision making from the regulatory perspective
The regulator’s perspective is to supervise and regulate all risks to human beings and environment. The decision making on acceptable risk is culminated in the licensing process. A nuclear power plant is a source of risk among other industrial risks. The regulator would like to see a demonstration that the risk from a nuclear power plant is small enough compared to other technological risks. This is the idea of, e.g., the safety goals defined by the U.S.NRC.
x comparison and valuation of risks in society to be used as reference x justification of results and conclusions of the risk assessment.
Accident statistics exist for the determination of the overall risk level for human beings. The assessment of different risks is a more complex issue since, many factors affect people’s risk perception.
When considering risk from a nuclear power plant, this risk cannot be directly
compared to any other man-made risk. However, appropriate references could be risks from other industrial facilities and other cancer-related risks. The assessment of an acceptable risk level can, thus, be a many faceted decision making situation:
x it is a political problem in the sense that society should decide what kind of risks are accepted and carry the responsibility of this decision;
x it is a juridical problem in the sense that the legal role of a safety goal needs to be clarified;
x it is a research problem in the sense that objective knowledge needs to be gained about various risks in society;
x it is a systems engineering problem first to design a plant that fulfils the requirement, and then to demonstrate the fulfilment of the requirement.
2.3 Context of safety goals
There are different reasons for defining safety goals, and the reasons may differ between different types of organisations. One aim may be to provide a tool to control the risk posed to society by the operation of nuclear power plants by defining a maximum acceptable risk. This risk may be related to the population potentially exposed to the risk, but may also be related to some other entities, e.g., land
contamination. When relating calculated risks to such a safety goal it can in principle be used in an absolute manner giving the answer ‘Yes’ or ‘No’ to the question of whether the risk is acceptable or not.
In other cases the focus is more on using the safety goal as part of a decision criterion. Here, the safety goal constitutes a reference level and the key issue in the analysis is the relative deviation from the absolute level, or the degree of change relative to the results for other plant configurations or designs.
The actual definition of a safety goal involves two elements, the definition of the risk metric and of the maximum frequency allowed in terms of the risk metric chosen. The frequency part is quite simple (but not necessarily uncontroversial), and is done by stating one or more frequency levels, e.g., 10-5 per year. The process used to derive the frequency may be more or less complex and sometimes relates to higher level safety goals, e.g., to overall safety goals on a national level.
The definition of the risk metrics can be a more complex activity, as it should be possible to relate the risk metrics to the degree of harm experienced by the population exposed to the risk (or other risk metrics). As an example, there is no simple connection of this kind between the core damage frequency for a nuclear power plant and the degree of risk experienced by the public. For level 2 PSA criteria (radioactive release),
the connection is more evident, but not necessarily straight-forward and easily interpreted. In contrast, safety goals for other man-made risks are often expressed in terms of frequency and number of fatalities (F-N curves), which usually provides safety goals which are easier both to interpret and to apply. The F-N curve approach may also be chosen for criteria related to the results of a level 3 PSA.
A related question is the definition of the target PSA of the safety goal, which needs to be precisely stated in order not to create ambiguity in the application of the goal. The target PSA is the probabilistic plant model and calculation procedure that are used in order to calculate the risk level which is to be compared to the safety goal. Thus, the scope of the analysis leading up to the quantitative assessment of the risk measure needs to be clearly stated. Basically the precise and unambiguous definition of the target PSA should be part of the statement of the safety goal.
Once a safety goal has been defined, there is a need for an accepted procedure for carrying out the quantitative risk assessment, for applying the goal to the relevant risk measure, and for acting on the outcome of the application. In this context a number of issues must be considered. The basic outcomes are either that the safety goal is fulfilled, or that the plant is found not to meet the safety goal. In case of exceedance of the safety goal, there is a need for a procedure for handling the deviation and for assessing the severity of the deviation.
Thus, there is a need for defining how to decide that a safety goal has been met, i.e., criteria for accepting a calculated risk. Among other things, it needs to be stated whether it is the mean value of the calculated risk metric that shall meet the goal or if the comparison with the safety goal shall be done for some percentile in the uncertainty distribution of the result.
If, on the other hand, the outcome is that the safety goal is exceeded, there is a need for procedures to handle the deviation. Usually the simple answer “acceptable” or “not acceptable” is not sufficient, and there is often a need for a graded approach, which considers the extent to which the calculated risk deviates from the safety goal.
An important question in cases where the safety evaluation of an activity is more or less continuous, as is the case with the PSA for a NPP, is the consistency of risk judgments over time. Safety goals are typically quite stable, while PSA results may vary
considerably over time. This may be due to changes in the actual plant (system
redesigns, procedure changes, etc.). However, there is typically also a large impact from changes in the scope of the PSA or from changes in analysis methods or data used.
3 The Evolvement of Safety Goals
3.1 Introduction
This chapter summarises the various probabilistic safety goals defined for nuclear power plants in Finland and Sweden, and also includes a more general PSA related background. It presents the history of the evolvement of safety goals, as well as views and experiences from their usage. The contents of this chapter is to a large extent based on interviews with some of the people who were involved in the definition of the safety goals, or who have had reason to apply the goals in various situations. Much of the information also comes from the background documents referenced in the interviews. The people interviewed are listed in Attachment 1, which also presents the interview questions used.
Table 1 provides an overview of PSA related activities in Sweden and Finland from around 1975 until today.
Table 1. Overview of PSA activities in Sweden and Finland from 1975 until today.
Phase Activities Sweden Activities Finland
1975 - 1980 x Government Energy Commission
x Reactor Safety Investigation x Comparison with WASH-1400
x Application of WASH-1400 to Loviisa (limited level 2 PSA)
x Reliability analyses of safety systems
1980 - 1985 x PSA level 1, internal events x Initiation of PSA programmes
x NKA/SÄK Nordic Research Program x Data collection and evaluation (T-book etc.) x Development of computer tools for PSA 1985 - 1990 x Severe accident mitigation
x Initial level 2 PSA:s x PSA for area events
x SUPER-ASAR comparative PSA review
x First YVL-2.8 PSA guide from STUK x Basic level 1 PSA:s completed x STUK’s requirement on severe
accident mitigation at operating units x NKA/RAS Nordic Research Program
1990 - 1995 x Completeness of existing PSA models x Common Cause Initiators (CCI) x PSA level 2
x PSA for shutdown period
x Council of State decision 395/1991 x Use of PSA for safety improvements x PSA for area events / external events x PSA for shutdown period
x Living PSA and PSA applications x NKS/SIK Nordic Research Program
x APRI – Research on severe accident phenomena
1995 - x PSA for external events
x Living PSA and PSA applications x Quality assurance of PSA:s x SKIFS 1998:1 / 2004:1 (Safety in
Nuclear Facilities) x Risk-informed applications
x PSA level 2
x YVL 2.8 guide updated 1996/2003 x Design phase PSA for Olkiluoto 3 x Risk-informed applications
x NKS/RAK Nordic Research Program x NKS-R Nordic Research Program
In the 1970s, a few limited PSA:s were made inspired by WASH-1400. The plant-specific PSA programmes were initiated in the 1980s. During this decade, methods and
PSA codes were developed and systematic reliability data collection was initiated. In the 1990s and up to today, PSA:s have been complemented with missing parts and living PSA applications have been tried out. During the past decade, significant plant modifications, involving safety improvements, power up-rates and modernisation of I&C systems, have taken place in the plants. PSA has been used in the planning of these modifications as well as in the licensing context.
3.2 History of PSA safety goals in Finland
The possibilities of using probabilistic methods in nuclear safety management were recognized by the Finnish authorities and licensees in the early 1970s while the Loviisa and Olkiluoto NPP:s were under construction. The first PSA projects were initiated for both the plants in the early 1980s and the first level 1 PSA:s, including analysis of internal initiating events, were submitted to STUK in 1989.
In the 1990s, the PSA:s were complemented with analyses of area events, low power and shutdown operating modes, external events and level 2 PSA. Also the use of PSA in different applications started. Now, PSA:s are part of risk-informed regulation and safety management.
A special aspect in the Finnish history of PSA and safety goals is the long lasting plan-ning of the fifth unit. The STUK’s regulatory guide on PSA, YVL2.8, first issued in 1987, was formulated from the very beginning to be used in the licensing of a new NPP. Since the mid 1980s, several NPP concept candidates have been analysed using PSA, keeping not only the STUK’s numerical objectives in mind, but also other guides, such as the European Utility Requirements [EUR_2002]. The Olkiluoto 3 NPP, which is now under construction, is the only Finnish plant that has gone through a regulatory review including the comparison with quantitative probabilistic limits.
3.2.1 Radiation and Nuclear Safety Authority of Finland (STUK)
3.2.1.1 Nuclear regulation in FinlandNuclear regulation in Finland is set forth in the Nuclear Energy Act [YE-laki 990/1987] and the nuclear decree [YE-asetus 161/1988]. The nuclear law and decree are rather detailed and define some fundamental issues connected to the licensing process and to nuclear safety. The Decision of the Council of State [VnP 395/1991] gives the second level of nuclear regulatory requirements as applied in Finland. More detailed require-ments, i.e., the YVL guides, are issued by STUK according to Nuclear Energy Act 55 § and VNp 990/1991 29 § [YVL-review].
The YVL guides form the actual regulatory system, although they in principle are on a lower level (less prescriptive) than the decisions of STUK. YVL guides are not legally binding, but constitute advisory rules for the licensees. The regulatory system allows deviations from the requirements of the YVL guides, provided the licence holder presents an acceptable solution by which the safety level given in the YVL guides is attained.
The YVL guides as such apply to new nuclear facilities. Upon revision of an old guide when a new guide is issued, the licensees send to STUK a statement, how the
require-separate decision regarding the application to existing installations. The publication of a YVL guide does not necessarily alter any decisions made by STUK prior to the publi-cation.
The nuclear energy act and decrees gives STUK the mandate to define and supervise the safety requirements of the nuclear installations. In Finland this is done through the regulatory system and not in individual plant licensing conditions. In addition STUK can issue letters (decisions) to the licence holder if a plant inspection or some other cause reveals findings that require corrective actions. Letters may also list new require-ments to implement or actions that the licence holder must conduct within a specified time. As an example, requirements on PSA activities for operating plants are mostly stated in letters. According to VNp 395/1991, 27 §, actions for further safety safety enhancement shall be taken which can be regarded as justified considering operating experience and the results of safety research as well as the advancement of science and technology.
3.2.1.2 History of safety goals
In the late 1980s, the plan to build a new plant caused a need to develop regulatory guides for licensing a new NPP. The first version of the regulatory guide for PSA, Guide YVL 2.8 was issued in 1987 [STUK_YVL-2.8-1987]. In this issue, performance of a so called mini-PSA was required for the construction permit, and numerical design objectives were defined for important safety functions. The idea of using safety function level criteria was STUK’s own innovation. At this time, the PSA methodology was not regarded as mature enough for use of CDF- and LERF-level criteria.
The mini-PSA required for a construction permit was a level 1 PSA including the most important initiating events. For an operating license, a complete level 1 PSA and a concise level 2 PSA were required.
The YVL 2.8 was revised in 1996, e.g., by extending the requirements on the use of PSA to further applications [STUK_YVL-2.8-1996]. A design phase PSA was required for a construction license. The contents of the design phase PSA was defined in more detailed compared to the mini PSA defined in the 1987 guide. Regarding PSA safety goals, numerical design objectives were now also defined for the core damage
frequency and the frequency of a large radioactive release. The numerical objectives 10
-5
per year for core damage and 5·10-7 per year for release were derived by comparing results from existing PSA:s in the 1980s and early 1990s and criteria presented in international guidelines, above all the IAEA INSAG-3 [IAEA_INSAG-3].
The CDF criterion 10-5 per year was considered a challenging but possible objective for a new NPP. The release criterion 5·10-7 per year corresponds to a conditional probability of 0,05 for a containment failure. The limit for a severe accident, 100 TBq release of Cs-137, was defined in a Decision of the Council of State [VnP 395/1991] in 1991. It was taken from Swedish studies performed in the context of designing filtered venting systems in the 1980s [SKI_SSI_1985], further described in Chapter 3.3.2.2. The limit of 100 TBq corresponds to a small release, which makes the level 2 PSA objective very tight. In this way the probabilistic criterion is in line with the stringent deterministic criteria.
The present version of YVL 2.8 was issued in 2003 [STUK_YVL-2.8]. It extended further the area of PSA applications and former optional applications were made mandatory. Regarding numerical design objectives, safety function level objectives
were removed from the guide. The reason for this was, that safety functions presumed the reactor type to be of certain kind, which could make the guide inapplicable for other conceivable reactor types.
Table 2 summarises the numerical design objectives defined in different versions of guide YVL 2.8.
Table 2. Numerical design objectives defined in different versions of STUK’s PSA guide YVL-2.8
Version Numerical design objective
1987 The unreliability of the most important safety functions is required to be below the following design objectives, with a confidence of at least 90 %:
Safety function
x Reactor scram
x Isolation of the containment
x Supply of feedwater when off-site power is lost and the main feed water system has failed x Operation of emergency core cooling, including
long term recirculation in the case of a small LOCA
x Reactor depressurisation together with long-term cooling of condensation pool (BWR)
Failure probability per demand 10-5
5·10-3 10-4
10-4
10-4
1996 The mean unreliability of the most important safety functions shall be smaller than the following design objectives:
Safety function
x Reactor scram
x Supply of feedwater to steam generators (PWR) or to the reactor vessel (BWR)
x Operation of emergency core cooling in the case of a small LOCA
x Isolation of the containment
Failure probability per demand 10-5
10-4
10-4
10-3
The mean value of the probability of core damage is less than 10-5 per year. The mean value of the probability of a release exceeding the target value defined in section 12 of the Council of State Decision (359/1991)1 must be smaller than 5·10-7 per year. However, the containment has to be designed in such a way that its integrity is maintained with a high likelihood in case of both low and high pressure core damage. 2003 The mean value of the probability of core damage is less than 10-5 per year. The mean
value of the probability of a release exceeding the target value defined in section12 of the Government Resolution (359/1991) 1 must be smaller than 5·10-5 per year.
1
Section 12 of the Government Resolution (359/1991) [VnP 395/1991]. Limit for a severe accident: The limit for the release of radioactive materials arising from a severe accident is a release which causes neither acute harmful health effects to the population in the vicinity of the nuclear power plant nor any long-term restrictions on the use of extensive areas of land and water. For satisfying the requirement applied to long-term effects, the limit for an atmospheric release of Cs-137 is 100 TBq. The combined fall-out consisting of nuclides other than caesium isotopes shall not cause, in the long term, starting three months from the accident, a hazard greater than would arise from a caesium release corresponding to the above-mentioned limit.
In addition to the above numerical objectives, the regulatory guide requires a balanced risk profile: The risks associated with various initiators and accident sequences, taking
and with each other in order to ensure that no single or few prevailing risk factors will stay at the plant. Particularly, such phenomena whose frequency of occurrence and consequences include large uncertainties shall be carefully examined. These are for example exceptional weather conditions, other possible harsh environmental conditions and seismic events. This paragraph has been used in Olkiluoto 3 licensing context.
According to STUK’s decision on the application of Guide YVL 2.8, the numerical objectives are not applied to the operating plants. However, the principle of further safety enhancement is applied.
3.2.2 Teollisuuden Voima Oy (TVO)/Olkiluoto NPP
TVO operates two identical boiling water reactor units of ASEA Atom design, Olki-luoto 1 and 2 and is constructing OlkiOlki-luoto 3, a new pressurised water reactor of Areva design.
TVO started development of numerical criteria while developing PSA applications in the early 1990s. The first applications were planning of preventive maintenance during power operation, optimisation of allowed outage times, and test interval optimisation. The criteria were based on results from PSA, numerical objectives defined in YVL-2.8 and the U.S.NRC’s regulatory guides 1.174-1.178 [RG_1.174, RG_1.175, RG_1.176, RG_1.177, and RG_1.178]. They are formulated in an internal PSA guide [TVO-PSA-ohje].
According to the PSA guide, a permanent design change is not allowed to increase the core damage frequency or frequency for unacceptable radioactive release by more than 1% of the target value. Target values are the same as in YVL 2.8 (10-5 per year, 5·10-7 per year). A higher risk increase must be justified. Temporary work (done only once in plant lifetime) may not cause more than a 40% risk increase compared to the annual target value. The 40% criterion relates to the planned lifetime for the plant, i.e., 40 years.
For temporary exemptions from Technical Specifications, STUK requires a PSA evaluation. In this case as well, TVO applies the 1% risk increase criterion, as well as the requirement, that higher risk increases must be justified.
TVO’s PSA guide has been sent to STUK for notification. STUK has not formally approved the criteria, and each PSA application is evaluated separately by STUK. Regarding objectives for core damage frequency and LERF, the numerical objectives defined in YVL-2.8 are desired but not mandatory targets for the operating units OL1/OL2. Currently (2006), the CDF calculated by PSA is 1,5·10-5 per year. For OL3, the numerical objectives defined in YVL-2.8 are mandatory.
3.2.3 Fortum/Loviisa NPP
Fortum operates two identical Russian type (VVER) pressurised water reactor units, Loviisa 1 and 2.
In Loviisa NPP, PSA has been used in decision making on plant modifications since 1989 when the basic level 1 PSA was completed. The first results showed high core damage frequency, which lead to several safety improvements. PSA was used in the prioritisation of changes and comparison of alternatives. In this decision making,
criteria are needed and therefore goals were developed. The aim has been to have realistic goals. Comparisons have been made with goals defined in other countries and with risks accepted by the society in other activities. US references were used mostly, since the USA has the longest history in the nuclear field.
Numeric PSA goals are formulated in a bulletin, which is not part of an official instruction procedure. The goal regarding core damage frequency is 10-4
per year and regarding frequency of large release 10-5
per year. Loviisa has so far always been above these goal numbers, but the CDF is now below 10-4
per year [CM-06-Fortum]. Signifi-cant plant improvements have been made during the last decades to decrease the risk level of the plant.
Loviisa has also developed economic criteria for justification of safety improvements [NED_185(1998)335, Vaurio_NKS-99]. These criteria could be used also for justifi-cation of plant modifijustifi-cations that can increase core damage risk. In practice, compensa-ting measures are often applied, especially since the CDF has not been below the limit 10-4 per year until now. Criteria have been defined based on an estimation of the
monetary value of core damage and large release. In the mid 1990s, the value in level 1 PSA was 200 kFIM equal to 'CDF = 10-6
per year6. In level 2 PSA, the price was 30
times higher.
3.2.4 Finnish experience
The overall Finnish experience on the use of PSA safety goals is positive. Attention is paid to the comparison of numerical results. Safety goals also affect the quality of PSA by requiring more detailed modelling of some issues. Conservative assumptions need to be avoided since they do not only make the numbers look too bad but most importantly, can misdirect resources to areas that may not be as important as others. Safety goals thus are an incentive to make better analyses.
There is a common view regarding the definitions for core damage and large release. Core damage is defined as local fuel temperature above 1204 ºC and large release as an atmospheric release of more than 100 TBq of Cs-137, as defined in [VnP 395/1991]. It is also a common understanding that a full scope PSA should be used in the comparison with safety goals.
For old plants, the safety goals defined by the utilities are unofficial targets, and set an ambitious goal for safety improvements. Safety goals also mean that plant changes and exemptions from licensing conditions need to be assessed numerically. PSA and PSA criteria have become well-known in the organisations.
The probabilistic criteria applied to operating plants are not strict, which allows more flexible handling of risk. An open question is how old plants will be treated in the regulatory decision making in the future. Application principles may change, which may cause uncertainty among licensees.
Making plant improvements promptly based on the most current PSA has satisfied authorities and so allowed the utility to proceed in a self-controlled manner. In some cases PSA has helped to avoid unnecessary changes suggested on a deterministic basis.
![Figure 2. Societal risk curve with ALARP region as defined by VROM [VROM-1988]. Residual risk is the remaining risk which cannot be defined in more detail after](https://thumb-eu.123doks.com/thumbv2/5dokorg/3357457.19326/17.892.133.524.303.591/figure-societal-alarp-region-defined-residual-remaining-defined.webp)


![Figure 6. Simplified comparison of risks from exposure to radon with other common risks [SKI_SSI_1985]](https://thumb-eu.123doks.com/thumbv2/5dokorg/3357457.19326/33.892.75.778.240.710/figure-simplified-comparison-risks-exposure-radon-common-risks.webp)