Kalmar ECO-TECH '07 KALMAR, SWEDEN, November 26-28, 2007
UTILIZATION OF THE TREATMENT PLANT'S
SLUDGE AS A GLASS
Mehmet Burrin Piskin
Nurcan Tugrul
Emek Moroydor Derun
ihsan Mert Turkkal
Yild1z Technical University
ABSTRACTIn this study, physical and chemical characteristic of the treatment sludge obtained by Bergama- Ovac1k treatment plant and the possibility to evaluate them in glass industry were investigated, In this treatment plant, 277,882 tons of sludge is annually produced. The chemical composition of the waste sludge's is determined by gravimetric method and it is examined by X-Ray diffraction (XRD), X-Ray fluorescence (XRF) and Fourier Transform Infrared Spectrophotometer (FT-IR) equipments. The chemical composition of the treatment sludge showed that it is potential to be used in a glass industry to produce Borosilicate glass and Flat glass with the addition of chemical substances. In order to examine the composition of the samples, their analyses were made by (FT-IR) and (XRF) equipments,
KEYWORDS
Treatment sludge; Flat glass; Borosilicate glass, I INTRODUCTION
Recycling and evaluation of wastes obtained from the industrial processes has become a worldwide concern, especially in the last few years and claims for a solution in the near future [I].
Domestic and Industrial wastewater treatment with physical, chemical and biological processes have approximately between 0,25-12% of solid substances, being known as sludge, [2].
This sludge leads to some serious environmental problems because of the presence of pathogen and toxic compounds, Besides, it constitutes significant storage and transport problems. In the treatment plants, the units which are related to the disposal of the sludge that comes out constitute approximately 50% of the total investment cost [3]. Due to the development of industry and the increasing population in Turkey, the studies and researches about this topic are being considered to be significant especially in the last years.
It is clear that the sludge from wastewater treatment plants will reach larger amounts because of the increasing population and the addition of the new treatment plants, On account of the problems of the treatment sludge will reach wider extents in the forthcoming years, For instance; in Turkey approximately 3 million tons of sludge is produced from the industrial wastewater treatment plants in a year [4]. However, these wastes will be decreased in a
distinctive rate by the evaluation with a proper process and it can be beneficial in both economic and environmental aspects, by the use of raw materials or fuel especially in energy production.
Vitrification is a well-established technique for converting several wastes into materials for possessing is considered to be a remarkable chemical stability. In fact, various inorganic wastes are constituted by glass-fanning oxides or may be dissolved in a silicate melt provided by glass-fom1ing additives [5).
In this study, the detennination of the characteristics of the sludge obtained by Bergama Ovac1k Gold Mine treatment plant and the use as raw materials in Glass Industry have been investigated.
2 EXPERIMENTAL 2.1 Material
The treatment of sludge that is assured by Bergama-Ovac1k Gold Management Plant was used as a basic raw material in experimental studies. During the production, 277,882 tons of treatment sludge is erupted in the treatment plant every year. The sludge contains 89.42% of SiO2. The chemical composition of the sludge is given in Table 1. Moreover, in order to produce glass, sodium carbonate, boric acid, calcium carbonate and magnesium carbonate were used as chemical additives.
Table 1. Chemical composition of Berga ma waste.
SiO2(%) Cao(%) Total(%)
89.42 3.85 2.12 0.30 0.1 1.69 100
2.2 Equipment
• High temperature furnace, which can reach to l 600 ° C in order to melt glass and melting pots which are durable to high temperature were used.
• Chemical characterization of the waste and the obtained glasses were carried out using Spektro X-LabPro X-ray fluorescence (XRF) apparatus.
Kalmar ECO-TECH '07 KALMAR, SWEDEN, November 26-28, 2007
= \
i \ \ loo:)I
,
'--
---..,..J'-,,.,l\,.¥.,,,1.-I
1i
2Tneu (jFigure 1. XRD diagram of the waste.
• Perkin Elmer Fourier Transform Infrared Spectrophotometer (FT-IR) was used for investigation of chemical bounds and molecular structure of materials. Experiments were carried out in the variation of wavelengths from 4000 to 450 cm-1• Powdered samples were mixed with KBr and sample pellets were obtained after applying pressure of I 00 bar.
• The X-ray diffraction (XRD) measurements of the obtained waste were carried out using a Philips Panalytical X'Pert Pro diffractometer, with a Cu-Ka source, at 45 kV and 40 mA. The samples were mounted on a glass sample holder.
3 RESULTS
3.1 Cha.-acter-ization of the waste
The functional group and micro structural characteristics of the waste were examined by XRD, XRF and FT-IR instrumental analysis device.
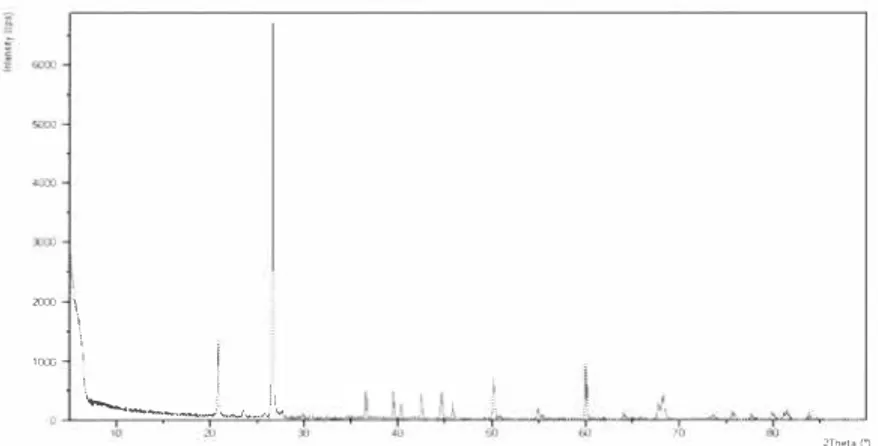
3.1.1 XRD diagram of the waste
The XRD diagram was recorded to be diffraction angle which changes between 0-90e° . According to the XRD diagram, that is given Figure 1, the characteristic peaks of the waste were seemed to be in approximately 20e° , 27e° , and 60e° diffraction angle.
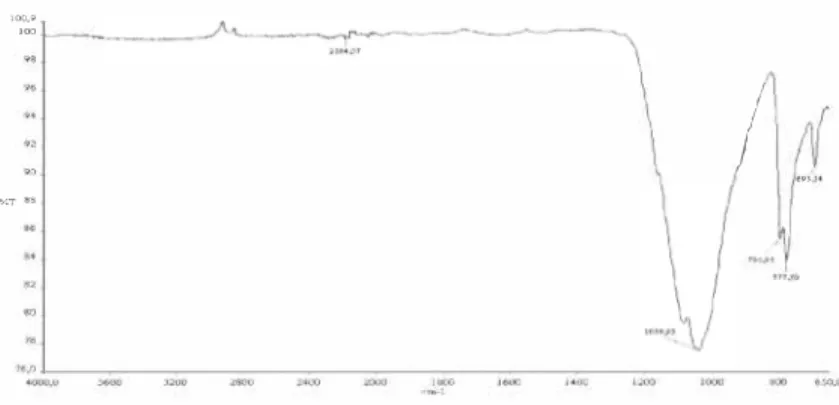
3.1.2 FT-IR spectrum of the waste
The functional group structure of the samples between 4000-650 cm-1 wavelengths, were examined by FT-IR spectrometric method. The sample made to become a pellet by mixing KBr powder at a proper rate and it is prepared for FT-IR analysis. FT-IR absorption band obtained for waste sludge were centered at 2184, I 039, 795, 777, 693 cm-1• The band at 2184 cm-1 shows the absorption bands of the O-H stretching. It can be seen from Figure 2 that there is a broad band centered at vibration at 1039 cm-1 [6]. The band can be attributed to Si-O-Si symmetric stretching in cyclic structure. There is a band centered at 795 cm-1 and a sharp vibration at 777 cm-1. Two bands were attributed to the SiO4 asymmetric Si-O-Si band (SiO2). The band at 693 cm-1 was assigned to the O-Si-O band [7],
KALMAR, SWEDEN, November 26-28, 2007 )00.9 ,oo
I
-es v.TFigure 2. FT-JR spec/rum of 1he waste. 3.1.3 XRF results of the waste
The chemical composition of the waste was examined by X-Ray fluorescence technique. When the XRF results of the sludge were examined, it was observed that the waste has Fe ion in large amounts (Table 2).
Table 2. XRF resulls of 1he wasle.
Element Concentration Element Concentration
Ti <0.0069 In <0.030 V <0.0269 Sn <0.050 Cr < 0.030 Sb <0.050 Mn 0.0312
w
<0.025 Fe 1.48 Ga <0.010 Co <0.020 Zr 0.050 Ni <0.015 Nb 0.1402 Cu < 0.010 Au <0.020 Mo 0.2527 Pb <0.020 Pd 0.02360 Rh <0.002 Ag 0.002 Zn 0.0100 Cd <0.050 Pt <0.020 3.2 Glass production3.2.1 Borosilicate glass production
Three frits were prepared for Borosilicate Glass production, and they were called I, BG-2, and BG-3 glasses (see Table 3). Three mixtures were prepared by adding boric acid and sodium carbonate to the treatment sludge obtained from Bergama for Borosilicate Glass (Pyrex) production. The chemical compositions of these mixtures were given in the Table 4.
Kalmar ECO-TECH '07 KALMAR, SWEDEN, November 26-28, 2007 Table 3. The mixtures that were prepared.for Borosilicate glasses.
Glass identity BG-I BG-2 BG-3
Waste Loadinge(%) 83 85 80 SiO2 (%) 8203 (%) 13 12 15 Al2O3e(%) MgO (%) Caoe(%) Na2O (%) 4 3 5 K2O (%) Totale(%) 100 100 100 Melting Temperatures (e° C) 1350 1350 1325
Table 4. Chemical composition of the samples afier the mixture in Borosilicate glasses production.
Glass identity SiO2 (%) 8203 (%) A'2O3 (%) Fe2O3 (%) CaO (%) Na2O (%) K2O (%) Total (%)
BG-I 75.2 11.9 3.2 1.78 0.25 4.2 1.42 100
BG-2 76 12 3.27 1.8 0.225 3 1.437 100
BG-3 71.5 15 3.08 1.7 0.24 5 1.35 100
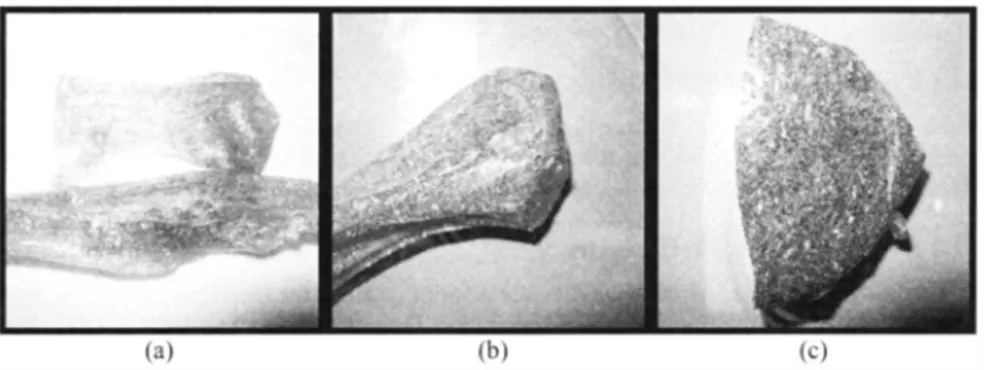
The mixtures were mixed in a grinder for two hours. The mixtures which are prepared for Borosilicate Glass Production were put into the melting pot and they were melted in high temperature furnace. The BG-I glass was melted at l 350e° C, BG-2 glass was melted at l 350e° C and the last glass BG-3 was melted at l 325° C by controlling during definite time periods. The aspects of the melted glasses after cooling are shown in Figure 3a-c.
Table 5, XRF results of BG-I, BG-2 and BG-3 glasses,
mresults of ::gg;:results of XRF results of
BG-1 BG-2 BG-3
Element Concentration Concentration Concentration
Ti < 0.0077 < 0.0068 < 0.0074 V 0.0172 < 0.035 0.0152 Cr < 0.030 < 0.030 < 0.030 Nill 0.0352 0.0242 0.0326 Fe 1.246 1.26 1.19 Co < 0.020 < 0.020 < 0.020 Ni <0.015 <0.015 < 0.015 Cu < 0.010 < 0.010 < 0.010 Mo 0.2687 0.2275 0.2617 Pd 0.02071 0.01861 0.02071 Ag 0.01812 0.01850 0.01945
S;j
In
< 0.050 < 0030 < 0.050 < 0.030 < 0.050 < 0.030 Sn < 0.050 < 0.050 < 0.050 < 0050 < 0.050 < 0.0502£
w
< 0.02 5 < 0.02 5 < 0.02 5 \Ja < 0.010 < 0.010 < 0.010 0.0555 0.05017 0.05658?-r
0 1 590 0 1 1 2 5 0 1473Nb
Au < 0.020 < 0.020 < 0.020 Pb 0.0256 0.01842 0.02 2 2Rh
< 0002 < 0.002 < 0002 Zn <0.010 <0.010 <0.010 Pt < 0020 < 0.020 < 0.0203.2. I. I Borosilicate glass XRF results
The chemical compositions of Borosilicate Glass were examined with X-Ray fluorescence technique. When the XRF result of the sample that is given in Table 5 was examined, it was observed that the glass has Fe ion in large amounts,
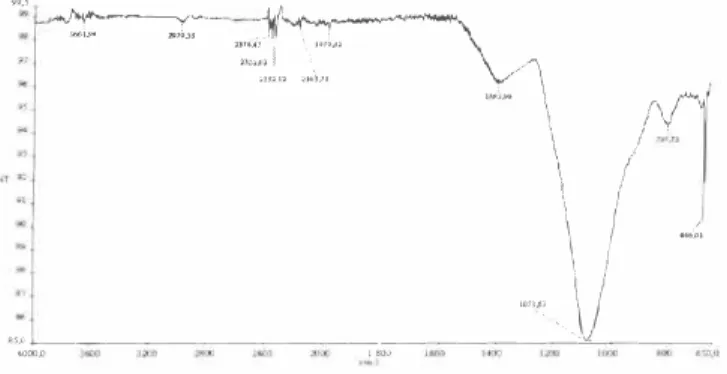
3.2.1.2 Borosilicate glass FT-IR results
In our study we made use of the characteristic absorption lines for the crystalline SiO2. The FT-IR spectrums of Borosilicate Glass were shown in Figures 4. 5 and 6,
�-'
·�
Kalmar ECO-TECH '07 KALMAR, SWEDEN, November 26-28, 2007
100 �· .
J•••.u
�•T "6,0
Figure 4. FT-IR spectrum of the BG-I glass.
Figure 5. FT-IR spectrum of the BG-2 glass.
�---y-·;:
� N''
..
,\/
85��.---,---�--�
3.2.2 Flat glass production
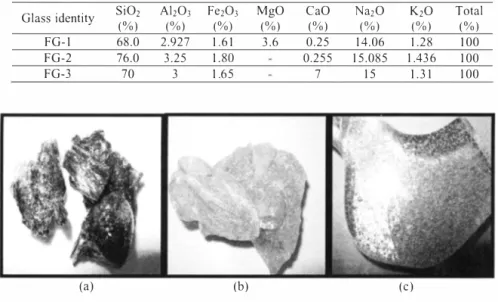
Three frits called FG-1, FG-2 and FG-3 glasses were prepared for Flat Glass production. Mixtures were prepared by adding sodium carbonate; calcium carbonate and magnesium sulfate to the waste sludge obtained from Bergama for the flat glass production (see Table 6). The melting temperatures were detennined respectively as l 282e° C, l 250e° C and l 250e° C. The
aspect of the melted glasses at room temperature was shown in Figure 7a-c. Table 6. The mixtures that were prepared.for Flat glasses.
Glass identity SiO2
(%) Al2Oi (%) Fe2Oi (%) MgO (%) CaO (%) Na2O (%) K2O (%) Total (%)
FG-1 68.0 2.927 1.61 3.6 0.25 14.06 1.28 100
FG-2 76.0 3.25 I .SO 0.255 15.085 1.436 100
FG-3 70 3 1.65 7 15 1.31 100
(a) (b) (c)
Figure 7. ,Aspect of' (a) FG-1, (b) FG-2 and (c) FG-3 glass at room temperature.
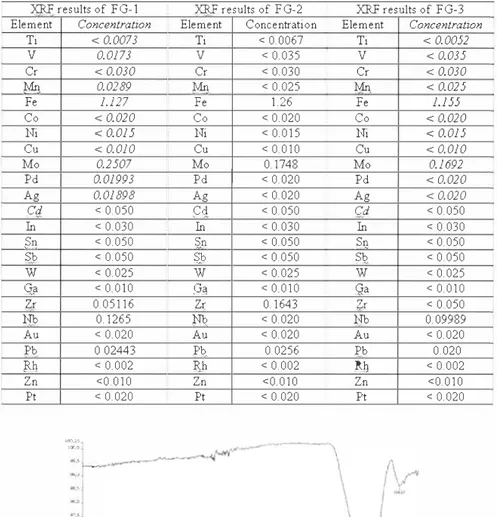
3.2.2.1 XRF result of flat glass
The chemical compositions of Flat Glass were examined with X-Ray fluorescence technique and it was observed that the glass has Fe ion in large amounts (see Table 7).
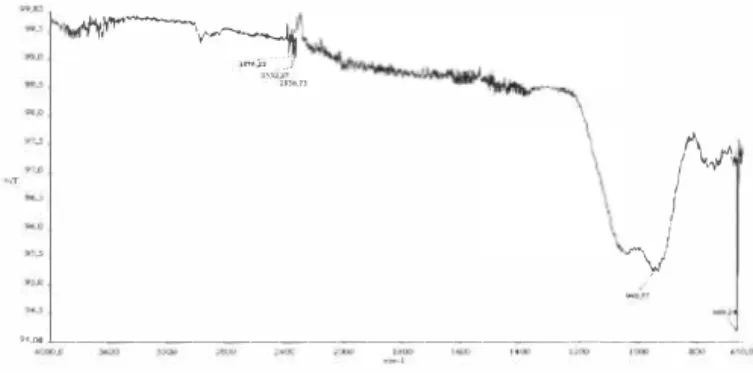
3.2.2.2 FT-IR results of flat glass
Kalmar ECO-TECH '07 KALMAR, SWEDEN, November 26-28, 2007
Table 7, XRF results of FG-1, FG-2 and FG-3 glasses,
XRF results of FG-1 XRF results of FG-2 XRF results of FG-3
Element Concentration Element Concentration Element Concentration
Ti < 0.0073 Ti < 0.0067 Ti < 0.0052 V 0.0173 V < 0.035 V < 0.035 Cr < 0.030 Cr < 0.030 Cr < 0.030
�
0.0289Mn
< 0.025Mn.
< 0.025 Fe 1.127 Fe 1.26 Fe 1.155 Co < 0.020 Co < 0.020 Co < 0.020 Ni <0.015 Ni < 0.015 Ni < 0.015 Cu < 0.010 Cu < 0 010 Cu < 0.010 Mo 0.2507 Mo 0.1748 Mo 0.1692 Pd 0.01993 Pd < 0.020 Pd < 0.020 Ag 0.01898 Ag < 0.020 Ag < 0.020 Cs£ < 0.050S::i
< 0 050 Cd < 0.050 In < 0.030 In < 0.030 In < 0.030 $!). < 0.050 $,n < 0.050 S1, < 0.050 Sb < 0.050 $);:, < 0.050?9,
< 0 050w
< 0.025w
< 0.025w
< 0.025 Q,ti. < 0 0109�
< 0 010 Qa < 0.010 Zr 0.05116 Zr 0 1643 Zr < 0.050 Nb 0. 1265Nb
< 0.020 Nb 0 09989 Au < 0.020 Au < 0.020 Au < 0.020 Pb 0 02443 Pb. 0.0256 I:'.b 0.020fg
< 0.002fill
< 0.002Rh
< 0.002 Zn <0.010 Zn <0.010 Zn <0.010 Pt < 0.020 Pt < 0.020 Pt < 0.020 100,.l� JCJ;,O �.oo �--- ---Figure 9. FT-IR spectrum of the FG-2 glass.
�r,-'-,
'{
,,,..._:i
:n•.llr�
,_.,
y
I
�•.oo�---Figure 10. FT-IR spectrum of the FG-3 glass.
4 CONCLUSIONS
The waste contains 89.42% SiO2, and this is a proof that the waste can be used in the glass industry. Two different samples and two types of glass were obtained by adding different kinds of additives. There were remarkable color differences in the samples. These differences were occurred by 2.12% of Fe2O3 which exists in the waste. The iron causes BG-I glass to be
light green-grey, BG-2 glass to be green-grey, BG-3 glass to be dark green-grey and also FG-1 glass sample to be dark green, FG-2 glass to be green, FG-3 glass to be light green. The melting was completed in Borosilicate glass at an average of I 350-l 325e° C, in Flat glass
sample at average 1282-1250e° C. The purpose of this study is the disposal of the treatment
sludge and the usage of the glasses for a decorative purpose; we can provide the disposal of glasses. In conclusion, 277,882 tons of sludge was generated as a waste sludge in Bergama Ovac1k Gold Mine every year. From this result, the finn will not have the disposal cost of the waste, which is used as raw material; it will fonn a new source of income. The vital point of the waste is not only just the specific section of the waste but also the whole waste was used as the raw material.
[5)
Kalmar ECO-TECH '07 KALMAR, SWEDEN, November 26-28, 2007
REFERENCES
[I) Silva, A . C ., Mello Castanho, S.R.H., 2004. Silicate glasses obtained from fine silica powder modified with galvanic waste addition. Journal of Non-Crystalline Solids 348, 211-217.
[2] Orhon, D . , 199 1 . On Antmanm Projelendirilmesi ve Endiistriyel At1klann On Antlimas1, Teknoloji iletimi Semineri vol.I, I SO-SKATM K., 131-173.
[3) Winkler, M., 2000. Waste Treatment and Disposal, John Wiley and Sons Ltd, England, 4 1 7,
[4) D i E, imalat Sanayi Atik Envanteri Anket Sonw;:lari, DiE Yayini, I 994.
Bernardo, E., Yarrasso, M ., Cadamuro, F., Hreglich, S., 2006. Vitrification of wastes and preparation of chemically stable sintered glass-ceramic products. Journal of Non Crystalline Solids 352, 4017-4023.
[6) Rubio, F., Rubio, J ., Oteo, J . L., I 998. A FT-IR Study of the Hydrolysis of Tetraethylorthosilicate (TEOS). Spectroscopy Letters 31, 199-219.
[7) Yang, P., Song, C .F., Lii, M . K., Yin, X., Zhou, G.J., Xu, D., Yuan, D .R., 2001. The luminescence of PbS nanoparticles embedded in sol-gel silica glass. Chemical Physics Letters 345, 429-434.