http://www.diva-portal.org
This is the published version of a paper published in Journal of Pain Research.
Citation for the original published paper (version of record):
Gerdle, B., Åkerblom, S., Brodda Jansen, G., Enthoven, P., Ernberg, M. et al. (2019) Who benefits from multimodal rehabilitation - an exploration of pain, psychological distress, and life impacts in over 35,000 chronic pain patients identified in the Swedish Quality Registry for Pain Rehabilitation
Journal of Pain Research, 12: 891-908
https://doi.org/10.2147/JPR.S190003
Access to the published version may require subscription. N.B. When citing this work, cite the original published paper.
Permanent link to this version:
Journal of Pain Research
Dove
press
O R I G I N A L R E S E A R C H
open access to scientific and medical research Open Access Full Text Article
Who benefits from multimodal rehabilitation –
an exploration of pain, psychological distress, and
life impacts in over 35,000 chronic pain patients
identified in the Swedish Quality Registry for
Pain Rehabilitation
Björn Gerdle1
Sophia Åkerblom2,3
Gunilla Brodda Jansen4
Paul Enthoven1 Malin Ernberg5,6 Huan-Ji Dong1 Britt-Marie Stålnacke7 Björn O Äng8–10 Katja Boersma11 1Pain and Rehabilitation Centre,
Department of Medical and Health Sciences, Linköping University, Linköping, Sweden; 2Department of Pain
Rehabilitation, Skåne University Hospital, Lund, Sweden; 3Department of Psychology,
Lund University, Lund, Sweden; 4Division
of Rehabilitation Medicine, Department of Clinical Sciences, Danderyd Hospital, Stockholm, Sweden; 5Department of Dental
Medicine, Karolinska Institutet, Huddinge, Sweden; 6Scandinavian Center for Orofacial
Neuroscience (SCON), Huddinge, Sweden; 7Department of Community
Medicine and Rehabilitation, Rehabilitation Medicine, Umeå University, Umeå, Sweden; 8Department of Neurobiology,
Care Sciences and Society, Division of Physiotherapy, Karolinska Institutet, Huddinge, Sweden; 9Center for Clinical
Research Dalarna – Uppsala University, Falun, Sweden; 10School of Education,
Health and Social Studies, Dalarna University, Falun, Sweden; 11School of
Law, Psychology and Social Work, Örebro University, Örebro, Sweden
Background: Chronic pain patients frequently suffer from psychological symptoms. There is
no consensus concerning the prevalence of severe anxiety and depressive symptoms and the strength of the associations between pain intensity and psychological distress. Although an important aspect of the clinical picture is understanding how the pain condition impacts life, little is known about the relative importance of pain and psychological symptoms for individual’s life impact. The aims of this study were to identify subgroups of pain patients; to analyze if pain, psychological distress, and life impact variables influence subgrouping; and to investigate how patients in the subgroups benefit from treatments.
Methods: Background variables, pain aspects (intensity/severity and spreading), psychological
distress (depressive and anxiety symptoms), and two life impact variables (pain interference and perceived life control) were obtained from the Swedish Quality Registry for Pain Rehabilitation for chronic pain patients and analyzed mainly using advanced multivariate methods.
Results: Based on >35,000 patients, 35%–40% had severe anxiety or depressive symptoms. Severe
psychological distress was associated with being born outside Europe (21%–24% vs 6%–8% in the category without psychological distress) and low education level (20.7%–20.8% vs 26%–27% in the category without psychological distress). Dose relationships existed between the two psy-chological distress variables and pain aspects, but the explained variances were generally low. Pain intensity/severity and the two psychological distress variables were significantly associated (R2=0.40–0.48; P>0.001) with the two life impact variables (pain interference and life control).
Two subgroups of patients were identified at baseline (subgroup 1: n=15,901–16,119; subgroup 2: n=20,690–20,981) and the subgroup with the worst situation regarding all variables participated less in an MMRP (51% vs 58%, P<0.001) but showed the largest improvements in outcomes.
Conclusion: The results emphasize the need to assess both pain and psychological distress
and not take for granted that pain involves high psychological stress in the individual case. Not all patients benefit from MMRP. A better matching between common clinical pictures and the content of MMRPs may help improve results. We only partly found support for treatment resistance in patients with psychological distress burden.
Keywords: anxiety, chronic pain, control, depression, life impact, sociodemographic
Introduction
Chronic pain conditions are closely related to interactions between neurobiological, psychological, and social factors.1 The International Association for the Study of Pain
definition of pain includes both sensory and emotional components. The prevalence of
Correspondence: Björn Gerdle Pain and Rehabilitation Centre, Department of Medical and Health Sciences, Linköping University, SE-581 85 Linköping, Sweden
Tel +46 763 927 191 Email bjorn.gerdle@liu.se
Journal name: Journal of Pain Research Article Designation: ORIGINAL RESEARCH Year: 2019
Volume: 12
Running head verso: Gerdle et al Running head recto: Gerdle et al
DOI: http://dx.doi.org/10.2147/JPR.S190003
Journal of Pain Research downloaded from https://www.dovepress.com/ by 130.243.46.239 on 26-Mar-2019
For personal use only.
This article was published in the following Dove Medical Press journal:
Dovepress
Gerdle et al
chronic nonmalignant pain is high: about 19% of the adult European population suffer from activity-limiting pain condi-tions,2 with a higher prevalence and more health care seeking
in women than in men.3,4 However, prevalence figures vary
depending on study design.5
Compared with the general population, individuals with chronic pain more frequently suffer from psychological symptoms/conditions, especially anxiety and low mood.6–9
There are different theories about the complex bidirectional relationship between pain and mood (ie, depressive and anxi-ety symptoms).10–16 The presence of depressive and
anxiety-related symptoms/disorders in people with chronic pain is associated with lower levels of functioning, poorer responses to treatment, and greater health costs.10,17–26 Furthermore,
spreading of pain, long pain duration, and high pain severity have been associated with worse course of depressive and anxiety disorders.
These associations make it important to determine how prevalent high levels of anxiety and depressive symptoms are in chronic pain patients. Prevalence estimates in chronic pain cohorts show varying figures, ranging from 2% to 80% in relation to depression and 1% to 65% in relation to anxiety.15,27–30 These prominent variations may be due to
methodological issues, the pain conditions examined, health care level provided (ie, primary care or specialized care), sample size investigated, and whether questionnaires focusing on symptoms or clinical assessments were used.15
A related question concerns the strength of the associa-tions between pain aspects such as intensity and severity of psychological distress. Relatively low correlations might indicate that reducing psychological symptoms will not reduce pain and vice versa. However, to some extent, changes in depressive and anxiety symptoms are correlated with changes in pain, but it has been shown that remission of depression and/or anxiety does not eliminate pain.31 MMRP
distinguishes itself as a well-coordinated intervention lead-ing to a complex intervention instead of a slead-ingle treatment and generally includes education, supervised physical activity, training in simulated environments, and cognitive behavioral therapy coordinated by an interdisciplinary team. The presence of disturbing psychological symptoms might indicate a need to consider the complex interaction of these aspects to further optimize present MMRP to include rel-evant psychological interventions. Investigating the strength of multivariate correlation pattern between pain aspects and symptoms of depression and/or anxiety may also shed light on which of these variables vary the most and contribute the
most to variations in the clinical picture and the outcome of rehabilitation efforts with respect to not only symptom reduction but also return to work rate. This knowledge is important for designing clinical assessments of chronic pain patients.
An important aspect of the clinical assessment is how the pain condition impacts life of the patient. The interference with daily life is one of the reasons for seeking health care.32
Pain interference – an important disease-specific measure of physical function33 – reflects how pain affects work, leisure,
and household activities as well as relationships with friends and family. A sense of control may represent the perceived ability to manage pain or pain-related matters,34 eg, the
per-ceived ability to control daily life and/or pain and the ability to address problems and handle stressful situations.35,36 The
ability to control pain seems important for choice of coping strategies.37 Perceived life control has been shown to correlate
relatively strongly both with pain and psychological distress in chronic pain patients, but these relationships have not been further explored.37 There is a lack of large studies of real-life
patients investigating if, to what extent, and how pain aspects and psychological symptoms determine reported levels of pain interference and life control.
In the context of improving outcomes of interven-tions, there is a great interest in identifying subgroups of chronic pain patients to investigate how these patients benefit from pain rehabilitation.38 Most studies have been
hypothesis driven with respect to the input variables used for the subgrouping. Although several studies have used psychological characteristics as input variables to identify the subgroups,39–44 few studies have used objective methods
to select input variables from a larger set of variables to identify clusters.
The above identified knowledge gaps motivated this study of chronic pain patients based on PROM data from SQRP.37
This study has the following aims:
1. To investigate the prevalence of severe depressive and anxiety symptoms and to analyze to what extent such symptoms intercorrelate with common pain characteris-tics and sociodemographic variables.
2. To explore how pain aspects and psychological distress symptoms intercorrelate with two life impact variables, ie, pain interference and life control.
3. To identify clusters of patients based on the exploration of baseline variables and to investigate which cluster benefits most from MMRP in the longitudinal perspective.
Journal of Pain Research downloaded from https://www.dovepress.com/ by 130.243.46.239 on 26-Mar-2019
Dovepress Gerdle et al
Subjects and methods
SQRP
The SQRP is recognized by the Swedish Association of Local Authorities and Regions. All relevant clinical departments within specialist care throughout Sweden deliver data to SQRP.37 The SQRP is based on questionnaires (ie, PROM
data) that capture patients’ background, pain aspects, and psychological distress symptoms (eg, depression and anxiety) together with activity/participation aspects and health-related quality of life variables. Patients complete the SQRP ques-tionnaires on up to three occasions: 1) during assessment at the first visit to the clinical department (baseline); 2) imme-diately after MMRPs for those patients who participate in MMRP; and 3) at a 12-month follow-up. In this study, cross-sectional analyses were made from patients who answered the SQRP at baseline. For the longitudinal analyses, the subgroup of patients who participated in MMRP was used (ie, also using the data registered immediately after MMRP and at the 12-month follow-up).
Patients
All chronic pain patients (>3 months) and patients >18 years of age (no upper age limit) were included in this study. These patients were referred to different specialist clinics associ-ated with SQRP between 2008 and 2016 from ~30 clinical departments throughout Sweden.
Variables
Sociodemographic variables, pain aspects, psychological distress variables, and life impact variables were selected from the SQRP and used in the analyses.
Sociodemographic variables
Sociodemographic variables were age (years), gender (man or woman), education level (dichotomized into university vs other alternatives and denoted as University), and country of birth (dichotomized into Europe vs outside Europe and denoted as Outside Europe).
Pain aspects
Average pain intensity the previous week was captured using an NRS. The endpoints of the NRS had verbal descriptions (ie, 0 =no pain and 10 =worst possible pain). This variable was denoted as NRS-7d.
Pain severity was registered using the Pain Severity sub-scale of the MPI (pain severity; 0 =no pain to 6 =very intense pain), which includes items concerning current pain intensity, pain intensity the previous 7 days, and suffering due to pain.35,36
The spatial extent of pain on the body was measured using 36 predefined anatomical areas (18 on the front and 18 on the back of the body). The patients marked the anatomical areas where they experienced pain: 1) head/face, 2) neck, 3) shoulder, 4) upper arm, 5) elbow, 6) forearm, 7) hand, 8) anterior aspect of chest, 9) lateral aspect of chest, 10) belly, 11) sexual organs, 12) upper back, 13) low back, 14) hip/ gluteal area, 15) thigh, 16) knee, 17) shank, and 18) foot. The sum of painful areas was calculated (possible range: 0 and 36). This sum was labeled as the PRI.
Psychological distress variables
The HADS, which measures symptoms of anxiety and depression, has good psychometric characteristics.45,46 The
validated Swedish translation of HADS was used and cho-sen to reflect aspects of psychological distress.45,47 HADS
comprises seven items in each of the depression and anxiety subscales (HAD-Depression and HAD-Anxiety). Both sub-scale scores range between 0 and 21. A score of 7 or less on each subscale indicates a noncase, a score of 8–10 indicates a possible case, and a score of 11 or more indicates a definite case.45 In this study, >11 was considered as severe anxiety
and depressive symptoms. Life impact variables
The pain interference subscale of MPI (pain interference; 0 =no interference to 6 =extreme interference) reflects interference of pain in everyday life (eg, work, housework, and leisure activities and time with family, relatives, and friends). The other MPI variable was the life control subscale (life control; 0 =poor control to 6 =good control), which is based on items concerning the ability to control daily life, address one’s own problems, control pain, and handle stress-ful situations.35,36
MMRPs
The SQRP does not provide detailed information about the MMRPs at the individual centers. Generally, the pro-grams – in agreement with international suggestions48 – are
delivered by a team of professionals (generally physician, psychologist, occupational therapist, physiotherapist, and social worker) and based on a biopsychosocial model of chronic pain. MMRPs are mainly outpatient group-based programs but with opportunities for individual interventions if necessary based on the clinical picture and the aims of the individual patient. Important components of the group-based part are cognitive behavioral treatment, physiotherapy including physical exercise, interventions targeting improved
Journal of Pain Research downloaded from https://www.dovepress.com/ by 130.243.46.239 on 26-Mar-2019
Dovepress
Gerdle et al
ergonomics, and occupational therapy. In addition, lectures on basic pain physiology and pain management are offered to patients and often to relatives, friends, and colleagues. The programs generally have a duration of several weeks (4–8 weeks) and with group-based activities 20–30 hours/ week. In addition, patients can have tasks to do at home including encouraging them to do physical exercise on their own. Recently published terminology for multicomponent treatment approaches identifies MMRP as an example of interdisciplinary treatment (https://www.iasp-pain.org/
PublicationsNews/NewsDetail.aspx?ItemNumber=6981).
Statistical analyses
All statistical analyses were performed using the statistical package IBM SPSS Statistics (version 23.0) and SIMCA-P+ (version 13.0; Umetrics Inc., Umeå, Sweden). A probability of <0.001 (two-tailed) was chosen as the criteria for signifi-cance due to the large number of subjects. Most texts and initial tables generally report the mean value ± 1 SD together with median and range of the investigated variables for the whole material. The subsequent analyses reported mean ± 1 SD in text and tables. SQRP uses predetermined rules when handling single missing items of a scale or a subscale; details have been reported elsewhere.49
ANOVA (including Bonferroni post hoc tests) was used for group comparisons, Student’s t-test for paired observations, and chi-squared test for differences in distribution. Pearson’s test was used for bivariate correlation analysis, and this test produced the correlation coefficient r and explained varia-tion r2 (in %). Effect sizes (Cohen’s d) were computed for
between- and within-group situations using a web-based calcu-lator (https://memory.psych.mun.ca/models/stats/effect_size. shtml). The absolute effect size (| d |) was considered very large for ≥1.3, large for 0.80–1.29, moderate for 0.50–0.79, small for 0.20–0.49, and insignificant for <0.20.50 We used advanced
multivariate analyses; advanced PCA was used for the mul-tivariate correlation analyses of all investigated variables and OPLS for the multivariate regressions using SIMCA-P+. These techniques do not require normal distributions.51
PCA was used to investigate the correlation patterns for the investigated variables. A cross-validation technique was used to identify nontrivial components (p). Variables loading on the same component p are correlated, and variables with high loadings but with opposing signs are negatively corre-lated. Variables with high absolute loadings – ie, 95% jack-knife uncertainty confidence interval nonequal to zero – were considered significant. Note that the loadings obtained from SIMCA-P+ are lower and not comparable with those from, eg,
SPSS. SIMCA-P+, in contrast to traditional statistical pack-ages such as SPSS, uses the Non-linear Iterative Partial Least Squares algorithm when compensating for missing data: for variables/scales, maximum 50% missing data and for subjects, maximum 50% missing data. The obtained components are per definition not correlated and are arranged in decreasing order with respect to explained variation. R2 describes the
goodness of fit – the fraction of sum of squares of all the vari-ables explained by a principal component p.52 Q2 describes the
goodness of prediction – the fraction of the total variation of the variables that can be predicted by a principal component using cross-validation methods.52 Outliers were identified using
two methods: 1) score plots in combination with Hotelling’s T2 and 2) distance to model in X-space. No extreme outliers
were detected. PCA was used to identify the most important variables, and the most important variables were used as input variables in a two-step cluster analysis to identify clusters (log-likelihood measure distance, number of clusters determined automatically, and Schwartz’s Bayesian cluster criterion as options). To obtain reasonably large clusters, we required that the ratio between clusters sizes be <3.0, per the convention for this analysis. ANCOVA was used to manage regression toward the mean bias for the changes in outcome variables after MMRP using baseline values as covariates53 and with
the requirement that no interaction exists between independent variable (cluster membership) and the covariate.
OPLS was used for the multivariate regression analyses of pain interference and life control.52 The VIP indicates the
relevance of each X-variable pooled over all dimensions and Y-variables, the group of variables that best explains Y. VIP ≥1.0 was considered significant if VIP had 95% jackknife uncertainty confidence interval nonequal to zero. p(corr) was used to note the direction of the relationship (positive or negative). This is the loading of each variable scaled as a correlation coefficient and thus standardizing the range from –1 to +1.51 p(corr) is comparable between models. An
absolute p(corr) ≥0.5 is considered significant.51 For each
regression, R2, Q2, and the result (ie, P-value) of a
cross-validated analysis of variance (CV-ANOVA) are reported.
Results
Investigated variables
At the time of this investigation, the SQRP consisted of 39,916 chronic pain patients >18 years of age (72.0% women). Of these, 14.1% were born outside Europe. Approximately one-fourth (23.9%) of the patients had a university education. This percentage is significantly lower compared with the population proportion of 36.3% (χ2=2,639.103, df=1, P<0.001) ( Statistics
Journal of Pain Research downloaded from https://www.dovepress.com/ by 130.243.46.239 on 26-Mar-2019
Dovepress Gerdle et al
Sweden, 2018; https://www.scb.se/en/). The investigated continuous variables are displayed in Table 1. Previously, we reported that women had significant worse situations with respect to NRS-7d, pain severity, and PRI and men scored significantly higher on HAD-Depression.54
Prevalence of severe levels of anxiety
and depression symptoms according to
HADS
The prevalence of severe anxiety symptoms (>11) according to HAD-Anxiety was 39.5%. The corresponding figure for
Table 1 Age, pain variables, psychological distress variables, and
life impact aspects; mean, SD, median, and range together with number of subjects (n) at baseline
Mean SD Median Range n
Age (years) 43.3 11.3 44.0 84 39,916 Pain variables NRS-7d 7.0 1.8 7.0 10 38,404 Pain severity 4.5 1.0 4.7 6 38,643 PRI 13.9 8.9 13.0 36 39,916 Psychological distress HAD-Anxiety 9.2 5.0 9.0 21 38,919 HAD-Depression 8.7 4.7 9.0 21 38,936 Life impact Pain interference 4.4 1.1 4.5 6 38,263 Life control 2.7 1.2 2.8 6 38,478
Abbreviations: HAD-Anxiety, Anxiety subscale of Hospital Anxiety and
Depression Scale; HAD-Depression, Depression subscale of Hospital Anxiety and Depression Scale; life control, MPI subscaleconcerning perceived life control; MPI, Multidimensional Pain Inventory; NRS-7d, average pain intensity the last week according to a numeric rating scale; Pain interference, MPI subscale concerning pain-related interference in everyday life; Pain severity, MPI subscale concerning pain severity; PRI, Pain Region Index.
HAD-Depression was 35.2%, and 24.8% had high values (>11) on both HAD-Anxiety and HAD-Depression. The proportion of patients with less severe psychological distress according to these two variables (ie, <11) was 50.3%.
The continuous variables stratified for HAD-Anxiety and HAD-Depression are shown in Tables 2 and 3. The three cat-egories of the two subscales of HADS were generally associ-ated with significant differences in the investigassoci-ated variables. Hence, the category with most severe depressive and anxiety symptoms had the worst situation with respect to pain and life impact. Relatively more men than women had severe depres-sive symptoms (>11 for HAD-Depression) (men: 37.9% vs women: 34.1%; χ2=54.6, P<0.001), but no gender differences
were found for severe anxiety symptoms (HAD-Anxiety) (men: 39.3% vs women: 39.5%; χ2=0.104, P=0.950).
The proportion of patients born outside Europe differed significantly between the HAD-Anxiety categories (0–7: 5.5%, 8–10: 10.3%, and 11–21: 24.1%; χ2=2,311.2, df=2,
P<0.001) and the HAD-Depression categories (0–7: 7.8%, 8–10: 13.9%, and 11–21: 21.0%; χ2=1,086.9, df=2, P<0.001).
Hence, patients born outside Europe were disproportionally represented in the more severe categories of anxiety and depressive symptoms.
The proportion with university education also differed across the three HAD-Anxiety categories (0–7: 27.0%, 8–10: 24.4%, and 11–21: 20.8%; χ2=160.2, df=2, P<0.001) and
the HAD-Depression categories (0–7: 26.4%, 8–10: 24.6%, and 11–21: 20.7%; χ2=133.6, df=2, P<0.001). Hence, the
categories with severe psychological distress had the lowest proportion with university education.
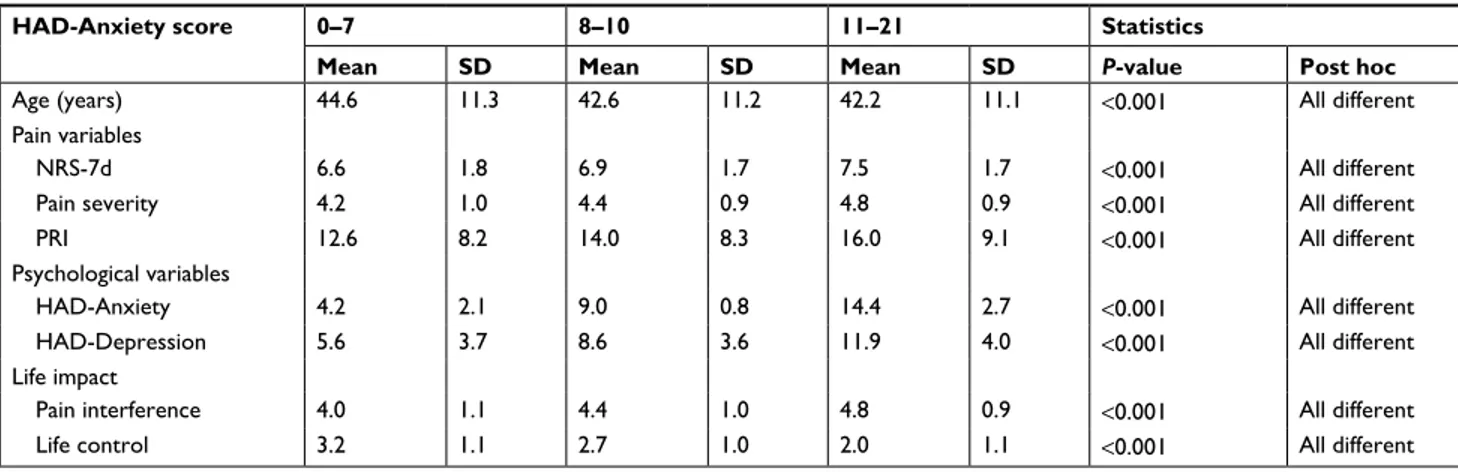
Table 2 Investigated continuous variables (mean and SD) stratified for the three categories of HAD-Anxiety
HAD-Anxiety score 0–7 8–10 11–21 Statistics
Mean SD Mean SD Mean SD P-value Post hoc
Age (years) 44.6 11.3 42.6 11.2 42.2 11.1 <0.001 All different
Pain variables
NRS-7d 6.6 1.8 6.9 1.7 7.5 1.7 <0.001 All different
Pain severity 4.2 1.0 4.4 0.9 4.8 0.9 <0.001 All different
PRI 12.6 8.2 14.0 8.3 16.0 9.1 <0.001 All different
Psychological variables
HAD-Anxiety 4.2 2.1 9.0 0.8 14.4 2.7 <0.001 All different
HAD-Depression 5.6 3.7 8.6 3.6 11.9 4.0 <0.001 All different
Life impact
Pain interference 4.0 1.1 4.4 1.0 4.8 0.9 <0.001 All different
Life control 3.2 1.1 2.7 1.0 2.0 1.1 <0.001 All different
Note: Furthest to the right is the result of ANOVA (P-value) and post hoc tests.
Abbreviations: HAD-Anxiety, Anxiety subscale of Hospital Anxiety and Depression Scale; HAD-Depression, Depression subscale of Hospital Anxiety and Depression
Scale; Life control, MPI subscaleconcerning perceived life control; MPI, Multidimensional Pain Inventory; NRS-7d, average pain intensity the last week according to a numeric rating scale; Pain interference, MPI subscale concerning pain-related interference in everyday life; Pain severity, MPI subscale concerning pain severity; PRI, Pain Region Index.
Journal of Pain Research downloaded from https://www.dovepress.com/ by 130.243.46.239 on 26-Mar-2019
Dovepress
Gerdle et al
Intercorrelations
Bivariate intercorrelations
Highly significant bivariate intercorrelations according to Pearson’s test exist between the pain variables and the psychological distress variables (Table 4). As expected, the bivariate correlations showed high intercorrelations between the two psychological distress variables (r=0.67) and between NRS-7d and pain severity (r=0.75) (Table 4). However, the explained variances between pain intensity/severity variables (NRS-7d and pain severity) and the psychological variables (HAD-Anxiety and HAD-Depression) were low since r2
var-ied between 3% and 11%. The corresponding figures for the explained variations between pain variables and psychologi-cal distress variables vs pain interference were 5%–35% and 4%–32% for life control. Age did not correlate significantly with several of the other variables or had very low r2.
Table 3 Investigated continuous variables (mean and SD) stratified for the three categories of HAD-Depression
HAD-Depression 0–7 8–10 11–21 Statistics
Mean SD Mean SD Mean SD P-value Post hoc
Age (years) 43.2 11.9 43.1 11.1 43.5 10.6 0.015 0–7 NE 11–21, 8–10 NE 11–21
Pain variables
NRS-7d 6.6 1.8 7.0 1.7 7.6 1.6 <0.001 All different
Pain severity 4.2 1.0 4.5 0.9 4.8 0.9 <0.001 All different
PRI 12.8 8.3 14.4 8.5 15.9 9.0 <0.001 All different
Psychological variables
HAD-Anxiety 6.0 3.8 9.6 3.9 12.9 4.3 <0.001 All different
HAD-Depression 4.2 2.1 9.0 0.8 13.9 2.5 <0.001 All different
Life impact
Pain interference 3.9 1.1 4.5 0.9 5.0 0.8 <0.001 All different
Life control 3.3 1.0 2.6 1.0 1.9 1.0 <0.001 All different
Note: Furthest to the right is the result of ANOVA (P-value) and post hoc tests.
Abbreviations: HAD-Anxiety, Anxiety subscale of Hospital Anxiety and Depression Scale; HAD-Depression, Depression subscale of Hospital Anxiety and Depression
Scale; Life control, MPI subscale concerning perceived life control; MPI, Multidimensional Pain Inventory; NE, not equal; NRS-7d, average pain intensity the last week according to a numeric rating scale; Pain interference, MPI subscale concerning pain-related interference in everyday life; Pain severity, MPI subscale concerning pain severity; PRI, Pain Region Index.
Table 4 Bivariate correlations (Pearson’s correlation coefficients r) for the investigated continuous variables
Variables Age NRS-7d Pain severity PRI HAD-Anxiety HAD-Depression Pain interference Life control Age 1 0.031* –0.003 –0.001 –0.097* 0.017* 0.012 0.060* NRS-7d 1 0.753* 0.234* 0.257* 0.266* 0.439* –0.352* Pain severity 1 0.254* 0.306* 0.326* 0.588* –0.421* PRI 1 0.201* 0.182* 0.224* –0.203* HAD-Anxiety 1 0.666* 0.372* –0.514* HAD-Depression 1 0.537* –0.562* Pain interference 1 –0.470* Life control 1 Note: *P<0.001.
Abbreviations: HAD-Anxiety, Anxiety subscale of Hospital Anxiety and Depression Scale; HAD-Depression, Depression subscale of Hospital Anxiety and Depression
Scale; Life control, MPI subscale concerning perceived life control; MPI, Multidimensional Pain Inventory; NRS-7d, average pain intensity the last week according to a numeric rating scale; Pain interference, MPI subscale concerning pain-related interference in everyday life; Pain severity, MPI subscale concerning pain severity; PRI, Pain Region Index.
Multivariate correlation patterns
The multivariate correlation pattern between the variables was investigated using PCA. Variables located near each other (eg, HAD-Depression vs HAD-Anxiety) are more strongly correlated than more distant variables (eg, HAD-Depression vs Pain severity) even though they may show relatively high loadings on p1. The obtained significant model consisted of one significant component (R2=0.32, Q2=0.19, n=38,934).
Figure 1 shows the loading plot, ie, the relationship between the investigated variables.
The variables with the strongest absolute loadings on the first component (p1) showed the largest variation across subjects and were significantly correlated in the multivariate context. Pain severity, pain interference, HAD-Depression, life control, HAD-Anxiety, and NRS-7d had the highest absolute loadings and were thus intercorrelated (Figure 1).
Journal of Pain Research downloaded from https://www.dovepress.com/ by 130.243.46.239 on 26-Mar-2019
Dovepress Gerdle et al
Figure 1 Loading plot from the PCA of background variables, pain variables, psychological distress variables, and two life impact variables. To facilitate the graphic
interpretation, a second nonsignificant component was calculated (ie, variations along the Y-axis are not significant). Hence, two components (p1 [horizontal] and p2 [vertical]) are shown.
Abbreviations: HAD-Anxiety, Anxiety subscale of Hospital Anxiety and Depression Scale; HAD-Depression, Depression subscale of Hospital Anxiety and Depression Scale;
life control, MPI subscale concerning perceived life control; MPI, Multidimensional Pain Inventory; MPI-Pain interference, MPI subscale concerning pain-related interference in everyday life; NRS-7d, average pain intensity the last week according to a numeric rating scale; Outside Europe, born outside Europe; pain severity, MPI subscale concerning pain severity; PCA, principal component analysis; PRI, Pain Region Index; University, University education.
HAD-Depression HAD-Anxiety Outside Europe Pain interference Pain severity NRS-7d PRI Gender Life control Age University p1 –0.5 –0.6 –0.5 –0.4 –0.3 –0.2 –0.1 0 0.1 0.2 0.3 –0.4 –0.3 –0.2 –0.1 0 0.1 0.2 0.3 0.4 p2
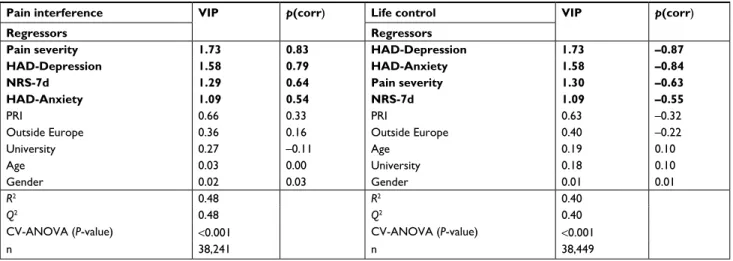
in this multivariate context. Hence, pain interference was determined both by pain and psychological variables. Posi-tive correlations existed between these significant variables and pain interference.
The two psychological distress variables HAD-Depres-sion and HAD-Anxiety followed by pain severity and NRS-7d showed the strongest and significant associations with life control (Table 5, right part). The significant OPLS regres-sion of life control consisted of one predictive component. Spreading of pain (PRI) and sociodemographic variables had no significant importance. Hence, life control was strongly correlated with two psychological variables even though pain intensity variables also contributed significantly (Supplemen-tary S1). As expected, negative correlations existed between these significant variables and life control.
The regressions displayed in Table 5 were recalculated with the two psychological distress variables dichotomized (severe symptoms vs less severe symptoms; cutoff >11) and very similar results were obtained (Supplementary S2). Life control had a negative correlation in relation to the other
important variables. Because age, gender, and university education had low importance (ie, they were located near zero according to p1), they were not significantly correlated with the other variables in the multivariate context.
Regression of life impact variables: pain
interference and life control
Pain interference and life control were regressed using the sociodemographic variables, pain variables, and psycho-logical distress variables as regressors. For both regressions, highly significant models were obtained (Table 5).
A mix of pain and psychological distress variables (ie, pain severity, NRS-7d, Depression, and HAD-Anxiety) was significantly associated with pain interfer-ence (one predictive component) (Table 5, left part). Pain severity was the variable with the strongest association with pain interference. PRI (ie, spreading of pain) and sociodemographic variables had no significant importance
Journal of Pain Research downloaded from https://www.dovepress.com/ by 130.243.46.239 on 26-Mar-2019
Dovepress
Gerdle et al
Identifying subgroups based on the most
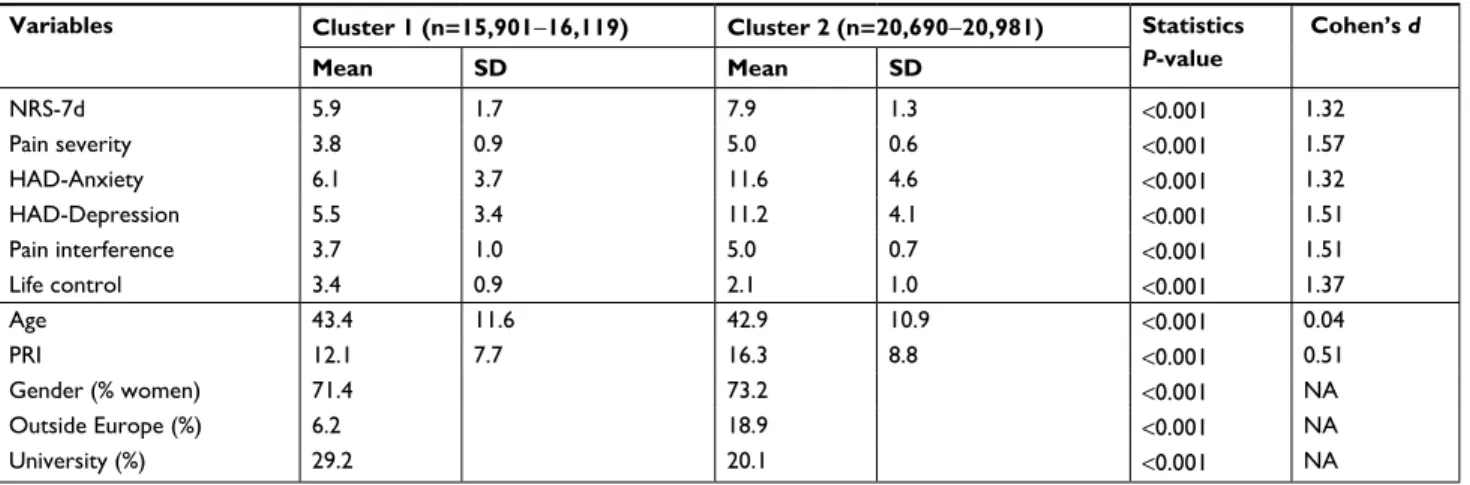
important variables from the PCA
NRS-7d, pain severity, HAD-Anxiety, HAD-Depression, pain interference, and life control were the most important variables at baseline and showed the greatest variability across patients according to the first component p1 of the PCA (Figure 1). These variables were then used as input variables in a two-step cluster analysis, which identified two clusters. As intended, all input variables differed significantly between the two clusters (Table 6); very large effect sizes were noted. Cluster 2, which was somewhat larger than clus-ter 1, reflected a significantly worse situation according to all input variables. In addition, according to HADS (cutoff >11), 59.4% of patients in cluster 2 and 12.8% of patients in cluster 1 had severe symptoms of anxiety (χ2=8,287.9,
df=1, P<0.001); corresponding figures for HAD-Depression (with the cutoff ≥11) were 56.1% and 9.6% (χ2=9,409.9,
df=1, P<0.001).
The two clusters were then compared for the variables not included as input variables in the cluster analysis. Spreading of pain on the body (PRI) was more pronounced in cluster 2 (Table 6), which had a somewhat significantly higher proportion of women. A nearly three times higher prevalence of patients born outside Europe and a lower proportion with university education were also evident in cluster 2 (Table 6).
Table 5 OPLS regressions of pain interference (left part) and life control (right part)
Pain interference VIP p(corr) Life control VIP p(corr)
Regressors Regressors
Pain severity 1.73 0.83 HAD-Depression 1.73 –0.87
HAD-Depression 1.58 0.79 HAD-Anxiety 1.58 –0.84
NRS-7d 1.29 0.64 Pain severity 1.30 –0.63
HAD-Anxiety 1.09 0.54 NRS-7d 1.09 –0.55
PRI 0.66 0.33 PRI 0.63 –0.32
Outside Europe 0.36 0.16 Outside Europe 0.40 –0.22
University 0.27 –0.11 Age 0.19 0.10
Age 0.03 0.00 University 0.18 0.10
Gender 0.02 0.03 Gender 0.01 0.01
R2 0.48 R2 0.40
Q2 0.48 Q2 0.40
CV-ANOVA (P-value) <0.001 CV-ANOVA (P-value) <0.001
n 38,241 n 38,449
Notes: VIP (VIP >1.0 is significant) and p(corr) are reported for each regressor, ie, the loading of each variable scaled as a correlation coefficient and thus standardizing
the range from –1 to +1. The sign of p(corr) indicates the direction of the correlation with the dependent variable (+, positive correlation; –, negative correlation). The four bottom rows of each regression report R2, Q2, P-value of the CV-ANOVA, and number of patients included in the regression (n). Variables in bold type are significant
regressors (VIP >1.0).
Abbreviations: CV-ANOVA, cross-validated analysis of variance; HAD-Anxiety, Anxiety subscale of Hospital Anxiety and Depression Scale; HAD-Depression, Depression
subscale of Hospital Anxiety and Depression Scale; Life control, MPI subscale concerning perceived life control; MPI, Multidimensional Pain Inventory; NRS-7d, average pain intensity the last week according to a numeric rating scale; Pain interference, MPI subscale concerning pain-related interference in everyday life; Pain severity, MPI subscale concerning pain severity; PRI, Pain Region Index; Outside Europe, born outside Europe; University, University education; OPLS, orthogonal partial least square regressions; VIP, Variable Importance in Projection.
Outcomes of MMRP in the two clusters
More cluster 1 patients participated in MMRP than cluster 2 patients (57.5% vs 51.0%, χ2=144.5, df=2, P<0.001).Significant differences existed for all variables post-MMRP (all P<0.001) when comparing the two clusters; a similar pat-tern was also found at the 12-month follow-up (all P<0.001) (Table 7). Marked and significant differences also existed for the dichotomized psychological distress (cutoff >11) between the two clusters at post-MMRP (severe anxiety symptoms: cluster 1 =11.2% and cluster 2 =39.8%, χ2=1,960.1, df=2,
P<0.001; severe depressive symptoms: cluster 1 =6.2% and cluster 2 =29.7%, χ2=1,959.5, df=2, P<0.001) and at the
12-month follow-up (severe anxiety symptoms: cluster 1 =10.5% and cluster 2 =37.8%, χ2=1,156.5, df=2, P<0.001;
severe depressive symptoms: cluster 1 =8.1% and cluster 2 =32.9%; χ2=1,114.8, df=2, P<0.001).
In both clusters, significant improvements were found in the six investigated variables both between baseline and post-MMRP and between baseline and the 12-month follow-up (Table 7). When comparing the absolute changes between the two clusters post-MMRP and at the 12-month follow-up, cluster 2 consistently showed the greatest improvements (all P<0.001) (Table 7). To handle possible regression toward the mean biases, we also checked these changes with ANCOVA using the baseline value as a covariate; the cluster differences remained clearly significant (P<0.001) for the changes related
Journal of Pain Research downloaded from https://www.dovepress.com/ by 130.243.46.239 on 26-Mar-2019
Dovepress Gerdle et al
Table 6 Results of the two-step cluster analysis using NRS-7d, pain severity, HAD-Anxiety, HAD-Depression, pain interference, and
life control as input variables (above the horizontal line)
Variables Cluster 1 (n=15,901−16,119) Cluster 2 (n=20,690−20,981) Statistics
P-value Cohen’s d Mean SD Mean SD NRS-7d 5.9 1.7 7.9 1.3 <0.001 1.32 Pain severity 3.8 0.9 5.0 0.6 <0.001 1.57 HAD-Anxiety 6.1 3.7 11.6 4.6 <0.001 1.32 HAD-Depression 5.5 3.4 11.2 4.1 <0.001 1.51 Pain interference 3.7 1.0 5.0 0.7 <0.001 1.51 Life control 3.4 0.9 2.1 1.0 <0.001 1.37 Age 43.4 11.6 42.9 10.9 <0.001 0.04 PRI 12.1 7.7 16.3 8.8 <0.001 0.51 Gender (% women) 71.4 73.2 <0.001 NA Outside Europe (%) 6.2 18.9 <0.001 NA University (%) 29.2 20.1 <0.001 NA
Notes: Continuous variables are shown as mean and SD, while the category variables are shown as proportions (%). The two clusters were also compared with respect to
PRI and sociodemographic variables. Furthest to the right is given effect sizes (Cohen’s d).
Abbreviations: HAD-Anxiety, Anxiety subscale of Hospital Anxiety and Depression Scale; HAD-Depression, Depression subscale of Hospital Anxiety and Depression
Scale; Life control, MPI subscale concerning perceived life control; MPI, Multidimensional Pain Inventory; NA, not applicable; NRS-7d, average pain intensity the last week according to a numeric rating scale; Pain interference, MPI subscale concerning pain-related interference in everyday life; Pain severity, MPI subscale concerning pain severity; PRI, Pain Region Index; Outside Europe, born outside Europe; University, University education.
Table 7 Within and between comparisons in the two clusters for BL vs immediately after MMRP (post) (upper part) and for BL vs
12-month FU (lower part)
Cluster 1 n=6,596–6,610 Cluster 2 n=7,473–7,514 BL Post Within cluster P-value Cohen’s d BL Post Within cluster P-value Cohen’s d Changes between clusters P-value
Mean SD Mean SD Mean SD Mean SD
NRS-7d 5.9 1.7 5.2 2.1 <0.001 0.33 7.7 1.2 6.6 1.9 <0.001 0.60 <0.001 Pain severity 3.8 0.8 3.4 1.1 <0.001 0.42 4.9 0.6 4.3 1.0 <0.001 0.68 <0.001 HAD-Anxiety 6.3 3.6 5.8 3.7 <0.001 0.15 11.3 4.3 9.5 4.5 <0.001 0.44 <0.001 HAD-Depression 5.8 3.3 4.8 3.4 <0.001 0.31 10.9 3.8 8.3 4.3 <0.001 0.64 <0.001 Pain interference 3.7 1.0 3.4 1.1 <0.001 0.32 5.0 0.6 4.4 1.0 <0.001 0.74 <0.001 Life control 3.4 0.9 3.7 1.1 <0.001 –0.26 2.2 1.0 3.0 1.2 <0.001 –0.62 <0.001 Cluster 1 n=4,214–4,232 Cluster 2 n=4,349–4,375 BL FU Within cluster P-value Cohen’s d BL FU Within cluster P-value Cohen’s d Changes between clusters P-value
Mean SD Mean SD Mean SD Mean SD
NRS-7d 5.9 1.6 5.0 2.3 <0.001 0.40 7.7 1.3 6.5 2.1 <0.001 0.59 <0.001 Pain severity 3.8 0.8 3.2 1.3 <0.001 0.52 4.9 0.6 4.2 1.2 <0.001 0.68 <0.001 HAD-Anxiety 6.2 3.5 5.5 3.8 <0.001 0.20 11.2 4.3 9.2 4.8 <0.001 0.45 <0.001 HAD-Depression 5.6 3.2 4.9 3.7 <0.001 0.20 10.7 3.8 8.6 4.7 <0.001 0.49 <0.001 Pain interference 3.7 0.9 3.2 1.3 <0.001 0.44 5.0 0.6 4.3 1.2 <0.001 0.71 <0.001 Life control 3.4 0.9 3.7 1.1 <0.001 –0.26 2.2 1.0 2.9 1.3 <0.001 –0.51 <0.001
Notes: Both within-cluster changes (P-value) and between-cluster changes (P-value) are shown. For the within comparisons are also reported Cohen’s d. Life control, MPI
subscale concerning perceived life control; pain interference, MPI subscale concerning pain-related interference in everyday life; pain severity, MPI subscale concerning pain severity.
Abbreviations: HAD-Anxiety, Anxiety subscale of Hospital Anxiety and Depression Scale; HAD-Depression, Depression subscale of Hospital Anxiety and Depression
Scale; MPI, Multidimensional Pain Inventory; NRS-7d, average pain intensity the last week according to a numeric rating scale; PRI, Pain Region Index; MMRP, multimodal/ multidisciplinary rehabilitation program; BL, baseline; FU, follow-up.
Journal of Pain Research downloaded from https://www.dovepress.com/ by 130.243.46.239 on 26-Mar-2019
Dovepress
Gerdle et al
to both time points for NRS-7d, pain severity, pain interference, and life control. The assumption of no interaction between independent variable and covariate was violated for HAD-Anxiety and HAD-Depression. The effect sizes for the within clusters showed consistently higher absolute and generally moderate effect sizes in cluster 2 (except for HAD-Anxiety for both comparisons and HAD-Depression for one comparison), whereas there were generally small effect sizes in cluster 1 (except for pain severity: baseline vs the 12-month follow-up).
Discussion
The following are the major results in this study of patients in real-world practice settings from SQRP:
1. Thirty-five percent to 40% of patients had severe anxiety or depressive symptoms with an overrepresentation in patients born outside Europe, low education level, and male gender (only depressive symptoms).
2. Dose relationships existed between the two psychological distress variables and pain aspects (intensity, severity, and spreading) and life impact variables.
3. Pain intensity/severity and psychological distress vari-ables were significantly associated with the two life impact variables at baseline.
4. Two clusters of patients were identified at baseline. A lower percentage of patients in the cluster with worse clinical situation participated in MMRP but showed larger positive changes in outcomes. This cluster also had an overrepresentation of patients born outside Europe and patients with lower education level.
Prevalence of severe depressive and
anxiety symptoms and relations to
background variables
A recent meta-analysis concluded that chronic pain was more strongly associated with anxiety than depression,55 a finding
that agrees with our finding of a somewhat higher prevalence of severe anxiety symptoms than severe depressive symptoms (39.5% vs 35.2%). In contrast to the meta-analysis, we found that depressive symptoms were more strongly correlated with pain intensity/severity and life impacts than anxiety symptoms (Tables 4 and 5).
A substantial part of the present chronic pain patients referred to specialist clinics perceived considerable psy-chological distress and one-fourth of the patients report severe psychological distress according to both facets of HADS. Our nationwide results agree with an SQRP study of chronic pain patients (n=4,665) referred to a university hospital where 40% reported severe anxiety and/or depressive
symptoms according to HADS.37 In chronic low back pain
patients who were on sick leave, 18% were possible cases of depression (cutoff >8) and 21% were possible cases of anxiety (cutoff >8) according to HADS.30 Lower figures may
have been due to selection mechanisms since these patients were recruited to take part in a randomized controlled study, whereas patients in this study represented a clinical popula-tion at the specialist level. As menpopula-tioned in the introducpopula-tion, prevalence estimates of anxiety and depressive comorbidities/ symptoms in chronic pain cohorts vary considerably,15,28,29,45
a situation that partly reflects methodological issues. It has been stated that the highest prevalence of depression is found among patients attending specialist pain departments.10,56 No
systematic clinical assessment of anxiety and/or depressive conditions is available in SQRP, but at the higher end of the recommended cutoffs (ie, >11) the specificity for identifying cases of depression or anxiety disorders are good for both HAD-Depression and HAD-Anxiety.46 Although most of the
patients did not report severe levels of psychological distress using the cutoff >11 for either or both scales, these patients may still suffer from psychological distress to some extent, which contribute to negative life impacts (Table 5).
Dose relationships and strength of
correlations between pain aspects and
psychological distress
A dose relationship existed between pain aspects (inten-sity, severity, and spreading) and anxiety and depressive symptoms and vice versa (Tables 2–3). In addition, the two life impact variables showed dose relationships vs the two psychological distress variables. However, the bivariate correlation coefficients were low between, eg, pain inten-sity/severity and the two psychological distress variables (r=0.26–0.33) (Table 4). Similar results have been reported elsewhere.37,57 The multivariate correlation analysis (PCA;
Figure 1) confirmed the bivariate correlation pattern found in Table 4. One clinical consequence of the low correlations is that high pain intensity reported by a patient at the clinical assessment will not necessarily mean severe psychological distress even though this is the case at the group level.
The different categories of Anxiety and HAD-Depression showed disproportional distributions of the sociodemographic variables. Low education level and being born outside Europe were somewhat, although significantly, overrepresented in the patient group reporting the most severe depressive and anxiety symptoms. Moreover, male gender was overrepresented in the most severe group of depressive symp-toms. In a Danish register linkage study of patients attending a pain specialist clinic, men had higher prevalence of depression
Journal of Pain Research downloaded from https://www.dovepress.com/ by 130.243.46.239 on 26-Mar-2019
Dovepress Gerdle et al
and anxiety disorders.58 In the SQRP, women were obviously
overrepresented at the specialist level, a finding also reported in the Danish study.58 The higher proportion of women could
be due to factors such as women, compared with men, had a higher prevalence of chronic pain,59,60 different severity (eg,
with respect to spreading of pain), and different societal selec-tion mechanisms for treatment and rehabilitaselec-tion.
The literature provides many explanations for the complex bidirectional associations between chronic pain and anxiety and depressive symptoms. Taken together, these explana-tions point toward shared (transdiagnostic) mechanisms. On a biological level, there is evidence of similar activated and modulated brain regions including neuroplasticity altera-tions,61–63 reduced levels of norepinephrine and serotonin,64
neuroinflammation, hyperactivity of hypothalamic–pituitary– adrenal axis, and autonomic dysregulation,31,65 dysregulation
in the endocannabinoid system,66,67 sleeping disturbances,
and genetics.16,68,69 On a psychological and social level, there
is accumulating evidence for mutually shared vulnerability and maintaining factors (including similar consequences, ie, social isolation and reduced physical activity).16,70 Emotion
regulation may be seen as a transdiagnostic process tying pain and depression/emotion.71,72 In this view,
catastroph-izing, behavioral avoidance, and thought suppression are seen as adaptive psychological efforts to regain emotional homeostasis in the face of aversive experiences such as pain and low mood or anxiety. Depression and severe anxiety as well as chronic pain may be a consequence of failed efforts to regulate these negative experiences.
Regressors of life impact variables
A blend of pain intensity/severity and psychological distress variables was important for the cross-sectional regressions of the impact of life. The two negatively correlated life impact variables life control and pain interference37,73 had the same
significant regressors at baseline (Table 5) even though their relative importance differed somewhat between the two life impact variables. In addition, Turk et al reported that pain severity and depression correlated positively with pain inter-ference and negatively with life control.74 Similar results are
found in other studies.75,76 In agreement with this study, pain
intensity was a significant regressor of pain interference in rheumatoid arthritis patients with chronic pain, but in con-trast to our results depression was a nonsignificant regres-sor.77 Unlike our generalization, it might be argued that pain
interference is not used consistently and exclusively in the literature78 and very broad definitions exist.79,80
Spreading of pain has been associated with worse out-comes for pain intensity, chosen coping strategies and health
aspects in patient cohorts81 and in population studies.82–84 In
our nationwide study, PRI was not a significant regressor of life impacts. Different results could have been due to the fact that our patients represent the most severe cases and a ceiling effect may be present for PRI.
Implications of the two clusters
The literature reflects great interest in identifying clusters of patients and investigating how these clusters benefit from treatment. For low back pain, such clusters have been based on pathoanatomy, psychosocial variables, or patterns of signs and symptoms.38 Psychological characteristics have been used
as input variables to identify subgroups/clusters in several studies.39–44 Most of these studies have been hypothesis
driven with respect to the input variables used, whereas our study from a larger set of variables used objective methods to select input variables to identify clusters. It was obvious that the variation in the clinical picture across patients not only depended on the psychological distress variables but also depended on pain intensity/severity and life impact variables (Figure 1). Hence, the present cluster analysis using the most important variables as input variables identified two clusters with very prominent differences in the clinical picture at baseline (Table 6). Cluster 2 had the worst situa-tion with respect to all input variables. Our results agree with other cluster analysis studies – including the famous clusters of MPI – using psychological variables as input variables: clusters with prominent psychological burden have higher pain intensity/severity.39,40 Labels such as depression–pain
syndrome85 and depression–pain dyad86 have been coined,
and patients in cluster 2 appear to fulfill such labels but not those in cluster 1. Thus, the need to include pain aspects, psychological distress, and life impact aspects in the clinical assessment is supported by this and other studies.39–41
In addition, variables that were not used for identifica-tion showed significant cluster differences (Table 6). These results, together with the results obtained at stratification of the HADS variables, pinpoint that a generally severe situ-ation has certain sociodemographic characteristics, which reasonably must be considered when planning interventions and treatments.
Surprisingly, patients with the most severe clinical picture (ie, cluster 2) were less often selected to or participated in MMRP, although this finding agrees with another study.39
Both clusters showed an agreement with earlier smaller studies from SQRP, ie, there were significant improvements in the input variables. The Swedish MMRPs are based on the available evidence that this type of intervention is more effective than usual care; the effect sizes are generally
Journal of Pain Research downloaded from https://www.dovepress.com/ by 130.243.46.239 on 26-Mar-2019
Dovepress
Gerdle et al
small to moderate. Smaller uncontrolled studies have reported significant effects after MMRP on several of the variables investigated here.94–97 This study was not primarily
performed to evaluate the effectiveness of MMRP, which requires randomized controlled trials and systematic reviews/ meta-analysis. Instead, this study investigates chronic pain patients in real-world practice settings within the concept of practice-based evidence,98 and the longitudinal results (Table
7) agree with the systematic reviews of MMRP. If no effects of MMRP were observed, MMRP in real-world practice set-tings do not give the anticipated results.
Severe psychological distress has been associated with worse treatment outcomes;18,25,26,99 however, cluster 2,
which had the highest pain intensity and the most severe anxiety and depression symptoms, had significantly larger improvements for all variables (Table 7) also when con-trolling for possible regression toward the mean. Even if greater improvement in cluster 2 is interpreted as a sign of regression to the mean and that these patients did not benefit from MMRP more than cluster 1, this cluster still improves at least as well from MMRP as those without severe psy-chological distress symptoms (cluster 1). This may seem unexpected, but it is important to recognize that MMRPs contain emotional and behavioral interventions stemming from cognitive behavioral treatment clearly addressing psychological symptoms.
Although treatment resistance after MMRP was not found in cluster 2, the basic pattern with a worse situation remained at the two time-points after MMRP (Table 7). Indeed, a third of the patients in cluster 2 continued to have clinically significant depressive and anxiety symptoms post-treatment and at the 12-month follow-up. This number suggests continued suffering for a significant proportion of patients and that MMRP content may not fully address the needs of these patients. Hence, because of their high entry rates of problems, psychological comorbidity is still present post-MMR, ie, patients with comorbidity have residual pain and psychological problems. Such a pattern has recently been found in another smaller SQRP study.39
The optimal composition, ie, included components and their intensity, and duration of a complex intervention such as MMRPs with respect to the clinical presentations of patients are not well understood.87,91,100,101 Based on the
dif-ferences between clusters 1 and 2 both at baseline and after MMRP, it is unclear whether MMRPs really should have the same content for the two clusters. For cluster 2, it appears that emotional and behavioral interventions are necessary as generally applied in MMRPs in Sweden and this finding
agrees with the literature.102 Still, it could be questioned
whether these interventions or other components of MMRPs were optimal (contents, intensity, and duration) since, eg, the psychological distress levels after MMRP were still high in cluster 2. However, the application of such methods may need to be tailored to better target symptoms and characteristics specific to patients belonging to cluster 1 with low/normal levels of psychological distress if outcomes for this group are going to improve.
The evaluation of complex interventions such as MMRP is not clear-cut, and different definitions of a positive outcome of an MMRP trial have been briefly presented elsewhere.49 In clinical practice, there are several outcomes
and to make things even more complicated the important goals of MMRP for the individual patient differs. Whether pain intensity/severity belongs to the important outcomes of pain treatments is a matter of debate among researchers, clinicians, and patients.103–106 The concept of one or few
primary outcomes and few secondary outcomes applied in pharmacological studies does not reflect the complexity of MMRP. In cluster 2, the effect sizes were moderate for most variables, while cluster 1 generally showed insignificant or small effect sizes (Table 7). In addition, anchor-based meth-ods for determining if the changes are clinically important will give similar results. Hence, for the MPI variables and especially the pain interference scale, a change of 0.6 has been considered important107,108 and for NRS-7d a reduction
of at least two units or 30% has been considered important.109
Neither of the two clusters exhibited important changes in NRS-7d immediately after MMRP and the 12-month follow-up (Table 7), but pain severity showed important changes. All MPI variables showed at least 0.6 changes in cluster 2 at both time-points compared with baseline values (Table 7). Cluster 1 only fulfilled this criterion for pain severity at the 12-month follow-up. Unlike comparisons using such a criterion (Cohen’s d or anchor-based), it can be argued that smaller simultaneous changes for several outcomes may still be clinically important.
In this sample, representative of the population of chronic pain patients seeking specialist care in Sweden, 14% were immigrants born outside Europe. This prevalence is a slight significant overrepresentation (χ2=263.01, df=1, P<0.001)
compared with the proportion (11.5%) of immigrants born outside Europe in the general population in Sweden (Sta-tistics Sweden, 2018; https://www.scb.se/en/). Moreover, these patients are disproportionally represented in cluster 2; nearly three times higher prevalence of immigrant patients compared with the other cluster. This means that chronic
Journal of Pain Research downloaded from https://www.dovepress.com/ by 130.243.46.239 on 26-Mar-2019
Dovepress Gerdle et al
disabling pain (operationalized as seeking specialist care and high distress and interference reporting) is more prevalent among immigrants. This points toward the importance of not overly biologizing pain but instead viewing and understand-ing pain in a biopsychosocial context (the link with education level also fits in this picture). Moreover, it also points toward a pressing need to adapt health care and MMRP services to fit the needs of these patients. The data also suggest that this is not quite the case at this moment as these patients are proportionally underrepresented in MMRP participation.
Strengths and limitations
The large number of patients with chronic pain conditions with a nationwide representation is an obvious strength of this study. It is likely that the findings are representative and close to the true population values for chronic pain patients referred to specialist care. However, patients referred to spe-cialist clinics represent a selection of the most difficult cases, so our results cannot be generalized to patients in primary health care or to persons with chronic pain in the community. We controlled for regression to the mean within the cohort of patients, but the cohort is reasonably an extreme group in relation to, eg, patients within primary health care, and it was not possible to control for such regression to the mean. Strength was the use of advanced multivariate data analysis. Classical statistical methods such as multiple linear regres-sion and logistic regresregres-sion can quantify the level of relations of individual factors but disregard interrelationships among different factors and thereby ignore system-wide aspects (eg, when a group of variables correlates with the investigated dependent outcome).110 Classical methods assume variable
independence when interpreting results,111 and there are
several risks considering one variable at a time.112 In the
context of our aims, the problems handling missing data, and the obvious risks for multicollinearity problems, we have refrained from using multiple linear regression and logistic regression. Instead, we used statistical methods tak-ing advantage of correlated regressors. On the contrary, it is not possible, as in multiple linear or logistic regression, to isolate the effects for a certain variable upon the dependent life impact variables regressed. Another limitation might be that self-reports can be influenced by perceptions of social desirability.77 Changes in the social context may have changed
and influenced the longitudinal analyses. However, we used validated and well-known instruments even though they to some extent represented different research epochs. The fact that no control group or treatment as usual group was avail-able, which ethically is complicated to arrange for a registry
of real-world practice patients, might have influenced our interpretation of changes after MMRP.
Conclusion
Based on >35,000 patients in Sweden referred to specialist care, our study found that 35%–40% of these patients had severe anxiety or depressive symptoms. Severe psychological distress was associated with some sociodemographic aspects. Dose relationships existed between the two psychological distress variables and pain aspects, but these correlations were relatively weak. Pain intensity/severity and the two psychological distress variables were significant regressors of the two life impact variables. Two clusters of patients were identified at baseline, and the patients in the cluster with the worse situation participated less in MMRP but showed the largest improvements in outcomes. The principle pattern of absolute differences between the two clusters remained after MMRP. The results emphasize the need to assess both pain and psychological distress and not take for granted that pain involves high psychological stress in the individual case. Moreover, this study showed that not all patients benefit from MMRP. A better matching between common clinical pictures and the content of MMRPs may help improve results. We only partly found support for treatment resistance in chronic pain patients with psychological distress burden.
Abbreviations
ANCOVA, analysis of covariance; HADS, Hospital Anxiety and Depression Scale; HAD-Anxiety, Anxiety subscale of Hospital Anxiety and Depression Scale; HAD-Depression, Depression subscale of Hospital Anxiety and Depression Scale; life control, MPI subscale concerning perceived life control; MMRP, multimodal/multidisci-plinary rehabilitation program; MPI, Multidimensional Pain Inventory; NRS, numeric rating scale; NRS-7d, aver-age pain intensity the last week according to a numeric rating scale; OPLS, orthogonal partial least square regres-sions; Outside Europe, born outside Europe; pain interfer-ence, MPI subscale concerning pain-related interference in everyday life; pain severity, MPI subscale concerning pain severity; PCA, principal component analysis; p(corr), X loading p scaled as a correlation coefficient between X and t, ie, this is the loading of each variable scaled as a correlation coefficient and thus standardizing the range from –1 to +1; PRI, Pain Region Index; PROM, Patient Reported Outcome Measures; SQRP, The Swedish Quality Registry for Pain Rehabilitation; University, University education; VIP, Variable Importance in Projection.
Journal of Pain Research downloaded from https://www.dovepress.com/ by 130.243.46.239 on 26-Mar-2019