Exploring metropolitan governance
in the Öresund Region
Roger Barres
Urban Studies: Master’s (Two-Year) Thesis Tutor: Peter Parker
Exploring metropolitan governance in the Öresund Region
Roger Barres
Urban Studies: Master’s (Two-Year) Thesis Tutor: Peter Parker
Summary and information
For the first time in history, more people in the world live in urban areas than in rural areas. Almost half of this world urban population now live in metropolitan areas, which are becoming central spaces of world economic and social activity, and where major global challenges happen and should be tackled.
Metropolitan areas are defined by urban spaces of integrated mobility flows and markets, but also by high institutional fragmentation and political decomposition. This fragmentation interferes in decision-making processes leading to difficulties for the design and implementation of adequate responses to metropolitan problems. In this context, the study of how metropolitan areas should be governed is gaining relevance in the field of urban studies, among other fields.
The normative debates about metropolitan governance has been framed by three traditions. From the 60s to the late 80s these debates were restricted to the ‘old regionalism’ dialectics between the metropolitan reform and public choice scholars. More recently, new regionalism recognize in flexible and cooperative governance instruments the most effective way to deal with metropolitan problems. From this perspective metropolitan areas are governed by complex governance relations between diverse actors through multiple and concurrent instruments, in the form of policy networks, voluntary cooperation, strategic planning, and so on.
The Öresund Region is a metropolis that spans from eastern Denmark to southern Sweden, and includes cities such as Copenhagen and Malmö. While it has been largely referenced and praised as an example of cross-border metropolitan area, there is little evidence on how it is governed or which are the main governance instruments or who are the actors involved in the policy-making process.
Taking an original approach to the study of metropolitan governance, this paper represents a first attempt to identify and understand the main features of metropolitan governance in the Öresund Region as a system, in a polycentric and multilayered cross-border metropolis.
The results suggest that metropolitan governance in the Öresund Region is very ambiguous, with several agents acting in different and non-coincident scales, strongly focused in hard policies and development policies in contrast to social and environmental policy areas. Also, there are persistent barriers to cross-border governance despite the favorable context. And finally, there is a relevant democratic governance deficit, in terms of social actors’ participation and involvement in the metropolitan decision-making process.
These first results recommend to go forward with further research in this issue. Particularly to grasp about governance networks operatives, policy-making processes, and citizens’ political orientations to, ultimately, propose improvements for a more effective, comprehensive and democratic governance in the Öresund metropolitan region.
Key words: metropolitan area, city-region, metropolitan governance, urban politics,
Table of Content
Summary and information 1
Introduction, aim and problem 3
Theory and method 5
Metropolitan governance: schools of thought 5
Cross-border metropolitan governance 7
Method 8
Defining and delimiting metropolitan areas: the Öresund Region 12
The OECD definition of functional urban areas 13
Eurostat and national statistical agencies definitions: SCB and DST 14
Contrasting definitions 16
The Öresund Region as a cross-border metropolitan region 18
Metropolitan governance in the Öresund Region 26
Metropolitan governments in the Öresund Region 26
Metropolitan agencies in the Öresund Region 27
Vertical coordination in the Öresund Region 32
Voluntary cooperation in the Öresund Region 33
The Öresund’s metropolitan governance ‘system’: features and deficits 37
Conclusions and discussion 44
References 46
Appendices 52
Appendix A 52
Appendix B 55
Introduction, aim and problem
Current research in the field of urban studies very frequently starts with a similar claim: world population is more urban than ever; or the process of urbanization in the world is steadily growing. Nowadays, a majority of the world population is already living in urban areas. In 2030 it is predicted that the urban population will rise up to 60%. And, by 2050, 75% of the world population will be urban (UCLG, 2016; UN, 2018; UN Habitat, 2017). Among the urban population, 41% is currently living in city-regions or metropolitan areas. Metropolitan regions are urban areas defined by socioeconomic flows and political fragmentation, in which a core city and its hinterlands are connected by some functional tie, in terms of commuting flows, labor markets, etc. They have become spaces in which central social and economic activities are constructed (Rodríguez-Pose, 2008) and are gaining relevance as spaces in which major global challenge–social, economic and environmental– should be tackled (Glaeser, 2011; Tomàs, 2016).
Taking into account the increasing centrality of metropolitan regions, they have become a very relevant topic for the academia, urban elites and policy circles. Specifically, whereas the challenges posed by the metropolitan phenomena are diverse, the debate on how they should be governed is gaining relevance in the field of urban studies (Heinelt & Kübler, 2005; Purcell, 2007; Savitch & Vogel, 2009).
The relevance of this studies is rooted in the fact that metropolitan regions are, by definition, fragmented spaces. Metropolization is characterized by processes of urbanization cutting across defined institutional and territorial boundaries, either local, regional or national boundaries. There is a divergence between the functional urban area that forms the metropolitan region and the several diverse public institutions that operate in this area. This institutional fragmentation and political decomposition ultimately interfere in the decision- and policy-making processes (Le Galès, 1998; Heinelt & Kübler, 2005), in simple words: “governmental fragmentation leads to difficulties regarding the formulation and implementation of adequate policy responses to metropolitan problems (Kübler & Schwab, 2007, p. 473).
The Öresund Region, also known as Greater Copenhagen, has been widely referenced and publicized as one most innovative and dynamic metropolitan regions in Europe (Hospers, 2006; Nauwelaers et al., 2013; OECD, 2015). In fact, it has been identified as a metropolitan region in terms of clustered economies, research and education, housing market or even culture and identity (Lund Hansen, et al., 2001; Greve & Rydbjerg, 2003; Garlick et al., 2006; Lögfren; O'Dell et al., 2011).
The construction of the Öresund bridge in 2000 represented a breaking point in the social, cultural and economic integration of the Danish and Swedish shores (Wichmann Matthiessen, 2004; Lögrofren, 2008; O’Dell et al., 2011; Nauwelaers et al., 2013). Since then, the metropolitan region is generally considered to include the urban area of Copenhagen and the areas of Malmö and Lund in Sweden and has been generally publicized as a best-practice of cross-border integration (Nauwelaers et al., 2013). Having said that, the Öresund Region is still an ambiguous concept. In territorial terms it is generally accepted that includes the capital city of Copenhagen and its suburbs and
spans until the urban area of Malmö and Lund, in the southern part of Sweden. But there is still no clear definition of its limits and the communities included in.
In parallel, and more important to this research, despite its recognition there is an important lack of knowledge and understanding about its governance model. Particularly; which actors are involved and which excluded in the policy-making and decision-making process in this Region? Which policy areas, if any, are designed and implemented at the metropolitan scale? And ultimately, there is something such a metropolitan Öresund Region and how it is politically constructed? The aim of this research is to provide an initial and, to my knowledge, first-time exploration of the governance system in the Öresund metropolitan region.
In addition, I will take a special look into the democratic governance in the Öresund Region. Whereas research on metropolitan governance has traditionally focused in the most effective and efficient ways of organizing metropolitan areas, several authors have recently noted the necessity to look at the democratic legitimacy and performance of metropolitan arrangements (Hamilton, 2004; Heinelt & Kübler, 2005; Purcell, 2007; Kübler, 2012; Zimmermann, 2014). In this sense, the study of metropolitan governance, and particularly in fragamented cross-border urban areas, might be relevant in order to understand the broader democratic sources and performance in urban development. The structure of the thesis is as follows. In the first section I will present the most relevant theoretical approaches to metropolitan governance, their focus of study and their normative goals. Finally, I will present my methodological approach to the study of metropolitan governance in the Öresund Region.
Second, I will discuss the definition and delimitation of metropolitan regions. Since there is not a single definition of metropolitan or city-regions I will present the most common definitions, how they differently fit in the case of the Öresund Region. These delimitations will be the base for the further analysis of the metropolitan governance scheme in the Region.
Third, I will present the analysis of the Öresund Region from a metropolitan governance framework perspective. To do so, I identify the most relevant institutions and arrangements of metropolitan governance in the cross-border region and in each country, and I study their main features in terms of objectives and areas of intervention, membership, organization and representation.
Fourth, I will present the main results of the identification and description of the metropolitan governance structures and I will discuss some of the most relevant deficits and challenges.
Last, I summarize a set of conclusions and present some unsolved questions that require further research in the future.
Theory and method
In the study of metropolitan regions, the debates about how they are governed is one of the most recurrent. These debates are controversial due to opposite visions, encountered interests, and contested normative conceptions of how metropolitan areas should be organized and governed, and which goals should they pursue. Traditionally these debates have been framed from the perspective of three schools of thought: the metropolitan reform, the public choice school and new regionalism (Heinelt & Kübler, 2005; Savitch & Vogel, 2009).
Metropolitan governance: schools of thought
During the 60s and 70s, the expansion of welfare state systems facilitated optimistic views on the capacity of governments to provide public goods and services (Keating, 1995; Tomàs, 2017b). In this context, the metropolitan reform school gained relevance. Metropolitan reform scholar saw in the existence of a large number of independent municipalities as the main obstacle to the efficient and equitable provision of public services and resources in metropolitan areas. The main mechanism to surpass the fragmentation was the consolidation of governmental structures at the metropolitan level (Sharpe, 1995; Stephens & Wikstrom, 2000). Therefore, metropolitan areas should become a single political-administrative unit through the creation of a metropolitan government with a high degree of autonomy and competences.
From this perspective, the superiority of consolidated metropolitan governments shall be understood from the capacity of consolidated metropolitan governments to meet principles such as territorial equality, effectiveness and democratic legitimacy through the direct elections of representatives (Sharpe, 1995; Tomàs, 2017b).
In the late 70s and the 80s, amid economic crisis and the rise of Thatcherism the metropolitan reform model lost momentum. Many of the most iconic metropolitan governments created in the previous years were abolished: Greater London, Greater Copenhagen Council, Metropolitan Corporation of Barcelona, Rotterdam… (Sharpe, 1991; 1995; Anders et al., 2002). Big metropolitan governments were criticized for being imposed models from upper-tier levels of government that hampered local autonomy and as highly centralized and excessively bureaucratic structures that created inefficient policies and processes (Bish & Ostrom, 1973; Tomàs, 2012).
In this context public choice approach emerged. Contrary to the reformist approach, public choice scholars argued that fragmentation was, in fact, positive for an effective provision of public goods and services. In such fragmented areas, people, seen as consumer-voters, would look for the most suitable place of residence in terms of services, taxes, etc. (Tiebout, 1956). Municipalities would have incentives to compete between them to attract residents, which ultimately would have a positive effect over the quality and efficiency of public services and goods (Ostrom et al., 1961; Bish & Ostrom, 1973). They also argue that small governments could be more effective and democratic than to big consolidated metropolitan governments since they were more responsive to the local needs (Bish & Ostrom, 1973).
More recently, in the 90s emerged a new school of thought, new regionalism, as a middle ground alternative to ‘old’ regionalism dialectics, between the metropolitan reform and
public choice schools (Heinelt & Kübler, 2005; Tomàs, 2012; 2017b). As we will see, this transition from ‘old’ to ‘new’ regionalism is closely linked to the ‘shift from government to governance’ (Kübler & Schwab, 2007, p. 474), which would raise parallel debates.
New regionalism emerged among scholars, particularity in the US, aware of the problematics derived from urban sprawl and spatial specialization. These scholars developed new conceptions about center-periphery interdependences and the need of joint action, social cohesion and redistribution in metropolitan regions (Rusk, 1993; Downs, 1994; Swanstrom, 2001).
Furthermore, new regionalism emerged in an era in which the globalization process, accompanied with a weakening of the nation-state (Barber, 2013), situated cities as economic and social global centers (Sassen, 1991; Glaeser, 2011). New urban hierarchies are created and cities compete for global capital, shifting their focus to business promotion and attraction, and entrepreneurialism, and regional development and global competition have become organizing principles for city-regions and metropolitan regions (Harvey, 1989, Le Galès, 2002; Rodríguez-Pose, 2008; Jonas, 2012). Among them, metropolitan regions emerge and compete as global poles of economic and social production (Lever, 2001).
While new regionalism also recognizes strong metropolitan governance as necessary, in contrast to the metropolitan reform school that does not mean that it requires institutional consolidation. In contrast, new regionalism advocates for more flexible and less institutionalized forms of cooperation. From this perspective, metropolitan governance capacity is characterized by interdependence and cooperation, and it can be reached through policy networks and more flexible mechanisms of voluntary cooperation (Heinelt & Kübler, 2005; Kübler & Schwab, 2007).
Due to the particular institutional fragmentation of metropolitan regions cooperation is crucial in order to produce and provide public service and goods. This being said, institutional fragmentation usually comes with collective action problems that might hinder effective cooperation (Feiok, 2007; 2013; Ostrom, 2011). Specifically, some authors argue that the particularities of local communities are major explanators of institutional collective action in metropolitan contexts (Thurmaier & Wood, 2002; Feiock, 2009; Bel & Warner, 2015; Hawkins, 2017; Tavares & Feiock, 2018). There is a consensus that factors such as socio-economic homogeneity among communities (Tsebelis, 2002; Feiock, 2013; Tavares & Feiock, 2018), governmental organization similarity, cooperation tradition, and inter-institutional trust (McEvily et al., 2003; Feiok, 2007; Provan & Kenis, 2007), are among the most relevant factors of institutional collective action in metropolitan contexts.
In this respect, current research in metropolitan governance focuses in the interdependencies, roles and resources of policy networks involved in the policy-making and decision-making processes at the metropolitan scale.
Also, similar to the debates that governance theory have raised, new regionalism has contrasting views about democracy (Heinelt & Kübler, 2005; Kübler & Schwab, 2007). From an optimistic point of view the participation of a wide variety of actors in governance networks is an opportunity for citizen empowerment, state pluralization and
associative democracy, and may encourage more pluralistic and dialogic approaches to policy-making (Hirst, 1994; Sørensen & Torfing, 2005; Sørensen & Torfing, 2009; Bevir, 2010).
Several authors recognize that the coexistence of various mechanisms and legitimacies is key to democratic governance. For instance, Sørensen and Torfing (2005; 2009) note that democratic governance arrangements should rely on both direct and indirect democratic representation. They identify four main factors of democratic legitimacy: first, the control by democratic elected representatives that make sure that policy produced respond to the popular will represented by a political majority. Second, decision-making must rely on representative membership of the directly affected people and organizations, and reflect or take into account their diversity of interests, preferences and opinions. Third, governance activity must be hold accountable to a wider group of the indirectly affected. Finally, any governance arrangement must function through internal democratic rules and norms.
And Zimmermann (2014) points out at three main sources of democratic legitimacy in metropolitan governance: input legitimacy, output legitimacy, and throughput legitimacy. First, input legitimacy is given by both political representation through electoral processes and by the direct participation of groups and individuals in decision-making processes and their capacity to determine outcomes. In this sense, input legitimacy embraces representative democracy and mechanisms of participatory democracy or direct democracy. The second source of legitimacy is given by institutional action and its ability to respond to solutions to the needs of citizens. Finally, the third source makes reference to the ability to incorporate all relevant actors, beyond institutional actors, in the governance processes and it is defined by openness and inclusiveness, accountability, and transparency (Schmidt, 2013; Zimmermann, 2014).
In contrast, similar to the critiques raised against governance, there is a pessimistic view that worries about the centrality of effectiveness and efficiency and the dominance of market interests over democratic factors such as citizen participation and accountability (Heinelt & Kübler, 2005; Kübler & Schwab, 2007). From a democratic theory perspective, and in contrast to Zimmermann’s argument, this view sees a tension between the diverse sources of legitimacy; particularly between the seeking of effectiveness, that is output legitimacy, and citizen participation, thus input legitimacy (Dahl, 1994; Scharpf, 1999 in Kübler & Schwab, 2007). The incorportaion of private actors in poliy networks may have impact over the agenda setting and policy outcomes, in terms of prioritizin private interests, and may reduce democratic accountability due to the difusion of representative institutions inside networks (Mayntz, 1998; Papadopoulos, 2003 in Kübler & Schwab, 2007).
Cross-border metropolitan governance
All these challenges and interferences that metropolitan governance may face are even more demanding in border contexts; besides highly fragmented contexts, cross-border metropolitan areas embedded in multi-national settings, formed by different domestic institutions which are characterized by contrasting political settings and cultures, different languages and policy paradigms (ESPON, 2010, p. 11).
While metropolitan governance research has been relatively scarce in the study of cross-border regions, policy networks literature has shown a strong interest (Sohn et al., 2009;
Nelles & Durand, 2012; Dörry & Decoville, 2013; Walther & Reitel, 2013; Sohn & Giffinger, 2015).
As Walther and Reitel note, the study of cross-border metropolitan regions is relevant for the at least three reasons (2013: 219). First, it forces to rethink a counterintuitive relationship between border spaces and the city as a node and center of accumulation and social interaction. Second, cross-border metropolitan regions have emerged as privileged spaces of globalization. And, third, these regions are among the most benefitted of the European integration process.
Policy network approach aims to understand actor relations and interdependences that shape policy-making processes and outcomes, focusing in identification of the key actors involved (Walther & Reitel, 2013). It has become a widely used approach in urban politics in general, but it has shown especially useful in the analysis of cross-border metropolitan regions “in the face of the fragmented territorial settings, diverging interests and dispersed resources” (Sohn & Giffinger, 2015, p. 1191). In contrast, governance research has looked at cross-national institutions and arrangements, but less on the interrelation between these and other local, regional and national actors.
That being said, new regionalists perspectives provide a very suitable framework to fill a gap between metropolitan governance literature and the analysis of cross-border metropolitan areas. Following Sohn and Giffinger (2015), cross-border metropolitan regions cannot be fully understood by the identification of fixed institutions. Instead, they are characterized by the proliferation of initiatives and institutional frameworks for cooperation in which public and private develop diffuse forms of governance based on multilateral connections between heterogeneous actors.
In this research I am particularly interested in the analysis of metropolitan governance applied to both national and cross-border metropolitan regions. As I will present, the urban areas at both sides of the Öresund should be understood as a system with multitiered interactions in either the cross-border context and each national one–Denmark and Sweden.
In order to do so, in this paper I have identified and analyzed metropolitan governance considering both institutions and policy networks with a metropolitan scale. In the next section I will present the methodology by which I have identified them and which factors I will take into account for the analysis of governance schemes.
Ultimately, the study of the Öresund Region is relevant from at least two perspectives. First, while the Öresund Regions has been widely referenced, to my knowledge this is the first analysis of its governance model, and, more generally, it contributes to a better understanding of metropolitan governances in the Nordic context. And second, it tries to bridge a gap in the study of metropolitan governance in cross-border contexts.
Method
I take a new regionalist approach to metropolitan governance. Through the revision of academic articles and books, policy papers, reports, and institutional websites I identify governance structures and networks that operate in the region, and describe determining factors of each in their role in a general system of governance.
First, in order to identify structures of metropolitan governance, I delimit the extension of the metropolitan region. For this I would evaluate the delimitations of the Öresund Region based in existing definitions. As a concept, metropolitan area or city region is loosely defined; there is a diversity of concepts and definitions, and the delimitation of a single metropolitan regions is often ambiguous. In the case of transnational city regions the existence of more than one sovereignty, with their particular institutional and political models, may add extra ambiguity.
Taking this in mind, prior to the definition of the metropolitan governance system, and in order to limit the focus area, I conduct a comparative analysis of the territorial delimitations of the Öresund Region. I contrast the most common and used methodologies and definitions of metropolitan regions and propose a delimitation for the case of the Öresund Region that sets a framework for the study of actors and institutions.
Then, I use an approach of metropolitan governance models for the identification of metropolitan actors. Metropolitan governance is usually operationalized following the principles of the three theoretical schools; for instance, Eklund (2016) classifies three models of metropolitan governance as consolidated, fragmentated and regionalization. Conversely, the Metropolitan Research Institute (2018) distinguishes between more
institutional and consolidated vs. procedural arrangements. Here I will use the approach
developed by Tomàs (2015; 2016; 2017a).
Tomàs defines metropolitan governance models by the interrelation of several elements, including fragmentation, competencies and powers, and political representation and democratic legitimacy. First, metropolitan governance can be characterized by diverse levels of fragmentation; in a context of institutional simplicity only one or few institutions operate at the metropolitan level. Otherwise, high fragmentation is given when a large number of structures have diverse competencies in a single metropolitan region.
Second, metropolitan institutions can have competencies and power over different areas, and more importantly they may be single- or multi-purpose entities. Metropolitan structures most usually have competencies in hard policies, and particularly, territorial planning, transport and environmental policies. Other areas in which they generally intervene are the ones related to economic development, particulary wealth generation and employment promotion, through policies meant to attract investments and skilled labour in a globalized economy, in line with the views of metropolitan regions as actors in global competition (Le Galès, 2002; Rodríguez-Pose, 2008; Jonas, 2012).
Finally, Tomàs notes that metropolitan governance can vary in its democratic scope, from more exclusive forms of representation to more inclusive ones. From non-direct representation, traditional representative democracy to more pluralistic and participatory modes of democratic governance.
Taking into account all these elements Tomàs identifies four main models of metropolitan governance (2015; 2016; 2017a): metropolitan governments, metropolitan agencies, vertical coordination and voluntary cooperation.
• Metropolitan governments: governmental structures at the metropolitan level created expressly to deal with metropolitan problems. They ideally have own and exclusive competences, high or medium fiscal autonomy and a degree of
democratic legitimation through they direct election of representatives. They can be single-level–after the merge of municipalities and the consolidation of a metropolitan city government, e.g. London–or two-levels–maintaining municipalities plus a supra-municipal body of government, e.g. Hannover, Barcelona.
• Metropolitan agencies: sectorial agencies with a medium degree of
institutionalization created to manage a single service, such as regional planning, public transport, environment, security and policing, etc.–e.g. Birmingham, Frankfurt.
• Vertical coordination: existing governments at the supra-municipal level, such as regions, counties or provinces, that provide de facto metropolitan policies and services even though they are not metropolitan in their territorial scale–e.g. Brussels, Madrid.
• Voluntary cooperation: the lowest institutionalized model, based on voluntary and flexible cooperation among municipalities or between public and private agents through governance networks, inter-municipal associations, political platforms, strategic planning, etc.–e.g. Hamburg, Helsinki.
From here, my particular view is that these are not exclusive models. From a new regionalist perspective, a diversity of model structures can coexist in a single territory. Moreover, we can expect that in cross-border metropolitan regions the existence of two or more sovereign nations, and their respective institutional models and legal frameworks, lead to the coexistence of diverse governance structures at both the national and transnational levels.
Tomàs’ model is suitable to identify and classify organizations and arrangements of metropolitan governance. Therefore, I use this classification as a tool for the identification of structures, entities, organizations of metropolitan governance and their levels of institutionalization. It is relevant to note that, in order to narrow the number of cases, I have chosen to look only at stable and enduring structures of governance, that are still active today.
Having said that, in this paper I am particularly interested in the analysis of metropolitan governance as a ‘system’. In order to do that I have taken into consideration policy networks and network governance approaches. Thus, I have followed a policy network approach in the aim to identify and understand actor relations and interdependences that shape policy-making processes and outcomes (Walther & Reitel, 2013; Sohn & Giffinger, 2015), And second, from the network governance literature, focused on the assessment of networks performance and their policy impact, I try to describe internal factors such as membership and number of participants, typology of actors involved, competences and procedures (Sørensen & Torfing, 2005; 2007; 2009; Provan & Kenis, 2007; Kenis & Provan, 2009).
In these terms, I take an approach in which governance structures are defined by both their internal features–membership and actors roles, policy outcomes, rules and procedures–and their position and role in the metropolitan governance ‘system’. I analyze the following dimensions:
• Scale: either if it is a governance structured that spans to the cross-border metropolitan scale or the national scale, and its territorial extension–which communities are included;
• Type of organization: how is formally defined each governance structure, public agency, PPP, association…;
• Areas of intervention: in which policy or policies domains are involved each governance structure;
• Membership and organization: what kind of actors are members of each governance structure and how they operate internally.
In sum, my approach to metropolitan governance takes into account both a classification of governance structures based on the scale and policy areas of intervention, but also other organizational characteristics, mainly actors involved, rules and roles.
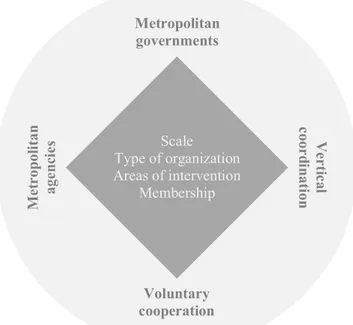
More importantly, my perspective on the metropolitan governance in the Öresund Region, based on new regionalist and network approaches, is that diverse institutional models of metropolitan governance coexist as part of a broader ‘system’ of metropolitan governance (see figure 1). Only if we look at them together, will we be able to have a comprehensive approach of metropolitan governance.
Figure 1. Metropolitan governance framework
Source: own elaboration.
Metropolitan governments M et rop ol it an age nc ie s Ve rt ic al coor din at ion Voluntary cooperation Scale Type of organization Areas of intervention Membership
Defining and delimiting metropolitan areas: the Öresund Region
There is not a single definition of metropolitan regions. In addition, the diversity of definitions includes several relevant factors: economic, housing or labor market ties between core city and hinterlands, social and cultural dominance by the core, one single core or polycentric regions… (for a review see Rodríguez-Pose, 2008). It is also frequent the find confusion and interchange of many concepts: global cities, urban agglomerations, city-regions, functional urban areas… In particular, metropolitan regions, city-regions and functional urban areas are commonly used as synonymous. Yet, usually these differences are just a matter of size (Le Galès, 2002; Lidström, 2012).
Having said that, among all the definitions there is a minimum common denominator: the existence of a core city surrounded by hinterlands and connected by functional ties. In statistical terms these functional ties usually take form of commuter flows or regional labor markets (Bennet, 1985; Rodríguez-Pose, 2008; Nordregio, 2016). From this basic definition there are many methodological approaches. In the European context, among the most relevant the OECD has developed a methodology to define functional urban areas (FUA). The European statistical office, Eurostat, has elaborated a list of European metropolitan regions and many countries have own methodologies to identify and delimit metropolitan regions thorough their statistical agencies. It is relevant to note that there are also other methodological approaches that have focused on urban agglomerations instead of metropolitan regions1, the main difference being that the former does not consider existing administrative boundaries to identify and the latter take into account either the municipality or other administrative divisions to define limits.
That being said, there is a clear methodological gap between those methodologies and the definition of cross-border metropolitan regions. Political sciences tend to look at sociopolitical phenomena through a statist lens; that is the nation-state as the basic unit of research. The urban and metropolitan dimensions do not escape from this. At first glance, this might have two simple answers. First, the urban phenomenon, and particularly metropolization, are so highly determined by state institutions and national dynamics that they rarely cut across national borders. While, there is evidence of the effects of national borders in both individual and institutional behavior, cross-border metropolitan integration is not uncommon in Europe (Blatter, 2003; Reitel, 2006; Sohn et al., 2009; Bartz & Fuchs-Schündeln, 2012; Durand & Nelles, 2012; Walther & Reitel, 2013; Nelles & Durand, 2014; Sohn & Giffinger, 2015).
The second explanation is that the methodologies used to empirically analyze urbanization and metropolization are still constrained national borders and policies that they fail to explain these processes in transnational spaces. For instance, national statistics on employment do not consider cross-border commuting (Nordregio, 2016).
In the following section I will present the most common definitions of metropolitan areas, and contrast them in the case of the Danish and Swedish areas in the Öresund Region. Based on these definitions I will propose a common delimitation of the whole cross-border region that will guide the analysis of the governance system.
1For an example see
The OECD definition of functional urban areas
One of the most used definitions of metropolitan areas is OECD functional urban areas (FUA) classification2. This methodology defines functional urban areas based on two groups of municipalities with specific commuting flows (OECD, 2013; Nordregio, 2016; Dijkstra, Poelman, & Veneri, 2019):
a) urban cores, consisting in high-density urban clusters with more than 50,000 inhabitants and 1,500 inhabitants/km2
b) and their hinterlands; commuting zones with at least 15% of the employed residents working in a core.
From these definitions the OECD categorize four classes of FUA:
1) Large metropolitan areas: urban cores and their hinterlands with a population above 1.5 million people.
2) Metropolitan areas: population between 500,000 and 1.5 million people. 3) Medium-sized urban areas: population between 200,000 and 500,000 people. 4) Small urban areas: population between 50,000 and 200,000 people.
From this methodology, Nordregio (2016) identifies only two large metropolitan areas in the Nordic countries–Stockholm and Copenhagen–, four metropolitan areas–Helsinki, Oslo, Goteborg and Malmö–, ten medium-sized urban areas and thirteen small urban areas, including Helsingborg (see table 1). In the whole Öresund Region, Nordregio identifies three FUA: Copenhagen, Malmö and Helsingborg.
Table 1. Functional urban areas in the Nordic countries
FUA class Sweden Denmark Finland Norway Iceland Total per
FUA class Large metropolitan areas Stockholm Copenhagen - - - 2 Metropolitan
areas Goteborg Malmö - Helsinki Oslo - 4
Medium-sized urban areas
Uppsala Aarhus Tampere Bergen Reykjavik
10
Odense Turku Stavanger
Aalborg Trondheim
Small urban
areas Linköping - Oulu Kristiansand -
14
Örebro Jyväskylä Tromsø
Västerås Lahti Helsingborg Kuopio Norrköping Jönköping Umeå Borås Total per country 12 4 7 6 1 30 Source: Nordregio (2016). 2See https://measuringurban.oecd.org [11/04/20]
The OECD methodology identifies Copenhagen as one of the two only large metropolitan areas in the Nordic countries. The Copenhagen urban area has a population of over 2.2 million people across 37 municipalities from two regions, Hovedstaden (“The Capital Region”) and Zealand. However, a relevant share of the metropolitan population that is concentrated in the city of Copenhagen (28.2%), while the following bigger cities slightly represents a 3-5% of the regional population (see appendix A1).
In Sweden, the OECD method identifies Malmö as a metropolitan area, formed by 14 municipalities and with a population of almost 770,000 inhabitants (see appendix A2). Its urban core is formed by Malmö and Lund, which together have a population of over 460,000 inhabitants, representing 60.5% of the total population of the metropolitan region. Malmö alone represents over 44% of the metropolitan population. In contrast to the Copenhagen region, while Malmö-Lund is not as monocentric by the fact that it has two core cities, it is a much more concentrated area.
The OECD methodology also delimits medium- and small-sized urban areas. In this case it identifies Helsingborg as an independent medium-sized urban area of more than 204,000 inhabitants. The urban core in the Helsingborg municipality and three hinterland municipalities: Höganäs, Åstorp and Bjuv (see appendix A3). In this case, the population of the core city represents more than 70% of the total population.
Eurostat and national statistical agencies definitions: SCB and DST
Another common classification of metropolitan areas is the one provided by national statistical agencies. There is not a common definition of metropolitan regions among national classifications so comparative analysis might face some problems. In this case, Statistiska centralbyrån or SCB is the Swedish statistical agency and Danmarks Statistik or DST in Denmark.
DST uses Eurostat’s definition of metropolitan regions. In this case, Eurostat makes use of the NUTS (Nomenclature of Territorial Units for Statistics) classification as the basic unit to delimit metropolitan regions. In particular NUTS-3, which in Sweden correspond to the regions and in Denmark to the provinces3. Therefore, Eurostat defines a metropolitan region as a single NUTS-3 region or a group of NUTS-3 regions in which 50% or more of the population lives in an urban area of at least 250,000 inhabitants (Eurostat, 2019).
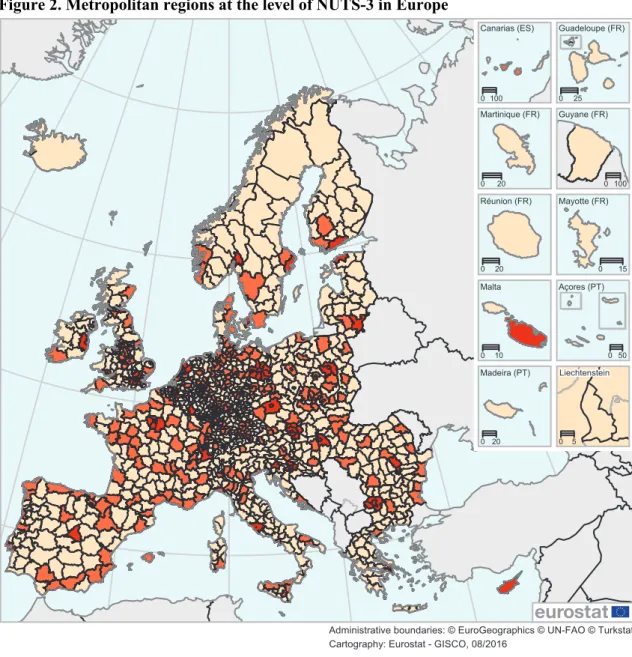
In this model in Sweden there are four metropolitan regions: Stockholm, Gothenburg, Malmö and Uppsala, that respectively correspond to the regions of Stockholm, Västra Götaland, Skåne and Uppsala. And in Denmark there are four metropolitan regions Copenhagen, Aarhus, Odense and Aalborg, that correspond to the provinces of Copenhagen city, East Jutland, Funen and North Jutland. By this methodology in the Öresund region there is one metropolitan area: Greater Copenhagen which corresponds to the Byen København (“Copenhagen city”) province. It is formed by 18 municipalities with a total population of over 1.3 million people. Almost half of the total population is concentrated in the city of Copenhagen (see appendix A4).
3 DK011 Copenhagen city; DK012 Copenhagen region; DK013 North Zealand; DK014 Bornholm; DK021 East
Zealand; DK022 West and South Zealand; DK031 Funen; DK032 South Jutland; DK041 West Jutland; DK042 East Jutland; DK050 North Jutland. See https://ec.europa.eu/eurostat/web/nuts/background [10/04/20]
Figure 2. Metropolitan regions at the level of NUTS-3 in Europe
Source: Eurostat.
The Swedish statistical office has its own model for delimiting metropolitan regions. They define metropolitan areas from mobility and commuting flows, and collaboration in planning between municipalities4. They identify three metropolitan areas in Sweden: Greater Stockholm, Greater Gothenburg and Greater Malmö. In this case, Greater Malmö is formed by 12 municipalities (see appendix A5). It is the smallest of the three Swedish metropolitan areas with a total population of 733,000 inhabitants concentrated in Malmö (46.5%) and Lund (16.8%).
4 See
https://www.scb.se/hitta-statistik/regional-statistik-och-kartor/regionala-indelningar/funktionella-regioner-och-kommungrupper/ [10/04/20]
Administrative boundaries: © EuroGeographics © UN-FAO © Turkstat
(¹) Based on population grid from 2011 and NUTS 2013.
Typology of metrolitan regions (at the level of NUTS 3) (¹)
0 200 400 600 800 km Guadeloupe (FR) 0 25 Martinique (FR) 0 20 Guyane (FR) 0 100 Réunion (FR) 0 20 Açores (PT) 0 50 Madeira (PT) 0 20 Canarias (ES) 0 100 Malta 0 10 Liechtenstein 0 5
Cartography: Eurostat - GISCO, 08/2016
Source: Eurostat, JRC and European Commission Directorate-General for Regional Policy
Mayotte (FR)
0 15
Capital metropolitan regions Metropolitan regions Non-metro regions
Contrasting definitions
In comparative terms, the OECD method defines bigger, more fragmented, less concentrated5 metropolitan regions. For the Copenhagen region the differences between the two definitions are very significant (see table 2). The OECD identifies Copenhagen as a region with +900,000 inhabitants and +19 municipalities than Eurostat–and DST. In spatial terms it extends over more municipalities in the Region Sjælland and it is less concentrated: the relative weight of Copenhagen is lowered by the coexistence of a bigger number of municipalities and, particularly, medium-size cities such as Roskilde, Holbæk or Helsingør.
Table 2. Method comparison for Copenhagen
N municipalities Population 2019 Fragmentation Concentration
OECD-Nordregio 37 2,209,139 1.7 28.2
Eurostat (DST) 18 1,320,629 1.4 47.2
Diff. (OECD-DST) +19 +888,510 +0.3 -19.0
Source: own elaboration from DST.
In the Swedish case, the differences between the two methods are not that significant (see table 3). In the OECD definition the Malmö urban area has two more municipalities, Sjöbo and Hörby, and +35,000 inhabitants. However, in comparison to Greater Malmö defined by SCB it is slightly a more fragmented region, and the weight of the most populous municipalities is a somewhat lower.
Table 3. Method comparison for Malmö
N municipalities Population 2019 Fragmentation Concentration
OECD-Nordregio 14 767,780 1.8 44.4
SCB 12 733,037 1.6 46.5
Diff. (OECD-SCB) +2 +34,743 +0.2 -2.1
Source: own elaboration from SCB.
Eventually, comparing the two metropolitan regions is not surprising that the Copenhagen region is bigger than Malmö, both in terms of number of municipalities and population– over 1 million people more on average. However, they are quite comparable in terms of concentration (46.0 on average), except for the OECD definition of the Copenhagen area, and also similar with regard to fragmentation (1.6 on average).
But most importantly, it is interesting how a seemingly objective definition of a metropolitan region can vary so greatly. That has direct implications for how appropriate governance might be viewed.
5Fragmentation makes reference to administrative division of a region, calculated by: n municipalities/metro
population*100,000; Concentration is the relative weight of the most populous municipality, calculated by: city population/metro population*100
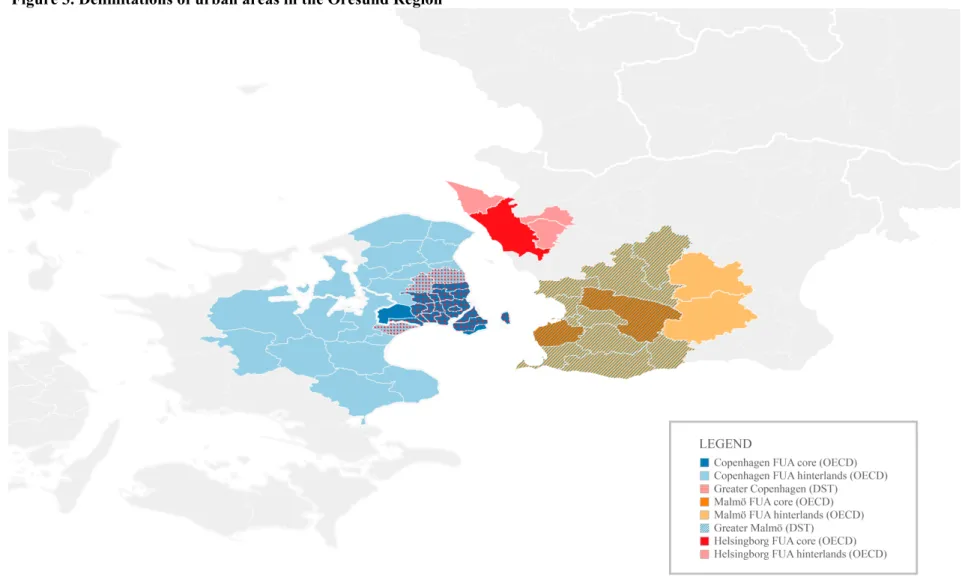
Figure 3. Delimitations of urban areas in the Öresund Region
The Öresund Region as a cross-border metropolitan region
Now, it is clear that none of the most used methods to identify and delimit metropolitan areas takes into account the transnational scale and they are blind to cross-border metropolitan regions. This is due mainly to the lack of national statistics on employment that consider cross-border commuting (Nordregio, 2016). Fortunately, and contrary to the most common lack of cross-border commuting data, the Ørestat project, and particularly
Öresundsdatabasen6, collects and harmonizes socioeconomic data for the Öresund Region.
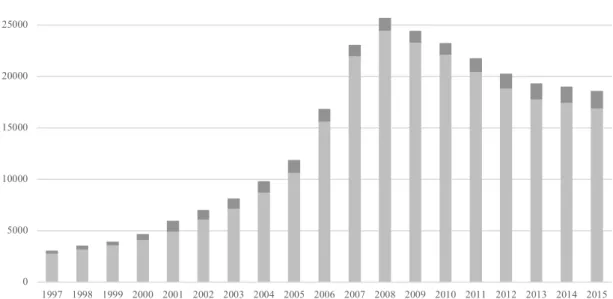
The data available in Öresundsdatabasen shows that commuting in the Öresund region7 has been a story of success, especially in the period 1997-2008, when the number of commuters grew year by years. The opening of the Öresund bridge in 2000 represented a breaking point in these flows (Wichmann Matthiessen, 2004; Nauwelaers et al., 2013). Cross-border commuting reached its peak in 2008 with over 25,000 commuters. However, the outbreak of the financial crisis stopped this tendency and started a steady decline (figure 4).
Figure 4. Commuters and other income recipients in the Öresund Region (1997-2015)8
Source: own elaboration from Öresundsdatabasen.
Commuting patterns in the Region has always been characterized by uneven flows from each country; the amount of commuters from Sweden to Denmark is consistently a vast
6The Öresundsdatabasen is an open database with border regional statistics for the Öresund region that contains
comparable, harmonized and unique cross-border statistics. It was built thanks to European Interreg funds: Örestat I, Örestat II and Örestat III, which ended in 2013. See http://www.orestat.se [13/04/20]
7 Öresundsdatabasen defines the Öresund Region as an area comprising all the municipalities in Skåne, Region
Hovedstaden and Region Sjælland. See http://www.orestat.se/sites/all/files/sb_geo_uk_endelig.pdf [13/04/20]
8The units of the statistics are commuters and income recipients. Commuters are Danish residents and whose
primary job (in November) is situated in the Swedish part of the Öresund Region or conversely. Income recipients are persons who have a secondary job or who have earned income during the year in the other country. See
http://www.orestat.se/sites/all/files/comparability_study_comuters_in_the_Öresunds_region_uk_2015.pdf [13/04/20] 0 5000 10000 15000 20000 25000 30000 1997 1998 1999 2000 2001 2002 2003 2004 2005 2006 2007 2008 2009 2010 2011 2012 2013 2014 2015 From SW to DK From DK to SW
majority of the total commuters. The factors of this trend are varied, and includes Danes moving to Skåne to take advantage of cheaper housing while retaining their job in Denmark, and Swedes attracted to the labor market and work conditions in Denmark (Nauwelaers et al., 2013).
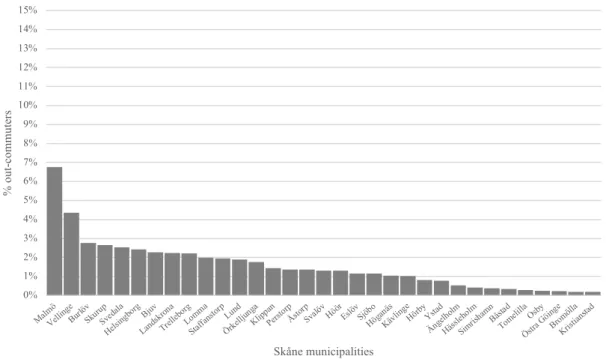
In 2015, the last year with full-year data available9, there were over 18,000 regional commuters in the Öresund. A vast majority (91%) of the cross-border commuter went from Sweden to Denmark. However, even in the areas with more cross-border out-commuters–Malmö, Helsingborg or Vellinge–, they slightly represents 3-7% of the total employed residents (see figure 5).. This numbers are away from the 15% threshold stablished by the OECD, therefore Malmö might be considered more a core of its own region than a hinterland of Copenhagen.
Figure 5. Share of out-commuters from Skåne to the Danish part of the Öresund Region, by municipality (2015)
Source: own elaboration from Öresundsdatabasen.
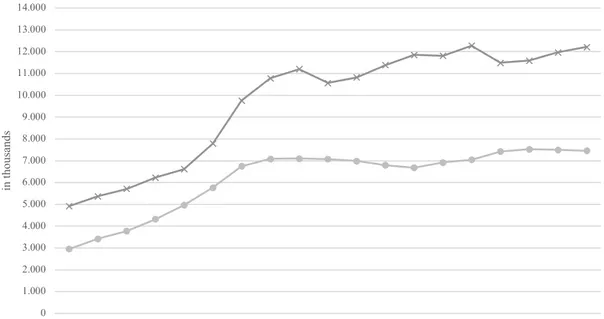
Total mobility flows –registered commuting plus others such as cargo, tourism, etc.– is also be relevant to grasp the level of integration of the region. In 2019 over 12 million train passenger and 7.5 million vehicles crossed the bridge. The trend has been clearly positive since the opening of the bridge showing the key relevance of this infrastructure for the Region.
From these data it is also clear that cross-border commuting is especially sensitive to particular events and crises. For instance, the 2008 crisis clearly affected the number of cross-border commuting flows. Also, ID checks and border controls introduced in 2014 due to the refugee crisis prolonged travel time resulting in fewer rail-way passengers from
9The last data available is from 2015 since the data exchange between Sweden and Denmark meet some problems that
still persist. 0% 1% 2% 3% 4% 5% 6% 7% 8% 9% 10% 11% 12% 13% 14% 15% Malm ö Vellin ge Burlö v Skuru p Sved ala Helsi ngbo rg Bjuv Land skron a Trell eborgLomma Staffa nstor p Lund Örke lljung a Klipp an Perst orp Åstor p Svalö v HöörEslövSjöbo Höga näs Kävli nge HörbyYstad Änge lholm Hässl eholm Simris hamnBåsta d Tome lillaOsby Östra Göing e Brom ölla Krist iansta d % ou t-co m m ut er s Skåne municipalities
2015-2016 but a rising in car travels over the bridge10. More recently, the COVID-19 pandemic and the restrictions introduced in both Denmark and Sweden has reduced in 60-70% the rail-way and car travels in the bridge during spring 202011, and it will probably have long-term effects in the Region.
Figure 6. Volume of rail-way passengers and vehicles* at the Öresund bridge (2001-2019)
*Includes: cars, MC, minibus, coaches and trucks and vans from 6m. Source: own elaboration from Øresundsbron.
Yet, despite the processes of globalization and European de-bordering has favored cross-border flows of goods, capital and people, it is also true that cross-borders still represent important barriers to commuting flows (Greve & Rydbjerg, 2003; Schmidt T. , 2005). Even the most favorable contexts for the free movement of workers such as the European Union and the Schengen Area face specific difficulties that adds costs to cross-border commuting.
In regions such as the Öresund, in which socio-economic and cultural differences are relatively low, and there are long-standing cooperation agreements, there are still important barriers that favor immobility. The most relevant ones: time and transport costs12, language, and lack of information/transparency about the consequences of commuting in terms of taxes, benefits, pensions, etc. (Greve & Rydbjerg, 2003; Löfgren, 2008).
In sum, both physical and non-physical barriers to commuting makes it difficult to define cross-border urban areas in the same terms by the thresholds described above. In this sense, authors like Schmidt (2005) suggest that in terms of identifying cross-border metropolitan regions, cross-border commuting cannot be compared to commuting patterns in a domestic context.
10See
https://www.Öresundsinstituttet.org/fact-sheet-the-effects-of-the-id-and-border-checks-between-scania-and-zealand/ [19/04/20]
11See https://www.Öresundsinstituttet.org/fakta-pendlingen-over-sundet/ [19/04/20]
12The train route between Hyllie and Copenhagen Airport is one of the most expensive in Europe. See
https://www.thelocal.com/20181205/oeresund-commuters-protest-10-percent-fare-hike [13/04/20] 0 1.000 2.000 3.000 4.000 5.000 6.000 7.000 8.000 9.000 10.000 11.000 12.000 13.000 14.000 2001 2002 2003 2004 2005 2006 2007 2008 2009 2010 2011 2012 2013 2014 2015 2016 2017 2018 2019 in th ou sa nd s
The Region might be then defined by a cores-peripheries configuration. The main core is Copenhagen, with 40% of the population and a great majority of the in-commuting flows in the whole region. But there are also core-periphery relations in other areas of the region –i.e. Malmö-Lund as the core of western Skåne region. In this sense, it is also relevant to understand the Öresund Region as a multilayered urban system with multiple cores. Some authors argue that a single urban core can be substituted by multiple cores, creating a polycentric urban region (Parr, 2004; Rodríguez-Pose, 2008; ESPON, 2010). Polycentric urban regions can be simply defined as “a set of neighboring but spatially separate urban centers, existing as some identifiable entity” (Parr, 2004, p. 231). An “identifiable entity” might be delimited by a maximum distance between the centers (Bailey & Turok, 2001) or by high levels of economic interaction and specialization (Parr, 2004). Hence, the Öresund Region might be understood as a polycentric and multilayered cross-border metropolitan region formed by a regional core, Copenhagen, and sub-cores, Malmö-Lund and Helsingborg13 (see table 4).
Table 4. Öresund urban region
N municipalities Population 2019 % population
Copenhagen area 37 2,209,139 68.2 Core 17 1,332,152 41.1 Hinterland 20 876,987 27.1 Malmö-Lund area 14 767,780 24.7 Core 2 464,297 14.3 Hinterland 12 303,483 9.4 Helsingborg area 6 264,531 8.2 Core 1 145,968 4.5 Hinterland 5 118,563 3.7 Total 56 3,241,450 100.0
Source: own elaboration.
From this perspective, the Öresund metropolitan region cannot be seen solely by the relation between the regional core and hinterlands, but by multilevel ties between diverse urban cores and their hinterlands. That is a metropolitan region with 3.2 million inhabitants, almost 20% of the combined population of Sweden and Denmark, the most populous in the Nordic countries14.
As Nelles & Durand (2014, p. 106) argue, cross-border metropolitan regions are particularly relevant to the because functional integration presents governance challenges
13I include Helsingborg in this definition since it is key in both the relations between Skåne and Denmark in northern
Öresund as well as part of the urban continuum in Skåne’s western coast. However, in the diverse definitions of the urban areas, the urban continuum between Malmö area and Helsingborg’s is broken by Landskrona (pop. 46,090), despite being the 6th most populous municipality in the region and highly dense (2,500/km2). Data suggests that this break in the urban continuum has an explanation in the data analysis, but it is not very accurate when it comes to explain commuting flows. Landskrona is a municipality with a high share of out-commuters (48%) but they have split destinations, mainly between Malmö and Helsingborg (OECD, 2012. Territorial Review: Skåne). This has an effect over the delimitation of urban areas in Skåne, which I suggest to include Landskrona and Svalöv (pop. 14,268) as part of a urban continuum going form from Skurup to Höganäs.
simultaneously across a wide variety of policy areas that necessitate some form of coordination, typically involving a combination of local political authorities across national boundaries.
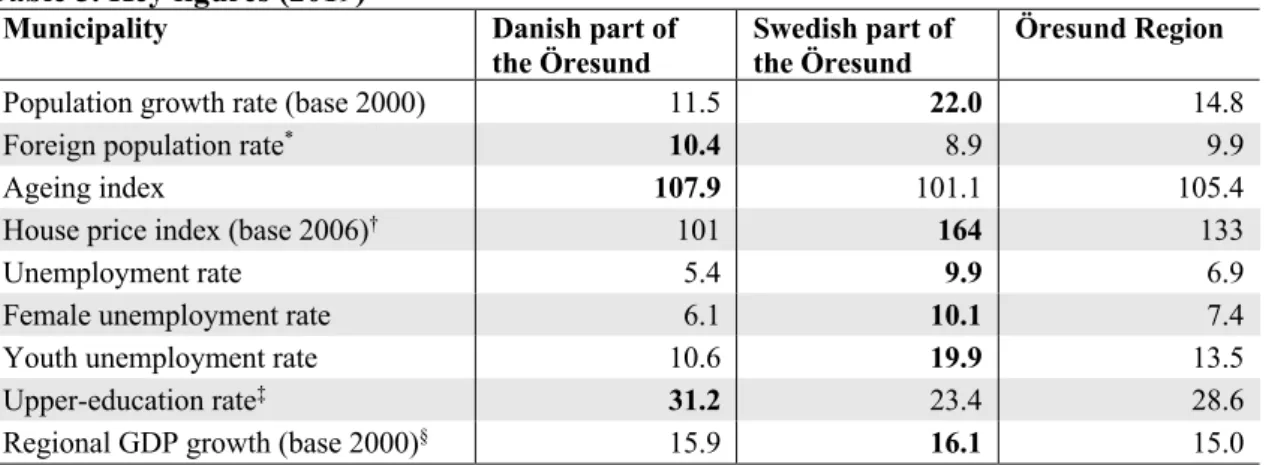
In this sense, metropolitan governance in cross-border regions may take a particular end in which integration is crucial. Integration is understood as the process of reduction of structural differences–social, political, economic, cultural–between the territories. Decoville et al. (2010) for instance identify indicators of cross-border integration, including the most used commuting, but also GDP per capita, mobility and migration or language differences. To reach a more complete view, I include here other socioeconomic variables (see table 5).
Table 5. Key figures (2019)15
Municipality Danish part of
the Öresund
Swedish part of the Öresund
Öresund Region
Population growth rate (base 2000) 11.5 22.0 14.8
Foreign population rate* 10.4 8.9 9.9
Ageing index 107.9 101.1 105.4
House price index (base 2006)† 101 164 133
Unemployment rate 5.4 9.9 6.9
Female unemployment rate 6.1 10.1 7.4
Youth unemployment rate 10.6 19.9 13.5
Upper-education rate‡ 31.2 23.4 28.6
Regional GDP growth (base 2000)§ 15.9 16.1 15.0
*By citizenship (different from Danish or Swedish). † For one-family house, data from 2018.
‡ Data from 2018
§ Regional GDP per capita, 2000-2016.
Source: own elaboration from Öresundsdatabasen.
The Swedish part of the region has traditionally presented higher levels of unemployment–especially among women and youth–, less educated population, and poorer levels of economic performance (see figures 7 to 14). However, in the last decades Skåne has experienced some relevant changes. Its growth in terms of population almost doubled the Danish. The demographic structure has also changed. Particularly, ageing has been one of the main demographic trends in all the Nordic countries, and one major future challenges in the whole region (Nordregio, 2020). In the Öresund Region, nowadays Denmark has a larger ageing population than Skåne (see figure 8).
Also GDP growth has been slightly higher in the Swedish part, even though the GDP differences are still significant between the two regions (see figure 14). However, while GDP is the most commonly used indicator for measuring and comparing economic performance it is an increasingly discussed indicator for it does not take into account variables such as substantiality or inequalities of such economies. Thus, beyond GDP there are a diversity of other indicators and indexes that measure human and economic development. Since 2016, Nordregio proposes the Regional Potential Index (Nordregio, 2016). RPI includes nine socio-economic indicators relevant to the analysis of regional development including the share of urban population, migration rate, education and
15For comparative reasons I use data from Öresundsdatabasen which defines the Region as Skåne, Hovedstaden and
employment or R&D investment per capita. In 2019, Hovedstaden ranked 2nd and Skåne 24th among 66 regions in the Nordic countries (Nordregio, 2020).
In the last decade there is also an increasing inequality trend that has affected the Öresund Region and the Nordic Region as a whole. In particular, income inequalities have grown more in Denmark, specifically in Copenhagen and its suburbs, but it also remains high in Swedish cities such as Malmö, Helsingborg, Lund and Vellinge (Nordregio, 2020). Moreover, since the opening of the bridge many Danes working in Copenhagen find the Swedish part of the region attractive to live in. In the period 2000-2007 many people moved from Denmark to Skåne (see figure 9).
These patterns have been described by Decoville et al. (2010) as a model of integration
by specialization, in which cross-border commuting from the periphery to the core is
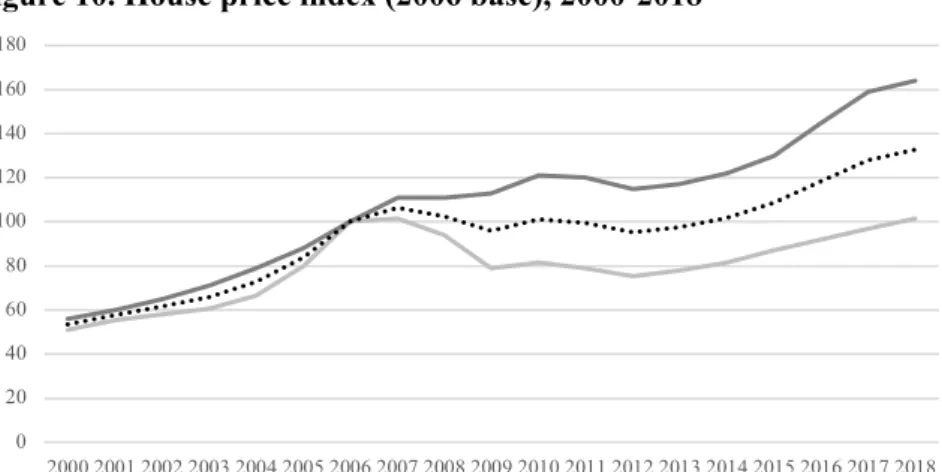
combined with opposing residential flows. A trend that was rapidly countered by the 2008 crisis but some side effects persisted. The housing market integration is one of the most relevant effects of metropolization at the cross-border scale, with particular effects in the Swedish side: the house price in Skåne is experiencing a more accentuated and rapid growth than in the Danish side, a growth that has endured even after the financial crisis (see figure 10).
In a context in which borders still represent barriers to mobility, cross-border metropolitan regions have to be understood from multiple perspectives. That is, mobility and integrated markets are important but not the only factors; there are other sociopolitical factors of regional building. For instance, integration patterns, imagined spaces, institutional arrangements, policy networks… As we well see in the following sections, the Öresund Region have to be understood from this multilayered perspective (see different approaches to the Öresund as a metropolitan region in Maskell & Törnqvist, 1999; Wichmann Matthiessen, 2004; Schmidt, 2005; Hospers, 2006; Löfgren, 2008; Decoville, et al., 2010).
In sum, for the analysis of metropolitan governance in the Öresund Region I take an extensive, polycentric and multilayered definition of the metropolitan region. This definition includes the core area of Copenhagen, and the Swedish areas of Malmö-Lund and Helsingborg. For this, the identification and analysis of metropolitan governance in this paper takes into account the institutions, entities and networks that operate at the national level, both in the Copenhagen and in Skåne, and the ones between them.
Figure 7. Population growth rate, 2000-2019
Source: Öresundsdatabasen.
Figure 9. Migration inside the Öresund region, 2000-2019
Source: Öresundsdatabasen.
Figure 8. Ageing index, 2000-2019
Source: own elaboration from Öresundsdatabasen.
Figure 10. House price index (2006 base), 2000-2018
Source: own elaboration from Öresundsdatabasen.
0 5 10 15 20 25 2000 2001 2002 2003 2004 2005 2006 2007 2008 2009 2010 2011 2012 2013 2014 2015 2016 2017 2018 2019
Danish part Swedish part Oresund Region
0 1000 2000 3000 4000 5000 6000 2000 2001 2002 2003 2004 2005 2006 2007 2008 2009 2010 2011 2012 2013 2014 2015 2016 2017 2018 2019
Migration from Denmark to the Swedish part of the Oresund Region Migration from Sweden to the Danish part of the Oresund Region
60 70 80 90 100 110 120 2000 2001 2002 2003 2004 2005 2006 2007 2008 2009 2010 2011 2012 2013 2014 2015 2016 2017 2018 2019
Danish part Swedish part Oresund Region
0 20 40 60 80 100 120 140 160 180 2000 2001 2002 2003 2004 2005 2006 2007 2008 2009 2010 2011 2012 2013 2014 2015 2016 2017 2018
Figure 11. Unemployment rate, 2000-2019 (first quarter)
Source: Öresundsdatabasen.
Figure 13. Female unemployment rate, 2000-2019 (first quarter)
Source: Öresundsdatabasen.
Figure 12. Youth unemployment rate, 2000-2019 (first quarter)
Source: Öresundsdatabasen.
Figure 14. Regional GDP per capita (thousand euros), 2000-2016
Source: Öresundsdatabasen. 0 2 4 6 8 10 12 2000 Q1 2001 Q1 2002 Q1 2003 Q1 2004 Q1 2005 Q1 2006 Q1 2007 Q1 2008 Q1 2009 Q1 2010 Q1 2011 Q1 2012 Q1 2013 Q1 2014 Q1 2015 Q1 2016 Q1 2017 Q1 2018 Q1 2019 Q1
Danish part Swedish part Oresund Region
0 2 4 6 8 10 12 2000 Q1 2001 Q1 2002 Q1 2003 Q1 2004 Q1 2005 Q1 2006 Q1 2007 Q1 2008 Q1 2009 Q1 2010 Q1 2011 Q1 2012 Q1 2013 Q1 2014 Q1 2015 Q1 2016 Q1 2017 Q1 2018 Q1 2019 Q1
Danish part Swedish part Öresund Region
0 5 10 15 20 25 2000 Q1 2001 Q1 2002 Q1 2003 Q1 2004 Q1 2005 Q1 2006 Q1 2007 Q1 2008 Q1 2009 Q1 2010 Q1 2011 Q1 2012 Q1 2013 Q1 2014 Q1 2015 Q1 2016 Q1 2017 Q1 2018 Q1 2019 Q1
Danish part Swedish part Oresund Region
20 25 30 35 40 45 50 55 2000 2001 2002 2003 2004 2005 2006 2007 2008 2009 2010 2011 2012 2013 2014 2015 2016
Metropolitan governance in the Öresund Region
Following Tomàs’ classification of metropolitan governance models–metropolitan
governments, metropolitan agencies, vertical coordination and voluntary cooperation–,
in this section I will present an in-depth description of the most relevant examples of metropolitan governance structures in the Öresund Region. For that I will use the territorial delimitation of the Region presented above, so I take into account both national –in Denmark and Sweden– and transnational metropolitan arrangements.
Metropolitan governments in the Öresund Region
The first general finding is that there are no metropolitan government structures in the Öresund Region, neither cross-border nor national. As part of the Nordic and north European model of local government Sweden and Denmark share several features. Both are highly decentralized countries which give to the local and regional governments a great amount of power and resources. After various waves of municipal reforms and amalgamations starting in the 70’, both Sweden and Denmark have built a territorial model characterized by a low municipal fragmentation–low number if medium-sized municipalities (see table 6).
Table 6. Models of local government and municipal fragmentation
Country Typologies of
local government
Number of municipalities
Total population Municipal fragmentation*
France Franco 36,658 67,848,156 54.0
Spain Franco 8,124 47,329,981 17.2
Germany Middle European 11,313 83,122,889 13.6
Sweden Nordic 290 10,367,232 2.8
Denmark Nordic 98 5,825,337 1.7
UK Anglo 419 66,796,800 0.6
*Number of municipalities per 100,000 inhabitants. Source: own elaboration.
In particular, municipalities are key agents of welfare provision (Hesse & Sharpe, 1991; Bennet, 1993; Heinelt & Hlepas, 2006). They are responsible for a wide range of welfare services, including childcare and primary education, social services and utility services– water and sewer, waste management, etc.–and they have a significant fiscal autonomy in accordance (Sellers & Lidström, 2007). Regions, therefore are weak in terms of authority in contrast to other European regions, but are relevant public services providers, including healthcare and public transport (Schakel et al., 2018; Berg & Oscarsson, 2018). High decentralization has favored the position of local and regional government to develop cross-border initiatives (Greve & Rydbjerg, 2003).
The existence of a low fragmented municipal system in which local governments concentrate a great amount of responsibilities and resources has prevented the creation of metropolitan tiers of government. Instead, it has favored other means to provide metropolitan policies (Lidström, 2005; 2011; Eklund, 2016; Tavares & Feiock, 2018). In Sweden, there has not been a comprehensive metropolitan policy at the national scale. Instead, metropolitan governance arrangements have been developed through “spontaneous and self-organizing attempts dominated by local governments” (Eklund, 2016, p. 1), and most commonly in the form of voluntary cooperation arrangements.