R APPORT
Nr144 A 1978 __ __ Statens vag- och trafikinstitut (VT) - Fack - 58101 Linkoping ISSN 0347-6030 : National Road &Traffic Research Institute Fack S58101 Linkoping Sweden
-Risk exposures
Structuring of the need for risk
exposure
-d A ' |
data for traffic acadent analysis
Nr 144 A - 1978
Statens vag- och trafikinstitut (VTI) Fack - 581 01 Linkiiping
ISSN 0347-6030 National Road & Traffic Research Institute - Fack - S-58101 Linképing - Sweden
Risk exposures
Structuring of the need for risk exposure
data for traffic accident analysis
C O N T E N T S 1. 2. 3. 4. 4. 4. 4. 4. 4. 4. 5. 5.1 5.2 5. 6. 6.4 6.7 VTI # # b e N F -J ABSTRACT BACKGROUND
DEFINITION OF RISK EXPOSURES
METHODS OF DETERMINING RISK EXPOSURES SIMPLE RISK EXPOSURES
Number of movements Number of journeys Number of vehicles
Vehicle mileage
Vehicle mileage differentiated in space
Vehicle mileage differentiated in time RISK EXPOSURES ON LINK ROADS
Vehicle mileage according to free and
impeded traffic on link roads
Vehicle mileage according to traffic situations on link roads
Traffic situations
The need for accident information
RISK EXPOSURES AT INTERSECTIONS Definition of the intersection area
Number of incoming vehicles
Product of incoming vehicles from major
and minor roads
Square root of the product of incoming vehicles from major and minor roads
Other power functions
Traffic streams without regard to direction
Traffic streams with regard to direction
REPORT 144 A Page K D K O C D CD C X ) 12 14 14 16 19 19 21 22 24 25 26 26 27 29
6.8 Traffic streams with regard to the
dis-tribution in time and without regard to direction
6.9 Traffic streams with regard to direction and distribution in time
7. RISK EXPOSURES FROM TRAFFIC STUDIES AT
INTERSECTIONS
8. RISK FACTOR STRUCTURE
VTI REPORT 144 A Page 30 31 32 34
RISK EXPOSURES
A structure of needs of risk eXposures for road
accident analysis
by
Goran Nilsson
National Swedish Road and Traffic Research Institute Fack
8-581 01 LINKCPING SWEDEN
ABSTRACT
In the continuous R&D work, carried out at the National Swedish Road and Traffic Research Institute, different measurements for road accidents are tested in order
to find measurements to be used in different decision procedures, intended to result in measures. The first requirement is that the accident measurements shall allow relevant comparisons between different groups of
road users and/or different road and traffic conditions.
When develOping accident measurements it is essential
to define and to deduce traffic measurements, that show. strong correlations with the number of accidents.
These traffic measurements are called risk exposures.
BACKGROUND
One of the greatest problems in traffic safety research is the lack of information about the traffic. A great deal of traffic safety research is therefore based
solely on information about accidents from the viewpoint primarily of the type of accident and the distribution of accidents in time and space. One of the aims of traffic safety research is to have access not only to data concerning accidents which have happened, but also to the risk factors for traffic accidents in various road and traffic situations. This provides a better basis for assessing the effect of various measures for increasing traffic safety and also for deciding on the measures to be taken. Without information about the
traffic, no such basis for making decisions can be
ob-tained, as the traffic pattern varies constantly in time and space. To use only accident information as the basis for making decisions presupposes that the traffic does not vary in time and space, which in most cases is an unrealistic assumption.
The only traffic statistics which now exist and can,
to a certain extent, be co-ordinated with accident
in-formation is provided by the National Road Board.
These traffic statistics cover essentially the general road network of the rural areas. They are taken over 3 year cycles and result in various estimates of the vehicle mileage on the basis of certain spatial
divi-sions (provinces, road categories). The Road Board also carries out continuous traffic calculations, on
a per hour basis, at some 80 randomly chosen points on the national road network for estimations of the variation of the traffic in time. Traffic calculations of the type described above have been utilized at
various times in the Research and DevelOpment work
for estimations of the vehicle mileage on individual
road sectors and also for the distribution cf the
traffic in time and space.
Besides the above mentioned traffic calculations, occasional traffic calculations, were carried out in
conjunction with the change over to driving on the right and in tests with speed limits during holiday periods in the early sixties, whereby the vehicle
mileage per day (24 hours) was obtained for various categories of road.
By relating the number of accidents defined in time and space to the vehicle mileage for the corresponding temporal and spatial division, a risk factor is
ob-tained. This risk factor is usually called the accident rate,
In working out the risk factor, it is essential to
de-fine and derive traffic indices which display a marked correlation with the number of traffic accidents which happen. These traffic indices will be referred to in the following text as "risk exposures". The vehicle mileage in the above example is an example of a risk exposure.
DEFINITION OF RISK EXPOSURES
From the above mentioned risk eXposure "accident rate"
number of traffic accidents
vehicle mileage (million axle pair/km)
accident rate =
We can define the risk factor in a more general way as
the number of "undesired events" in the traffic
' jskeaqoanx
risk factor =
The reason for using the term "undesired events"
in-stead of traffic accidents is connected with other possibilities of measuring traffic safety. An example of this is the recording of conflict situations, i.e. traffic situations which, in the way they work out, display a great similarity with traffic accident
situa-tions.
The risk exposure may consist of events which are de-scribed by defined traffic situations, the number of
vehicles, the number of road users, the vehicle
mileage expressed in vehiclekm or personkm and also the transport load expressed in tonkm.
By relating "undesired events" to a risk exposure, a normalized risk factor is obtained. The risk factor can then be used to compare the risk of the "undesired event" happening in various road and traffic situations, provided that:
o the "undesired event" and the risk exposure are well correlated, i.e. there must be an approximate pro-portional relationship between the number of
"un-desired events" and the magnitude of the risk ex
posure
o the risk exposure is not affected by the milieu or by themeasures to be compared
The foregoing can be exemplified as follows. Assume that the number of accidents sustained by passing
vehicles, the number of vehicles passing each other
and the vehicle mileage are known quantities in a given road and traffic milieu during a certain period of time and introduce the following symbols:
= number of passing accidents = number of passings
= vehicle mileage
= number of passing accidents/number of passings = risk eXposure
= number of passings/vehicle mileage
H E S S B K D H E? O
The latter ratio % alone does not constitute a risk
factor, but it can be defined as a traffic index, while
the former ratio % is defined as a risk factor where the risk exposure is the number of passings. This view-point can be expanded to embrace products of ratios. Consider
O m
m X T PO
where the risk factor % multiplied by the traffic index
m gives the original risk factor, the accident rate.
T O O
This means that, if we know 5, T can be determined from the calculation of %.
METHODS OF DETERMINING RISK EXPOSURES
As a first approach, one might consider dividing the traffic process up into events which might result in traffic accidents. It is desirable that these events should be discrete and definable. A risk exposure which meets these conditions is all the events which represent each individual movement in the road traffic system. The movements can be differentiated according to type of journey, road user category etc. The next step may be to define journeys as events in the traffic process,
in which journeys can be regarded as the sum of several movements.
Each movement or journey can also be characterized in terms of length, which is directly related to the de finition of vehicle mileage. Hence, a certain vehicle
mileage can be associated with the above mentioned events
in the traffic process.
In the next step, the vehicle mileage (length) for the movement or journey is differentiated in time and space
and in this way we obtain another type of division of the above mentioned events. The purpose of the various
divisions is to obtain events which are as homogeneous
as possible, i.e. they occur under similar conditions. The last step in the division of the above mentioned events is a division with respect to the traffic. By relating traffic accidents which have occurred in conjunction with the defined events in the traffic,
expressed as a number or in traffic load, various risk
factors can be obtained. Of the methods which have been used so far, a few types can be mentioned:
Collection of data concerning all journeyS'Kmove--ments) having regard to type, method of travel and
length during a given period for individualfvehicles.
The data colleCtion methOd requires surveys or
-interviewing pr0cedureSi3 -
'
~Two examples of such investigations are the
Travel
survey in the region of Stbckholm" (TU 71) and the"Studded tires. Effect OHEaCCidents" Report No. 7? VTI 1976:; In these cases: estimates of vehicle
mile-'age, among other things, were obtained from these
investigations. However, it is only in conjunction
With the "studded tires" investigation that the
estimates obtained were used as risk exposures. Recording of the presence of vehicles in time and space with the aid of traffic calculations at various points on the road network. The distribu tion of the vehicle mileage in time and space can be obtained from these traffic calculations. The
method is restricted to motor vehicles.
An example of this type of investigation is the continuous traffic calculations carried out by the
National Road Board. However, in most cases, the information obtained concerning the traffic is not
primarily intended to constitute risk exposures
for the determination of risk factors in the traffic.
However, the Road Board's traffic statistics are
at present the source of information which covers
the widest area and can be used, without major
difficulties, for the determination of risk
expo-sures, in the form of vehicle mileage, differentiated
in time and space.
In the two methods described above, no detailed
description of the traffic process is obtained, i.e.
information is lacking concerning the traffic con ditions under which the journey or movement was made.
a A method which gives these possibilities is traffic simulation. By knowing the traffic distribution in time and space, parts of the traffic process can be described by the technique of simulation. This means that these are possibilities of describing
the traffic in the form of the number of overtakings,
the number of passings etc. in a given road and traffic milieu during a given period from various input data concerning the occurrence of the traffic in time and space. The simulation method is parti-cularly suited for describing traffic conditions
on link roads sectors of road between crossings
as there is no practical possibility of obtaining such information by direct traffic observation. 0 As regards the traffic conditions at crossings, on
the other hand, it is possible to obtain, by direct traffic studies, detailed information concerning
the traffic process. Here it is possible to select various types of recording technique. It may be of a simple or complex nature. An example of a simple recording technique is observers whereas recording on film or videotape is an example of a more complex recording technique.
SIMPLE RISK EXPOSURES Number of movements
Each movement in the road traffic system may, with a certain probability, result in a traffic accident. It is therefore possible to regard the number of movements as risk exposures and to define the accident factor
number of accidents number of movements
The accuracy of the accident factor is determined by the possibility of differentiating between accidents
and movements according to milieu, method of travel,
road user category, length of movement etc.
In this context, the accident information constitutes
at present a considerable limitation, as information
concerning the actual movement or journey is lacking in the traffic accident statistics.
Number of journeys
By adding all the movements carried out in connection with a single journey a new risk exposure, the number of journeys, is obtained. The corresponding accident
factor is then
number of accidents
number of journeys
The risk exposure "number of journeys", like the number
of movements, is in many respects too vague a figure
to provide an explanatory value for the incidence of
accidents.
Number of vehicles
Quite a different type of risk exposure is the number of vehicles. This risk exposure can be expanded to
include all traffic elements. This type of road user
information can be used as a risk exposure at crossings
in the form of the number of vehicles in various traffic streams.
Vehicle mileage
The risk exposures, the number of movements or the
number of journeys have so far been little used in traffic accident analysis, partly because a knowledge of this kind of risk exposure is lacking. The risk exposure most frequently used is the vehicle mileage. The vehicle mileage also provides a considerable expla-natory index for the incidence of accidents. As regards motor vehicle traffic accidents, the relationship
be-tween the number of accidents and the magnitude of the
vehicle mileage is often so great that it can be re-garded as prOportional. This means that the number of
accidents increases with the magnitude of the traffic.
This is frequently an overlooked fact, with the result that the decision makers frequently find the current accident statistics confusing or difficult to interpret.
YsEESls_92ls§3§_§i§§§£§922§2s§_;§_§929s
By differentiating the vehicle mileage in space according
to road milieu, type of settlement, state of the road etc., it has been found that the accident rate (number of accidents/vehicle mileage) varies considerably. It
is primarily this kind of risk exposure which is used in the traffic safety investigations. It thus applies
primarily for motor vehicle accidents and vehicle mile
age in terms of car mileage. The reason why the re
search in this area has been comparatively successful
is access to this type of traffic information. Figure 1 shows the accident rates on sectors for various road width classes. Figure 2 shows the accident rates per
region, state of the road and light conditions.
lO
ACCIDENT RATE TWO LANE HIGHWAYS
OLYCKSKVOT-TvAr- ALTSVAGAR
(Pix STRACKOR)
(STRETCHES)
Q6 \05 04 Q3 02 Q1
WIUI H
-VAGBREDD:
67
68-72
73-77 78- 87
88 107 108-127
128-(DM)Fig. 1. Accident rate for accidents on
stretches with speed limit 90 km/h for various road widths (1972-1974).
ll
80 ACCIDENT RATE
OLYCKSKVOT
10 I an NOrUExni m en NORDSVERIGE 5,0 4 Camxalsheda1 4,0 «- MELLAN-SERBE 3.0 - SYDSVERIGE I Sm ilSmxbni.f'i
bndition of road: no snow no snow ice/snow ice/snow
.ight conditions: daylight dark daylight dark
Fi . 2. Accident rate under various road and light
conditions in north, central and south Sweden (1973).
.4.
4.0 i
33 d 2.0 10 12Yshigls_mils§9§_Qi££§£§22i§2§§_i§_2i@§
The possibilities of differentiating the vehicle mileage in time from corresponding information have hitherto
been very limited. Rough estimates of the vehicle
mile-age distribution in time have shown that the accident
rates reveal a substantial variation in time, in
parti-cular as regards the factors of light conditions and
state of the road as well as time of day. Figure 3 shows the variation of the accident rates with respect to time of day and weekday and Figure 4 shows the vari
ation of the accident rates during the year.
ACCIDENT RATE
OLYCKSKVOT
weekdays Fridays Saturdays Sundays VARDAGAR FREDAGAR LORDAGAR SONDAGAR
Summer (Apn~Sept)
u». SOMMAR (APR.- SEPT.)--vnnER(0KI-MAR5) . Whu£r«x:.%much) I
!
! \.
9.
I \.
\
I \.
\
'
\
/
I .
\
.l
1
J
-
.
-«~uy 0" \ " Ln- J, Time of da/ 'HDPUNKT P DXGNET 04- 08- 12- 16- 20- 00' 04- 08- 12- 16- 20- 00" 04- 08- 12- 16- 20- 00- 04- 08- 12- 16- 20" (1)-081216 20 24 04 081216 20 24 04 081216 20 24 04 081216 20 24 O4Fig.3. Accident rate with regard to time of day and day of week during the summer and winter half years (1973)
V T I R E P O R T 1 4 4 A
Olyckskvot (O/T) Accident rate
1.3 1.2 1,1 1.0 0,9 0.8 0.7 0.6 0.5 0,4 0.3 0.2 0.1 0 Fig. NORRA SVERIGE NORTHERN SWEDEN MELLERSTA SVERIGE CENTRAL SWEDEN
Olyckskvot (O/T) Accident rate 1,3 1'2
F
l,1__ _E L. 0.6 0,7T
1
n..-as...a... no... no-I on... 00-.
J F M A M J J A S O N D J F M A M J J A S O N D SUDRA SVERIGE SOUTHERN SWEDEN
Olyckskvot (O/T) Accident rate
1,3 1,2
1,1 _T
1,0 b0.9 1
0,8 __ . 0,7 t. ._.f 0.6 __ 0,5 t 0,4 0,3 0,2 0.14. Accident rate for total accidents and accidents involving injuries per region and month.
D All accidents @ Accidents involving injuries to persons
J F M A M J J A S O N D
l4
RISK EXPOSURES ON LINK ROADS
Differentiation of the vehicle mileage has hitherto
only taken place in the form of a description of the
composition of the traffic in fairly large regions during
limited periods of time. The "Studded tires"-investiga-tion gives, for a two month period, estimates of the vehicle mileage distributed over days (24-hour periods), tire equipment, type of vehicle etc. On the other
hand, no finer differentiation in space has been pos sible.
In what follows, we shall deal with risk exposures
which are differentiated into time, space and traffic and which link up with the information which can be obtained by means of traffic simulation on link roads,
i.e. sectors of road between crossings.
Vehicle mileage according to free and impeded traffic
on link roads
According to an earlier description, a vehicle mileage
can be attributed to an event in the traffic process.
One division of the traffic is such that the vehicle mileage is differentiated into free and impeded traffic.
The background is that the predominating type of acci dent in the current accident statistics is the single
accident. In many cases, multi vehicle accidents be-gin as a single vehicle accident and finish as multi vehicle accidents. As regards single accidents, it is therefore a difficult matter to define the traffic situation to be considered in conjunction with the
accident.
Results obtained from the investigations which have
been made show that the prOportion of single accidents
among all vehicle accidents decreases when the traffic
flow increases, while the prOportion of multi vehicle
15
accidents increases. The same applies also to the pro-portion of free and impeded traffic respectively.
If it were possible to divide the vehicle mileage into
free and impeded traffic, the following risk exposures would be obtained
Accident rate for = number ofsingle accidents single accidents free vehicle mileage
ami
Accident rate for number of multi-vehicle accidents HMlti-vehicle accidents impeded.vehicle mileage
If we know the accident rate for single accidents according to the above equations, the rate
free vehicle mileage
total vehicle:mileage
can be used as a traffic index for predicting the num ber of single accidents. The same applies also to
multi-vehicle accidents. In this connection, it is of
interest to study how the accident rate single acci-dents/total vehicle mileage can be broken up as the
product of single accidents/free vehicle mileage and free vehicle mileage/total vehicle mileage.
Single accidents Free veh, Haleage _ Single accidents
Free vehicle mileage Total veh. ndleage Total veh. mdleage "Free vehicle mileage" has been used here as the risk exposure in the first ratio, but as traffic information in the second ratio. For the foregoing to be possible
it is necessary to define free and impeded vehicle mileage respectively. This definition is dealt with
in a later section.
Time
16
Vehicle mileage according to traffic situations on
link roads
Multi-vehicle accidents are considerably simpler to characterize into various types with respect to the course of events. The most common types of accident in this category are those which occur during passing,
overtaking, overtaking and passing, swerving and at intersections. The first three types of accident will
be dealt with first.
The traffic situations which constitute the prerequisites for these three types of accident are described in a
road/time diagram of vehicle movements on a given road section.
PASS M TE
OMK RNING
OVERTAKE & PASS UPPHINNANDE
OVERTAKE
VTI REPORT 144 A
17
From a knowledge or assumption of various vehicles' times of arrival at various points on the actual road section, the number of overtakings for passing, passings
(encounters) and overtakings can be obtained. As the total vehicle mileage constitutes an overall descrip-tion of movements on a given road secdescrip-tion, it may be of interest to study how the impeded vehicle mileage can be divided up over the aforementioned traffic situations. However, the term "free vehicle mileage" already requires definition. In the following section, proposed definitions are given for a number of vehicle mileage terms as components of the total vehicle mile-age. To tackle this problem, the condition of each individual vehicle with respect to the surrounding
traffic is characterized as follows:
FO = free vehicle overtaking to pass F5 = free vehicle not overtaking to pass
F
= non-free vehicle
Hp = impeded vehicle being passed
H5 = impeded vehicle which is not being passed
-
= unimpeded vehicle
M = vehicles passing each other from Opposite directions
M = vehicles not in "M" situation
To define free vehicle = "free traffic", it follows from the connection with single accidents that the
in-fluence of other traffic shall not be present. The vehicle condition which should be related to single
accidents is {F50 n D71}. However, the vehicle con-dition {F51Q(HPLIH§)FIM} which includes the leading
vehicle should be referred both to single accidents and multi-vehicle accidents. The following table shows the combinations and the traffic situations to which they are referred.
18
Traffic condition for individual vehicles related to the following types of accidents: single-vehicle,
passing from Opposite directions, overtaking and passing
and overtaking without passing.
M M FO Fo F F0 F5 F -Hp 0 0,5 0 0M M,oM oM H5 0 S,U U oM M,UM UM H o s U oM M UM = single accidents
= accidents while passing from Opposite directions accidents sustained while overtaking and passing
( 3 0 3 0 ' ) I
= accidents sustained while overtaking without passing
XM = accident with passing traffic
If it were possible to characterize, on the basis of
the accident information, the vehicles involved accord-ing to the foregoaccord-ing table, a considerably better acci-dent classification would be obtained. However, for
the time being, the simple classifications of single,
overtaking and passing, overtaking without passing and
passing from Opposite directions ought to be adequate. By calculating the vehicle mileage for individual
vehicles under various conditions, the vehicle mileage
can be distributed over risk exposures which will
19
late to the above mentioned types of accidents.
Traffic situation
To calculate the number of traffic situations of various
types is an easier way to obtain risk exposures which
relate to accidents in which several vehicles are in
volved. In connection with the accident statistics, it is overtaking situations and situations involving
vehicles passing from Opposite directions that are of interest. This type of traffic situation can be ob tained most simply from a knowledge of the entrances and exits on a section of road and the order of
pre-cedence of the vehicles at the entrances and exits.
The traffic situations can be regarded as traffic
in-formation which come very closeto accidents with a view to the type of accident. It is therefore of great importance to be able to define traffic situations
which are correlated to a particular type of accident.
The aim here is to find, from traffic situations of a
certain type, such traffic situations wherein the majo rity of the accident-explaining factors are represented, but where no accident occurs. This type of traffic
situation can be characterized as a conflict situation.
In most cases, the definition and recording of conflict
situations would probably call for direct observation
of the traffic.
The need for accident information
In the description of the differentiation of the
vehicle mileage in terms of traffic, the type of
ve-hicle and the speed of the veve-hicles were not dealt with. The risk exposures which have been dealt with are
primarily simple risk exposures.
20
As regards types of vehicles and speeds, the simple risk exposures can be used to build up cumulative risk exposures, e.g. pairwise produCts of vehicle mileage for the categories of vehicles or road users involved. Even the simple risk exposures make demands on the current accident information over and above the infor mation presently accessible. This applies primarily
to:
0 type of journey 0 length of journey
a description of the condition of the vehicle with respect to the rest of the traffic in the event
of an accident.
21
RISK EXPOSURES AT INTERSECTIONS
Risk exposures which can explain accidents at inter sections have not been dealt with in the foregoing. Some of the risk exposures which have been discussed, primarily free and impeded vehicle mileage, can be re-garded as applicable to intersections. As regards the types of accidents, in this case, the following rough
categories can be considered
a Multi-vehicle(or multi part)accidents
0 Single accidents
For multi-vehicle accidents at intersections which can be related to impeded vehicle mileage, however, the
traffic situations are more complicated to describe
than accidents on stretches of road.
In a general way, it can be said that straight two
lane stretches of road are characterized by the presence of vehicles in two streams moving in Opposite directions, where collisions may occur in each stream or between the two streams. In the case of a three way intersection, the traffic conditions in the intersection may be char acterized by the presence of vehicles in six traffic streams and four-way intersections by the presence of vehicles in twelve traffic streams. Apart from
over-taking and passing situations, the two traffic streams on straight road are directed to their own lanes,
whereas the traffic streams at intersections, with a
few exceptions, constitute a common part of the area of
the intersections.
Dividing the traffic coming into an intersection into
traffic streams also gives rise to traffic situations which may result in accidents, particularly due to
swerving and overtaking. This means that there is an
area of influence where accidents can happen close to
22
intersections on the surrounding roads.
Accidents can also happen when a vehicle is leaving an intersection when traffic streams from different
direc-tions flow together.
Definition of the intersection area
The intersection area can be defined in various ways.
Some alternatives are indicated in the following figures.
\
\
\
_ W '/
7/
W
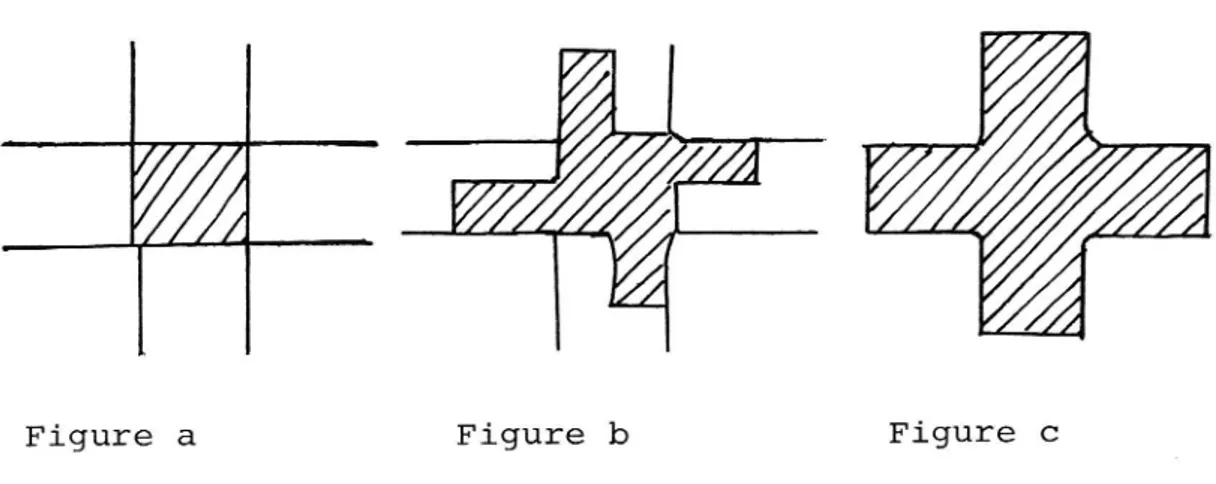
Figure a Figure b Figure c
Figure a represents the area which contains accidents which have only occurred in the actual intersection. Figure b represents the area which contains accidents which have occurred in the intersection and in the approach to the intersection.
Figure c represents the area which contains accidents which have occurred in both the approach and the exit
from the intersection and within the intersection.
The intersection area itself can accordingly be divided into areas which are common for pairwise traffic streams.
23
For a traffic situation between vehicles in different
traffic streams to occur, it is necessary that the ve
hicles should be simultaneously situated in the inter-section area common to the vehicle streams. This can be illustrated by means of a road time diagram for the
two traffic streams.
l)
g 2)L
.
H
orsnin s- m r a //6/ v --2... g
%/}//)%S/ 2}?
\
A m
time
l)intersection area 2) common intersection emeaBesides collisions between vehicles from different traffic streams or within one and the same traffic
stream, single accidents and also accidents between
vehicles and unprotected road users occur at inter
sections.
24
As regards single accidents, free vehicle mileage can be used, but in this case, the vehicle mileage is
re-placed by the number of "free" vehicles i.e. vehicles which are not affected by other vehicles. Accidents involving unprotected road users can be treated in the same way as multi vehicle accidents but, at present,
the supply of traffic information concerning the
un-protected road users is very sparse.
The accident factor or accident rate (the number of accidents per million vehicle km) can be replaced at intersections by the number of accidents per million
incoming vehicles.
In what follows, a structuring of risk exposures which
can be used for intersections will be described.
Number of incoming vehicles
The number of incoming vehicles at an intersection can be estimated from the traffic calculations which are
presently available w a section of the flows from the surrounding roads. An advantage of this risk eXposure factor is that it can be coupled with the accident rate
for stretches of road:
number of accidents millions of vehicles/km
number of accidents
millions of incoming vehicles accident rate for stretches of road =
accident rate for intersections =
As the two definitions reveal, if the accident rate for the surrounding roads is known, the accident rate for
intersections can provide a measure of the length of road to which the intersections correspond in the road system under investigation.
The disadvantage of this risk exposure is that it does not take into account the distribution of the traffic
25
over major and minor roads. Nor is any more detailed distribution of collision accidents justified for coup
ling with the available accident data. In most cases,
it is apprOpriate to use the total number of accidents. Accidents with unprotected road users and animals should,
however, be eliminated in certain cases.
ACCIDENT TRAFFIC
INFORMATION INFORMATION
Total accidents ADT
(l.multi-vehicle) for stretches RISK EXPOSURE k E ADTi/Z l k = l (2.single) = number of (3.unprotected connecting roads road users)
Product of incoming vehicles from major and minor roads
The incoming vehicles from major and minor roads re spectively can be estimated from the ADT estimates
mentioned previously. By comparison with the risk ex posure in the preceding chapter, this risk exposure is affected by how the traffic is distributed over the
major and minor road(s). However, there is still no
information which would provide data concerning the
magnitude of individual traffic streams or the distribu~ tion of the traffic in time. As regards accident in
formation, multi vehicle accidents would appear to be the type of accident which has the most marked correla
tion with this risk exposure.
26
ACCIDENT TRAFFIC
RISK EXPOSURE INFORMATION INFORMATION
2 k ADT
Z ADTpi X Z ADTSj Multi vehicle for stretches
accidents 1 = l
= P S
P denotes major roads S " minor "
§guare root of the product of incoming vehicles from major and minor roads
The two previous risk factors have been found, in many
investigations of intersection accidents, to be too
inaccurate to be applied to empirical accident data in a satisfactory way. A simple modification which has displayed good application to empirical accident cases
on several occasions is VPS
ACCIDENT
INFORMATION TRAFFIC
RISK EXPOSURE INFORMATION
VFE : Pl/ZSl/Z Multi-vehicle ADT
acCidents for stretches
Other power functions
In many cases, other power functions have also been
tested in the form of (PS)a or paSb. In most cases O < a or b < l.
, ACCIDENT TRAFFIC
RISK EXPOSURE INFORMATION INFORMATION
(PS)a
Multi-vehicle
ADT
PaSb accidents for stretches
27
In quite general terms, the risk exposures for inter
«sectiOns can be expressed as a function of major and
minor road traffic (P,S).
Traffic_streams without regard to direction_
From the foregoingtraffic calculation, it is possible
xtO derive the magnitude of various traffic streams.
KnoWing the ADT figures on surrounding stretches, the
magnitude of the traffic streams in a three road'inter
section_can be determined as follows:
A = SAB + SAC = > Derive S B SAB + SBC AB
C = SAC + SBC J
+ = h A B C ZSAB B S :A+B CFor four road intersections, it is necessary to know two
of the six traffic streams in order to be able to deter mine the rest from the four component streams. However,
by making certain assumptions (symmetrical distribution),
a rough estimate of the magnitude of the various traffic streams can be obtained as follows.
Four-road intersection S _ A+B _ C+D
AB 3 6 S : A+C _ B+D AC 3 6 S _ A+D _ B+C AD _ 3 6 S _ B+C _ A+D D BC _ 3 6 S 2E2 BD 3 6 S 2 C+D _ A+B CD 3 6 VTI REPORT 144 A
28
The traffic streams are indicated in what follows by $1; 1 = l,.,3 for three-road intersections and i = l,.,
6 for four road intersections.
ACCIDENT TRAFFIC
RISK EXPOSURE INFORMATION INFORMATION
$1 ¢j Types of accidents Size of traffic
from conflicts stream derived
i,j = l...k i¢j between various from ADT on
traffic flows stretches as above ¢§ Types of accidents " i = l k from conflicts "' within various traffic streams oi Single accidents " = l k in the various "' traffic streams
The above risk exposures can be applied to empirical accident cases with the aid of various power functions
or other functions of the magnitude of the traffic flows f(¢i ¢j).
29
Traffic streams with regard to direction
If we know the magnitude of the traffic streams inde pendently of direction, it may be assumed that, if the investigation period is sufficiently long (in accident analysis, the investigation periods are most frequently one or more years), the distribution in terms of direc-tion within a traffic stream is symmetrical, i.e. a vehicle which passes in one direction returns in the Opposite direction. This gives rise to 6 traffic streams in three-road intersections and 12 traffic
streams in four-road intersections.
In what follows these are denoted with
¢i = $11 + $12 and $11 = ¢i2
ACCIDENT
INFORMATION TRAFFICINFORMATION RISK EXPOSURE
oik x ¢jl Types of accidents ¢i==¢il-+¢iz
i # j involving: ¢ ¢
1. intersection courses with or without left turn
from major/minor
road.
k = 1,2 2. coinciding
l l 2 courses with or
without left turn from major/minor road l...n H . II 2 Types of accidents ik due to conflicts "
within the traffic
stream
¢ik Single accidents
taking account of " direction in the
various traffic streams
30
The above risk exposures make it possible to study various kinds of conflicts between various kinds of traffic having regard to direction, which is of great importance when considering the measures to be applied. Here too the various risk exposures can be adapted to empirical accident material with the aid of various power functions.
In the case of three-road intersections, it is true of
accidents between traffic streams that out of 6
diffe-rent collision conflicts, five contain at least one vehicle turning left. Four road intersections contain
30 collision conflicts 22 of which contain at least
one vehicle turning left.
The foregoing risk exposures can, from the traffic
accident statistics which are available and the number
of accidents which occur in various types of inter
sections, be used in the analysis of accident risks
in various intersection milieux.
Traffic streams with regard to the distribution in time and without regard to direction
The accident risk for accidents between different traffic streams vary per day, week and year. In the risk exposures used previously, the mean flow per year has been used. Knowing the variation in time of the traffic under various traffic conditions and extraneous
circumstances (e.g. daylight/darkness, summer/winter
or different times of the day or night), the risk ex-posures mentioned in chapter 5 can be studied for va
rious time distributions.
31
ACCIDENT TRAFFIC
RISK EXPOSURE
INFORMATION
INFORMATION
¢i ¢j Types of accidents Magnitude of
due to conflict traffic streams between different is derived from traffic streams ADT on stretches divided up accord- and assigned a
ing to time of day variation index day of week and with regard to month various time;
distributions
i,j=l...k i f j
Types of accidents " within traffic streams distribu-ted in time H e- HN = l...k Oi Single accidents " l = l k distributed in "' J timeHitherto only the continuous traffic calculations which are carried out on the national road network have been used in the risk exposures reported here. These will have to be completed eventually to enable the risk ex-posures to be established.
Traffic streams with regard to direction and
distri-bution in time
To indicate, at the same time, how each
direction-differentiated traffic stream is distributed in time requires a completely new traffic calculation system other than the one which now exists. But as the occurrence of accidents between different traffic streams depends entirely on how vehicles in the diffe
rent traffic streams occur in time, it is desirable
to acquire as much of this kind of information as is possible in an accident analysis.
32
RISK EXPOSURES FROM TRAFFIC STUDIES AT INTERSECTIONS
Intersections are very suitable for traffic studies as the actual traffic problem is confined to a limited area. The problem is the recording technique, which can be either simple or complex. A simple recording technique may be used generally and/or used during
long periods of investigation, while a more complicated recording technique can only be used for short periods
of investigation.
An example of a simple recording technique is time-differentiated traffic calculations for various traffic streams. With this, it is possible to meet the
require-ments mentioned in 6.9.
An example of a complicated recording technique is the recording of traffic situations at intersections by filming. The videotape technique used at present is, from many viewpoints, a suitable tool for recording traffic situations which are correlated to certain particular types of accidents at intersections.
The interesting thing about this technique is that it can reduce the original risk exposures ¢i¢j to one risk
eXposure ¢i¢j which simply embraces vehicles in the two different traffic streams which occur simultaneously at the same intersection. The risk exposure ¢i¢j
can then be successively divided up into risk exposures which characterize traffic situations which contain as much as possible 01 a traffic situation which results
in a traffic accident.
At intersections where the traffic consists primarily of motor vehicle traffic (country road intersections), it is probable that, by comparison with intersections in built-up areas where the traffic consists of both
33
motor vehicles and unprotected road users, a mere recording of traffic conflicts would be unrealistic, as this would require very long periods of observation. Therefore the studies should in the first instance be aimed at indicating risk exposures which contain
necessary but insufficient criteria for a defined
con-flict or traffic accident to occur.
Such a criterion is that vehicles in the pairwise in-vestigated traffic streams occur simultaneously in a defined intersection area.
This risk exposure can then be further structured with
a view to a stricter definition of "intersection area"
and/or "simultaneous occurrence".
34
RISK FACTOR STRUCTURE
The following is an example of how different risk fac tors can be broken down into ratios between different traffic indices so that they can be better used as a basis for making decisions concerning measures to be taken in the road traffic system for link roads and
intersections.
The risk factor the accident rate can in principle
be used for measures which change the magnitude of the
traffic. The measures also imply other changes in the traffic process. By breaking down the accident rate into ratios between traffic indices which are affected by the measures, the effect of the measures on the
accident rate can be obtained. The following is a
general example of this. Assume that the example re-fers to a certain type of accident and road user cate-gory in a particular road and traffic milieu.
Number of accidents
NUmber of conflict situations
Number of traffic situations
vehicle Haleagein the traffic situation
Number of conflict situations Number of traffic situations
vehicle mileage in traffic situations Impeded vehicle mileage Impeded.vehicle mileage Total vehicle mileage
Number of accidents
Total vehicle mileage = Accident rate
Each one of these above mentioned ratios can be affected
by different measures. The foregoing is merely an
example of the various possibilities which the described method provides. In principle, the method implies that
it is possible, from a knowledge of various traffic
in-dices "between" accident and vehicle mileage, to obtain
several descriptions of the traffic which can provide
significant information on the measures to be taken for
35
regulating the traffic process in different road and traffic milieux. For intersections, a corresponding structuring can be effected, whereby the vehicle mileage is replaced by the number of vehicles. To
arrive at the resultant injuries to persons for various road user categories and types of accidents in traffic accidents, the foregoing example can be multiplied by Number of injured.persons X NUmber of persons
NUmber of persons Number of accidents Nummarof:n urad;xxsoms
Number of accidents