MULTIDIMENSIONAL ASSESSMENT
FOR A CASE STUDIED ZERO ENERGY
BUILDING
Climate positive buildings with and without connection to the district heating
network
DANIEL RIMEC
Akademin för ekonomi, samhälle och teknik Kurs: Examensarbete i energiteknik Kurskod: ERA206
Ämne: Energiteknik Högskolepoäng: 15 hp
Program: Högskoleingenjörsprogrammet i energiteknik
Handledare: Eva Thorin Examinator: Monica Odlare
Uppdragsgivare: Allan Hawas and Amir Vadiee Datum: 2021-06-10
E-post:
ABSTRACT
The purpose of this report is to get an overview of the CO2 reduction possibilities when adopting different renewable energy source, when the case studied building sustains a district heating network connection and when not, and how the renewable energy source flexibilities (Solar and Wind) differ depending on region. The method regards a ETC house that falls into the climate positive category and assesses the reduction when comparing CO2 emissions form the energy demand. The result for the flexibilities is then compared to the BBR demand. The result shows a difference of around 10% in production for the flexibilities when
comparing the northern and middle region with the southern. And a decrease between 19-36% gCO2. Comparing a scenario with and without a connection to the district heating network showed that when the ground source heat pump offsets the energy demand, CO2, and cost reductions (6 and 4% respectively) can be seen. With an average installation cost, the payback period for the ground source heat pump can be estimated to be around 4 year. In conclusion the thesis project shows that the climate is a ruling factor when assessing energy questions for the residential sector. It also shows the difference in CO2 and cost that comes with it can be reduced and help mitigated the sectors effects on the environment. This in turn shows that the overall reduction of CO2 for the case studied building follows the demands and goals set by the European commission and gives motivation to expand the construction as cost is also reduced.
Keywords: CO2-mitigation, Zero-energy buildings, Climate positive buildings, ETC buildings, Enviro-economic, District heating network, ground source heat pump
FÖRORD
Detta är ett examensarbete på 15 högskolepoäng för kursen högskoleingenjörsprogrammet i energiteknik på Mälardalens Högskola.
Jag vill tacka Allan Hawas och Amir Vadiee för den tid dem har lagt ner för att ge mig råd och förslag till projektet men även för deras enorma tålamod med mig.
Vill även tacka min underbara Mor som alltid peppar när hinder uppstår.
Västerås, juni 2020
SAMMANFATTNING
Bostadssektorn är under stor diskussion då den står för stora mängder av växthusgaser som påverkar miljön. Med detta kommer olika mål, skapad av till exempel medlemsländerna i den Europeiska unionen, dem Förenta staterna mm, för att minska på detta utsläpp. Ett av målen är att reducera byggnadssektors energianvändning, därmed utsläppen till 2050. Detta ska då ske genom införandet av nya lagar som påverkar typen av byggnation, där bland annat renovering av gamla hus eller byggnation av klimatpositiva hus motiveras.
Syftet med detta examensarbete är att få en överblick angående möjligheten att reducera mängden koldioxidutsläpp för olika förnybara källor, när fallstudieobjektet är kopplat till fjärrvärmenätet och när den inte är det, och hur de förnybara källorna (sol och vind) skiljer sig i utsläpp för olika regioner i Sverige. Metoden undersökte ett ETC hus som faller inom den klimatpositiva kategorin och bedömer reducering när CO2 utsläppet jämförs för dem olika energibehoven. Resultatet för dem förnybara källorna som bedömdes och jämfördes med BBR-kraven. Resultatet visar att skillnaden för dem olika regionerna låg på ungefär 10% inom elproduktion när man jämförde nordliga och mittendelarna med den sydliga. Detta medförde också en minskning mellan 19%-36% gCO2. En jämförelse mellan scenariot med och utan koppling till fjärrvärmenätet visa när bergvärme pumpen står för energibehovet minskar CO2 utsläppen samt kostnaderna för elproduktionen (6 respektive 4%). Som slutats presenterar arbetet att klimatet har en stor påverkan på dem avgörande faktorerna (behov, utsläpp, osv) när man bedömer energifrågor inom bostadssektorn. Det visar även
skillnaderna i CO2 och kostnad kommer med denna påverkan och kan anpassas för att reducera och minska på bostadssektorns påverkan på miljön. Detta i sin tur visar att den övergripande minskningen av CO2 för det studerade objektet följer dem kraven och mål som införts av den Europeiska kommissionen och motiverar till att expandera konstruktionen och anpassningen av klimatpositiva byggnader då dem även kan reducera kostnader.
Nyckelord: CO2-reducering, Nollenergibyggnader, Klimatpositiva byggnader, ETC byggnad, Miljö-ekonomiskt, Fjärrvärmenätverk, Bergvärmepump
CONTENT
1 INTRODUCTION ...1 1.1 Background ... 1 1.2 Purpose ... 2 1.3 Problem ... 2 1.4 Delimitations ... 3 2 METHOD ...4 2.1 Literature review ... 4 2.2 Case study ... 4 2.3 Calculations ... 5 2.4 TRNSYS simulations ... 5 3 LITERATURE STUDY ...73.1 CO2 mitigation and energy use in Residential buildings ... 7
3.2 Renewable sources ... 8 3.3 Energy Efficiency ...12 3.4 Zero-energy buildings ...14 3.5 Wooden house ...18 3.6 Methodologies ...20 3.7 CO2 equivalent ...23 3.8 Cost ...23 3.9 BBR ...23 4 CURRENT STUDY ... 24
4.1 Case studied zero-energy building ...24
4.3 Technical ...24 4.4 Simulation ...33 5 RESULT ... 34 5.3 Regions ...38 6 DISCUSSION... 40 6.1 Result ...40 6.2 Method discussion ...42 6.3 Source of errors ...42 7 CONCLUSION ... 44
8 SUGGESTION ON CONTINUING THE WORK ... 45
REFERENCES ... 46
APPENDIX 1: GROUND SOURCE HEATPUMP DATA ... 49
APPENDIX 2: VENTILATION DATA ... 52
APPENDIX 3: SOLAR PANELS ... 54
APPENDIX :4 CLIMATE SCALE ... 56
APPENDIX 5: WALL CONSTRUCTION ... 57
APPENDIX 6: ENERGY CALCULATIONS ... 58
APENDIX 7:EXCEL CALCULATIONS ... 62
LIST OF FIGURES
Figure 1 Primary energy use 2005-2002. ... 7
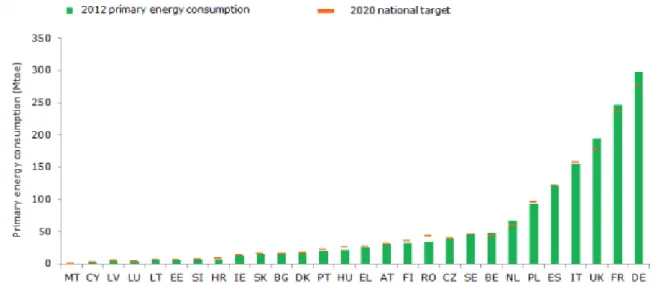
Figure 2 Primary energy use in EU Membered States ... 8
Figure 3 Installed effect in GW, 2013/14 ... 11
Figure 4 NZEB system and element representation. ... 15
Figure 5 Buildings’ energy flow. source: Deng et al. 2014 ... 17
Figure 6 Core methodology of approaching NZEB for EU and US. ...21
Figure 7 Total incident solar energy annually ... 28
Figure 8 Geostrhphic avrage windspeed Northern Europe. ... 29
Figure 9 Solar energy production per region from TRNSYS simulations ... 34
Figure 10 Wind energy production per region from TRNSYS simulations ... 35
LIST OF TABLES
Table 1 Priority order of renewable source for a ZEB ... 10Table 2 List of different ZEB definitions Source ... 18
Table 3 Geothermal heat pump parameters for the hot and cold side ... 25
Table 4 Accumulator tank capacity and type ... 25
Table 5 Expansion vessel parameters ... 25
Table 6 Pump specification ... 25
Table 7 Control valve specification with an acutator ... 26
Table 8 Shunt group specification ... 26
Table 9 Types of system channels ... 27
Table 10 Air handling system parameters and specification ... 27
Table 11 Heating and Cooling coil parameters for the HVAC system ... 27
Table 12 U-Value for different building components ... 29
Table 13 Outer wall construction, layer as the respective material used ... 30
Table 14 Inner wall construction, layer as the respective material used ... 30
Table 15 District heating price ... 31
Table 16 Energy prices based on region for 2021 ... 31
Table 18 CO2 equivalent for the different sources flexiblitities ... 32
Table 19 Total space heating demand for the case studied house and surplus from the energy production. ... 34
Table 20 Effect demand for warm water... 35
Table 21 Effect demand for the radiators heating the living space. ... 35
Table 22 Effect demand for the ventilation ... 35
Table 23 Effect demand for heating, which is the sum of Prad and Pvent ... 36
Table 24 The dimensioned effect for district heating, which is the sum of Pheating and Pww ... 36
Table 25 Space heating demand from TRNSYS simulations ... 36 Table 26 GSHP without DH showing the total heating demand, total electricity demand and
respective CO2 equivalency. ... 36 Table 27 GSHP with 25% heat demand offset and DH, showing Electricity demand for the
GSHP and DH with the respective CO2 equivalency of 76 gCO2/kWh (GSHP), 81 gCO2/kWh (DH). ... 36 Table 28 GSHP with 85% heat demand offset and DH, showing the Electricity demand for the heat GSHP and DH with the respective CO2 equivalency of 76 gCO2/kWh (GSHP), 81 gCO2/kWh (DH). ... 37 Table 29 Regional difference for the source flexibilities solar and wind ... 38
ABBREVIATIONS
Förkortning BeskrivningBBS Building service system BEM Building energy modeling
BBR Boverkets byggregler
CHP Combined heat and power
CCHP Combined cooling, heating and power COP Coefficient of performance
DHN District heating network
DOE Department of energy
EPBD Energy performance of buildings
EU European union
EC Electrochromic
ERP Enterprise resource planning GSHP Ground source heat pump GWP Global warmning potential
HVAC Heating ventilation and air conditioning LCA Life cycle analysis
Mtoe Millions of tonnes of oil equivalent NZEB Net Zero-energy building
NIMBY Not in my back yard
Förkortning Beskrivning
RES Renewable energy source
SC Solar collectors
SDHW Solar domestic hot water heating
ZEH Zero energy home
DEFINITIONS
Definition Beskrivning Greenhouse
gas Gases with the property of absorbing infrared radiation, emitted form earth which is then emitted back to the surface.
Primary
1
INTRODUCTION
The increase of questions regarding the future of the environment is ubiquitous. Global and national objectives are created frequently with the end goal of a sustainable future. The most sought out goal is decreasing the use of fossil fuels for energy production, minimizing the energy usage and the increase of energy efficiency regarding e.g., household appliances, transportation, building characteristics and so on. This degree project will regard a ETC house in Västerås Sweden, that falls into the zero-energy building category. This focus will be on the CO2 mitigation and how it is affected the following three factors; the ETC zero-energy building as an end user, type of renewable energy source used and the difference between when the ETC building is connected to the district heating network and when it is not. An enviro-economic assessment will also be done regarding the zero-energy building during the consideration of different renewable source flexibilities and to see how these changes
depending on the designated region. At the end of the study a discussion regarding the possible solution will be presented based on the demarcations set for the study.
1.1
Background
Residential buildings today are under the magnifying glass, being that they have a considerable impact on the amount of CO2 emission. They stand for around 40% of the primary energy use and 24 % of Europe’s current greenhouse emissions (D’Agostino et al., 2016).
Both the European Union (E.U) and the United States (U.S) have different policy packages, with goals to reduce the energy use and emission by regarding the renovation policies of the current residential building stocks (Sophie Shnapp., 2014). The consumption of the building around the world can be decreased by 30%. This result also takes factors like the predicted increase of the global population and the different comfort levels in developing regions into consideration. To make this goal possible, a reduction of around 70% of the global
consumption of existing buildings, for heating and cooling, must occur. The goal is predicted to be reached is 2050. It is important to note that this can only happen if the current
sustainable policies become a standard withing 4 years, as they ensure the reductions of emission from the building sector.
One directive that is directly connected to the latter mentioned, is the Energy Performance of Buildings Directive (EPBD) (Boermans et.al., 2011). This was a directive set to implement future requirements such as nearly Zero-energy buildings, which will have large focus in this work, and started around 2019 for the public residential buildings and 2021 for the coming buildings to be planned.
The purpose of a NZEB (nearly Zero-energy buildings) is to have a building with as high energy performance as possible. The required energy is then at a minimum, which mostly renewable energy sources will be able to cover from nearby or on-site production.
The structure of a NZEB is not the same everywhere as climate is one important driving factor of the parameters present. Therefore, it is impossible to prescribe a set of rules on how these types of climate positive buildings should be structured. The different membered states need to create strategies on a national level which evaluates national, regional, and local conditions for the increased number of NZEB.
According to Deng et.al. (2014) the ideal goal is to make NZEB independent from a connection the national grid, making the building 100 % self-sufficient. Therefor it is
important to be certain that this ideal goal really mitigates harmful substances like CO2 when e.g., a connection to the district heating network is replaced by an energy storage- or future smart grid method.
Replacing older buildings with new nearly zero-energy buildings is one tool in converting traditional technologies to electricity consuming alternatives (Hamels et.al., n.d.). The assessment of these types of conversions are based on how primary energy use and CO2 emissions is handled within the different technologies. Therefore, a transparency of the methodology used to calculate the implemented performance by the primary energy use and CO2 emission is necessary. This type of transparency does not exist today. Hamels et.al reviewed 65 publications and considered six different methodologies. Problems that occur when no transparency exist is that e.g., not all publications consider import of electricity or a retrospective aspect etc. Not only does the common ground for all methodology surrounding the conversion in literature be more defined, the validity of them also needs to be transparent in related literature to avoid the flaws in the current ones.
1.2
Purpose
The purpose of this report is to get an overview of the CO2 reduction when adopting to, i.e., changing the energy sources e.g., with renewable energy with and without a connection to the district heating network and get a visualization for improvement, if any exist.
1.3
Problem
How does the renewable energy sources, wind and solar differ in CO2 emission mitigation for the case studied building?
What are the dissimilarities when connecting the zero-energy building to the district heating network and when it is not connected?
What is the enviro-economic aspects for the zero-energy building when considering different source flexibilities?
1.4
Delimitations
The studied zero energy buildings’ absence of a district heating network connection restrains the amount of information surrounding the same building with a connection to the district heating network. The building which the model is based on is also newly produced, meaning no direct comparison can be done for a “active” house with occupants, as no such data exist yet.
One important limitation for evaluations concerning energy simulations and calculations is the large number of parameters needed and the infinite possibilities making a pre described environment impossible. Therefore, the case study is partly based on insecure data which is lifted with assumptions. These types of errors and assumptions will also be discussed regarding what they mean and how they affect the result.
The complexity of the simulations might affect the value only for fixed conditions.
The simplification derived from assessing the enviro-economic aspect and the uncertainty that comes with these.
2
METHOD
The main methodology in this work, is based on gathering information (e.g., scholar
database, internet, books, articles etc.) with similar keywords that are somewhat or directly applicable for a comparison with the derived data and strengthen the result and
understanding. The input used to get the derived data is given by field measurements done in an existing ETC house. With the input data an energy model of the house is created to
visualize the differences between the issues. Simulations on the model will give the data validity and the factors contributing to it. Calculations will be handled through excel and presented in the result.
2.1
Literature review
Scientific papers and reports regarding similar studies are reviewed to get a broader understanding about the issue and possible improvements for the climate positive ETC building that is studied. The difference between different climate positive buildings and the studied building will be discussed based on presented methodology for CO2-mitigation. CO2 mitigation being the main keyword in this study, will be connected to three subgroups; adoptability of renewable sources, whether a connection to the district heating network exist and the enviro-economic aspect. The literature review will present different alternatives when choosing methodology for the previous mentioned keywords and discuss the definition for some of the different climate positive buildings. There is a possibility to assess the validity for the different solutions presented in this study, by using the advised literature review. The deciding factor of the type of literature, depends on the level of applicability to the studied area. As the main target is CO2 mitigation, this will be the primary keyword to better understand the reason when choosing a specific type of renewable energy source and whether a connection to the district heating network is preferred. A review over some of the current discussions and topics regarding climate positive building such as NZEB (Net Zero-Enery Buildings) will be presented to better understand why they are important and why they still have not taken over the space of conventional buildings.
2.2
Case study
The case study chapter describes how the different methods are used and what parameters are taken into consideration for the simulations and calculations.
2.2.1
Enviro-economic data
Information about different energy prices depending on the energy mix for a specific region/zone in Sweden will be gathered from local sources. This will provide a better overview of the CO2 equivalent for the different regions/zones.
From these considerations we will see the effect of the climate condition on the energy balance of the building, as well as the environmental impact on the heat and power generation system in different parts of Sweden.
2.2.2
Field measurements
Most input data will be gathered on site. Some data will be gathered with special equipment for measuring e.g., the heat resistance of the building. Data connected to the ventilation will be accessible through air tightness tests which the real estate will perform.
Due to the pandemic, these data will be taken from measurements done by the building owners and will be presented in the case study chapter. This includes data such as, energy calculations, construction material, layer composition etc.
2.2.3
Analysis
The different case studies for different countries will be compared, where e.g., the choice of methodology and the result stemming from said methodology will be discussed. These could be modeled simulations, computer aided model, numerical methods, experimental analysis etc.
2.3
Calculations
Calculations to summarize the result will be done using excel containing tables and diagrams.
2.4
TRNSYS simulations
The building energy modeling (BEM) software used for the simulations will be TRNSYS. The simulation software can provide an assessment on the performance of thermal and electrical systems but is also widely used for other environments such as traffic flow, biological
processes etc. (trnsys, 2021). Transient system behaviors can also be simulated.
2.4.1
ETC model
The case studied ETC building will be modeled in TRNSYS with respect to provided
structural data. The first modeled simulation will be a zero-degree building model with given building dimensions in 3D but without visual appearance. Zones for the different rooms will be defined and the connection between them. The buildings energeia or thermal mass will then be simulated. This will give an overview on the performance of the systems, mitigation based on energy sources and relevance in a connection to the district heating network.
Afterwards, real values are added into the equations, such as thermal breach possibilities, infiltration ratio, airtightness etc. More simulations are conducted to review the same assessments as latter mentioned.
The modeled house will also be simulated in different regions in Sweden to see how cost, mitigation and performance fluctuate for the different energy source flexibilities and DHN (District heating network) connections.
2.4.2
Solar system
Production, mitigation, and cost is simulated in TRNSYS and calculated based on the
performance of the buildings solar system and is done to see the energy use and therefore the CO2 equivalent. The derived data will be compared to the other renewable sources.
2.4.3
Wind
Simulations regarding wind power plants, from on-site or nearby power generation systems will be done to get the performance of the energy source and CO2 equivalent and compare it to other renewable sources. This will also be done in TRNSYS.
2.4.4
District heating
One of the goals for climate positive building is being 100% self-sufficient, which means no connection to the district heating network (Deng et.al, 2014). Simulation in TRNSYS will be done to see the difference between an existing connection to the district heating network and without, providing a validity on whether the sought-out self-sufficiency is withing a
sustainable reach.
2.4.5
Region
How regional aspects affect the different flexibilities and connections will be implemented in the simulations to see how sustainability changes depending on the fixed location. This in turn will tell us how cost-effective it is to build the houses, depending on e.g., the accessibility to grids, climate, energy prices etc. Transportation is a factor regarding the accessibility for different sources but is not focused on this work. Instead, as mentioned before, the CO2 equivalent will be discussed for different regions, which in turn can have indirect connection to the transportation for the energy supply, depending on the type of energy source.
3
LITERATURE STUDY
The following literature study will give a better understanding of the impact the residential sector have on the environment and how solutions such as zero energy buildings can be used to minimize the impact. Different definitions of the zero energy buildings, such as nearly zero energy buildings, nearly zero energy cost buildings will be discussed to show the absent common which forms the politics and effect the different developments possible regarding e.g., CO2 mitigation for the residential sector.
3.1
CO2 mitigation and energy use in Residential buildings
All house complexes are considered in the residential sector. Houses that are not attached to each other but also house that are attached, like apartments and town houses. Residential and commercial buildings withing the building sector stand for a large portion of the total energy use and stand for circa 38,7% (Allouhi et al., 2015). It is estimated that the sector also contributes to a third of the world’s total generated global greenhouse gas emissions. The reported amount was in 2004, around 8,6 million metric tons CO2 equivalent. To make the residential sector more efficient in energy use, policies and other measurements need to be adopted by different public authorities and decision makers which influences the sector. According to D’Agostino et al., (2019) EU has a roadmap set for 2050 to reduce the greenhouse gas by at least 80% which is compared to the reduction from 1990 at 40%.
1400 1450 1500 1550 1600 1650 1700 1750 1800 1850 1900 2005 2010 2015 2020 Prim ar y en ergy con su m p tio n (Mt o e) Year
Primary energy consumption 2005-2020
Achieved primary energy consumption
2007 Projection 2013 Projection EU target 2020
It is very hard to find a solution that does not involve complex methodologies to make predictions of the consumption. This is because of the vast number of factors that are in action. Take e.g., human activity consideration when creating a higher comfort level which improves the building services and becomes even more complex when involving the population growth and the reduction of geographical dispersion. Some of the current solutions involve simplifications of mathematical models, engineering methods or implementing statistical or artificial methods.
According to Allohi et al., (2015) the demand for larger houses with more successive energy services increases the total energy use globally. Data vis-á-vis the enhancement of the human beings’ comfort, the level of architecture, size of the house, geography and atmospheric conditions are used to map out the energy use trends in residential buildings. These policies differ depending on the considered country but are generally divided into three subgroups. The groups refer to Regulatory measures, soft instruments, and economic incentive. With regulatory measures, the building is regulated based on mandatory aspects and requirements of minimum values. Certifications that are seen as voluntary standards which are considered as soft instruments. Contracts, tax exemptions and reductions, capital subsidies, grans and subsidized loans are some of the incentives to economically undertake the task in renovating and improving buildings.
3.2
Renewable sources
Most policies push renewable energy sources as a counter measure for the environmental footprints (Allouhi et al., 2015). Adapting the sources flexibilities to make residential houses more energy efficient is not a new science. Nevertheless, despite this the worldwide share of renewable energy is low and is around 18% of the world’s final energy use.
The renewable power generation is meant to make up for the energy use in a NZEB (Deng et al., 2014). On-site generation systems are the latest trend in NZEB for self-production of power instead of buying green electricity. A common practice is to choose PV panels for the
on-site power system. Due to the amount of research that have been dedicated to developing PV cells, the efficiency has increased with a decrease in cost making it a valuable addition to the NZEB concept. Other on-site renewable power generation system is wind, CCHP
(Combined cooling, heating, and power), hybrid power system etc. CCHP systems have been seen as a new efficiency measure and as it generates electricity and thermal energy
simultaneously, from a single source, it also allows for a measure in reducing the CO2 emission. Combining CCHP systems with suitable integrated energy users such as e.g., commercial buildings, allows for the possibility to remove the need of cooling towers. Hydrogen, specifically hydrogen powered fuel cells, are future alternative addition to the electrical power and will work as a substitute for many detrimental fuels used today.
According to Deng et al., (2014) further development of the previous mentioned technologies will allow the NZEB to offset the consumed energy with on-site power generation.
Transferring surpluses with higher efficiency systems to the grid can then be seen as a cost saving measurement. Nevertheless, for time periods where the building cannot offset the usage, energy delivered by the grid will still be necessary, forcing the NZEB to sustain a connection to the grid under short to medium terms. With the latter mentioned increase in efficiency for the technologies, other problems related to the grid will occur, e.g., load mismatches, overloading etc. A possible and necessary future solution for this is to integrate the development of smart grids.
3.2.1
Priority list for on-site and boundary footprint
The list of renewable energy technologies for ZEB are PV, solar hot water, wind, hydroelectric and biofuels (Torcellini et al., 2006). These renewables are to be chosen over coal, natural gas, and other non-renewable energy sources for a more sustainable building. Torcellini et al. (2006) suggest a ranking of the renewable source for the ZEB context. The ranking of the technologies is based on three principles, (1) Keeping the environmental impact at a
minimum through the means of energy efficiency within the building and mitigate losses for transportation and conversion. (2) Availability for the building’s entire lifetime, (3)
The commonly used technologies on the supply-side are PV for rooftops and solar water heating. Similar technologies with higher limitations can be e.g., wind for parking lots and PV systems. The building can also use renewable energy sources outside its boundary to reach the ZEB definition. However, this falls into the off-site ZEB category and does not generate energy on site.
According to Torcellini, before any on-site renewable source (e.g., before mentioned PV or wind) can be installed, the ZEB definition should first sustain a sufficient energy efficiency. Reducing the load cannot be achieved when buying energy from e.g., wind plants and other similar central producers and falls into the off-site ZEB category. On-site energy production does not take into consideration daylighting or CHP (Combined heat and power) as an efficiency measure for ZEB. Efficiency measures on the demand-side that is stationed for the building’s lifetime, such as passive solar heating and daylighting, must be checked to assure that the measure still is efficient in energy savings. This importance lies on the fact that saving energy, majority of the time, is easier to achieve than producing the energy.
3.2.2
Solar power
Solar harnessing is commonly integrated in building to improve the performance (Deng et al., 2014). PV are very cost effective, making them a commonly used technology for less developed countries. The technology is also widely implemented for NZEB when harnessing the solar power with solar connectors (SC). They are often installed on roofs, walls and sometimes on balconies or blinds, but often the positioning depends on the architectural availability with regards to harnessing capabilities.
Imported fuels such as Wooden pellets, biomass, ethanol, biodisel etc, that is used to generate electricity and heat
on-site
Green pruschasing, insisting of utility based wind, PV emission credits etc.
HVAC with high efficiency, natural konvetion, cooling evaporators etc On-site
Examples
PV, solar hot water, wind adjecent to the building
PV, solar hot water, hydro, wind on-site only
Off-site Supply side ZEB option
Renewable sources that are avaialle within site boundary
3 Avaialbe off-site renewable energy sources usage for on site energy generation
4 Using off-site renewable energy sources through purchase
0 Low energy building techologies for reduced site energy
1 Within the boundary of the buildings footprint have a renwable energy source usage when 2
One of the proposals form the European Union, is that the greenhouse gas emissions is to be reduced with 40% in the domestic sector by 2030 (Europaenergyinnovatio.eu, 2018).
Reaching this goal will need solar and wind power generation to stand for around 1200 to 1250 TWh of the renewable electricity. From this number, solar thermal power would stand for 20 TWh and PV 380 TWh, where a 350 GW PV capacity must be installed. For this to be possible, new energy policies need to emerge.
According to European energy innovation (2018), one possible solution for reaching the goal is to determine the amount of rooftop area available for PV system and utilize it as much as feasible. For 1 km2 per capita, the available area is between 4m2 in denser populated cities to 175 m2 in less dense areas. The total available solar area for Sweden e.g., is around 19 500 – 30 000 ha. This would represent the total rooftop PV power of around 55 000- 100 000 MW. Which shows the beneficial factor of solar power and its sustainability.
3.2.3
Wind power
On-site wind turbines and wind power plants are the available renewable energy
performance systems for the wind category (Deng et al., 2014). According to Tamašauskas et al. (2019) the performance of the wind turbines is strongly dependent on the climate and geographical location. For the balance of NZEB, no energy balance has been integrated with wind turbine due to the lack of research within the specification. To develop an integration, studies comprising of data about the wind turbines in different geographical locations and climates needs to be evaluated and exploit.
Another occurring problem like the lack of integration is the lack of support for the
technology. The discussion on whether a wind turbine should be built differs from different countries. For example, when asked if wind power plants should expand, 68 % said yes in Denmark, 88% in Germany, 77% in the UK and 92% in France (Wizelius, 2015). This goes to
0 10 20 30 40 50 60 70 80 90 100 [G W]
Global Installed Wind Power [GW]
show that accessibility of wind turbine does not only depend on physical barriers but also political. Even though the numbers of acceptance for the development is high, there is still a vast portion of the fraction that live up to the term “NIMBY” which stands for not in my back yard, wanting the development but not nearby.
The installed amount does not differ that much with e.g., nuclear power. According to IVA (2016) the sum of the installed for Ringhals 1, Ringhals 2 and Ringhals 3 in Sweden is 2.8 GW. If we compare this with the figure above, the installed effect for wind does not differ much. Since wind is not an adjustable source, the result in production will differ as nuclear power plants can perform a more constant power generation showing yet another reason why wind to this day can only work as an addition in helping mitigate CO2 and not as a definite solution.
3.2.4
Ground source heat pump (GSHP)
GSHPs are high efficiency heat pumps that are frequently integrated into NZEB to
necessarily support the HVAC (Heating, ventilation, and air conditioning) system (Deng et al., 2014). As the temperature changes the character of the soil alters making GSHPs highly dependent on the climate condition. GSHPs and other renewable energy sources are
generally not seen as a fixed solution for supporting the HVAC system, which is due to the instabilities and load mismatches coming from being e.g., inter-seasonal thermal storage alternatives. Instead, these technologies are used as assisting tools for the entire energy system of the building. Air source heat pumps are outperformed by GSHPs, having 30% lower efficiency.
The average installation price for a ground source heat pump in Sweden is around 180 000kr and also includes creating the borehole. 33% stands for the working labor which can be adapted with the root deduction (Kostnadsguiden, 2020). The repayment period for ground source heat pumps is circa 5 to 10 years (thermia, 2021).
3.3
Energy Efficiency
According to Deng et al., (2014) the building service system (BSS), which is e.g., heating, ventilation etc., should be regarded when evaluating NZEB. In most literature and works, the occupant of the building is seen as the consumer. In reality, the energy products such as electricity are mostly consumed to operate the BSS.
Increasing the efficiency of the building will lead to energy-saving for the BSS and
performance improvement of the NZEB. The evaluation of NZEB is strongly dependent on any set of energy efficient measure that is not fixed.
The energy efficient measure can be divided into three main groups that are passive design, service system and RES (Renewable energy source) power generation. The power generation
from RES is installed to compensate the energy use. The different types are, solar, wind, biomass etc.
•Power generation from RES:
The power generation from RES is installed to compensate the energy use. The different types are, solar, wind, biomass etc.
•Service systems:
To create a comfort within the occupant’s indoor environment different service systems such has HVAC systems (heating, ventilation, air-conditioning), DHW systems (domestic hot water), lightning system and so on, should be efficiently installed to make the latter mentioned comfort condition for the occupants available. •Passive design:
Ways to efficiently improve the design of the building is strongly influenced by the passive properties. These properties can be efficiently increased by integrating thermal isolation with higher performance to the envelope of the building, optimal airtightness, and properly designed window shadings. These properties have a direct effect on the thermal and electrical load of the building, where the desired result is achieved when decreasing the loads.
Deng et al., (2014) goes on to reference a “pathway map” for NZEB, that weighs the risk and benefit factors against each other. The list below will provide some examples of the risk and benefits for some technologies used in NZEB.
•High Risk – High Benefit:
Solar Air-conditioning, Community-scale seasonal storage, solar assisted heat pumps, thin-film PV etc.
•High Risk – Low Benefit:
Switchable wall coatings, efficient clothes dryer, EC windows (EC – electrochromic), Attic integrated night sky radiative cooling etc.
•Low Risk – High Benefit:
Low-cost cold climate SDHW (Solar domestic hot water heating), building integrated thermal storage, small volume ZEH (Zero energy home) Air handler etc.
Cool attics, building intelligent automatic system, battery storage, low-cost ground source heat pump etc.
3.4
Zero-energy buildings
Climate positive buildings are key factors for minimizing energy use, environmental issues, and CO2 emission in the building sector. One of these buildings are called Zero-Energy Building (ZEB). The definition for zero-energy buildings is frequently discussed and no absolute definition have been made (Deng et.al., 2014). It is clear that the definitions have different weights depending on different factors like the building’s owner, type of work done and the design team. In recent years, the topic has reached a somewhat common ground of the definitions of ZEB. This newly accepted definitions are based on the structure that regards different elements, like boundary, metrics, basis etc. The structure (or framework) allows the contributors to decide for themself between the different elements to achieve the result they want and at the same time create specific definition of ZEB based on their
operational needs such as cost, local climate, environmental issues, and the possibility to use on-site renewable source. This in turn create guidelines for e.g., countries, regions, design groups etc. where the definition is set on different levels for their individual scenarios.
The elements within the definitions are usually the building system, energy grid and weighing system. These elements will provide a possible balance calculation making it a net zero goal. A distinction in the boundary for the house between the building system and on-site
renewable allows the building owner to pick what the weighing should be grounded on. Consumption of energy happens in the building system within the boundary and the surplus of energy from the output energy produced from the renewable energy power is transferred back to the grid.
Figure 4 NZEB system and element representation. Source: Deng et al. 2014.
Deng et al. (2014), goes on to say that if the owner cares more about cost a cost balance is done rather than e.g., an energy balance. The weighing elements provides option to assess the technological solution chosen for balancing the demand and supply by evaluating the
achievability of a net zero balance. Boundary, evaluation period and weight are parameters adding on the elements previously mentioned. The properties and appearance of the boundary is flexible and does not have to be of the physical boundary form.
When the on-site generation for ZEB does not meet the load, other sources of the electric and natural gas type utilities are used (Torcellini et al., 2006). The excess generation for on-site is exported to the utility grid when its greater than the load. Exporting to the grid allows excess of energy to be offset. When the energy use is higher and the on-site generation lower. The obsolete level of storage technologies, having a ZEB without a grid relationship would be inefficient. Off-grid buildings will depend on other energy sources such as propane for everyday task such as cooking, washing etc., when independent of electric energy. Oversizing of the renewable sources occurs when excessing energy production to a grid is not possible. For seasons, especially the summer season, the excess amount of energy produces will be unusable. These types of problems do not only occur for the off-grid buildings. It cannot be assumed that the excess generation from on-site buildings always can be sent back to the grid as it is dependent on the net mount the grid needs. For some cases, e.g., due to high market penetration scenarios, no excess energy is needed, showing a scenario where the off-grid and on-site are similar. Solving this would require further development into making on-site storage more efficient and affordable.
The department of energy (D.O.E) in USA is one of the organizations dealing with creating a data base of the definition on ZEB through database projects providing design and operation test. The D.O.E have suggested that the definition should become broader and should be divided into four types of ZEB: site, source, emission, and cost. When the boundary property is fixed, it is easier to distinguish weather or not an on-site or off-site renewable energy power system is used, giving the end users the choice of buying “green electricity”.
Multiple definitions are available, the one is usually not better than the other as mentioned previously. The type of balance is often decided based on the situational aspect of the house and the owners’ preferences.
Demand and supply balancing is a substantial ZEB definition often used, which stretches to individual evaluation conclusion based on the type of balancing. Often the parameters that are evaluated and used in the net energy calculation are consumption and generation of renewable energy sources. This is not the only way to define a way to balance a ZEB as many exist, a recommendation is to further explore the topic of types of balancing.
The latter mentioned cases of the definition are regarded in the literal form of ZEB. The definition can also be expressed in mathematical equations according to Deng et al., (2014). On example of equation is the following:
𝑁𝑒𝑡 𝐸𝑛𝑒𝑟𝑔𝑦 = 𝑂𝑢𝑡𝑝𝑢𝑡 − 𝐼𝑛𝑝𝑢𝑡
= Σi𝑂𝑢𝑡𝑝𝑢𝑡 𝑒𝑛𝑒𝑟𝑔𝑦(𝑖) ∗ 𝑤𝑒𝑖𝑔ℎ𝑡(𝑖) − Σi𝐷𝑒𝑙𝑖𝑣𝑒𝑟𝑒𝑑 𝑒𝑛𝑒𝑟𝑔𝑦(𝑖) ∗ 𝑤𝑒𝑖𝑔ℎ𝑡(𝑖) ≥ 0
The equation presents a simplified definition balancing ZEB through the means of a
mathematical equation. The balance between the energy input and output for a time period is simply shown in the expression for a fixed building zone which also can provide a positive value. There are no constraints in the equation for the weight, period, and other limitation on the boundary, because the definitions are based on the designer’s purpose where evaluations might proceed the definitions conditions as infeasible when limited to a constant form (D’Agostino et al., 2016).
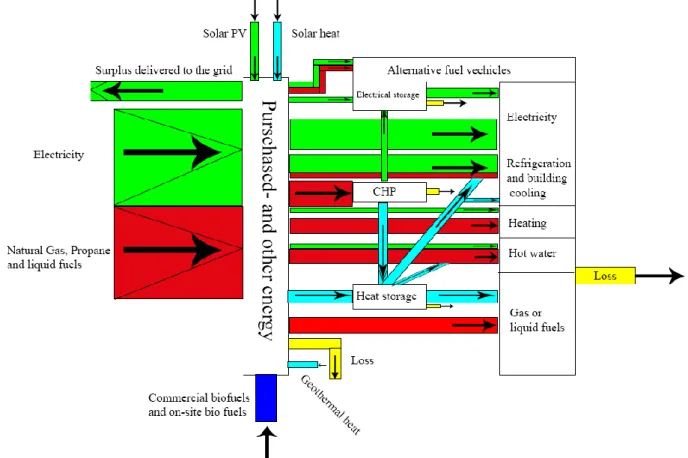
Balancing ZEB can be visualized in many ways and not only through equations. Another type of way is through flow diagrams (Deng et al., 2014). The flow diagram includes the
performance of the entire system for the buildings system and its services. The first white square on Figure 5 is divided into four different sides. Left side represent the purchased – and delivered energy from the grid. Purchased energy are fuel and gases like natural gas, propane liquid fuels etc. The renewable energy sources are shown at the top and bottom of the white box, such as solar, geothermal etc. To the right side, the energy delivered to vast of different units such as electricity storage, CHP, heat storage etc. The right end side then represent what the delivered energy goes through when it has reached the end use phase. E.g., Electricity, refrigeration + building cooling, building heating, DHW, vehicles etc. A comparison between the delivered – and purchased energy can be done to evaluate the achievability of the net zero energy aim if their amount is converted into a uniform metric. This provides an alternative way to also evaluate the performance of the buildings systems and services by comparing the two different flows, thereby balancing the house.
There exists no definition that is agreed upon on an international level. But it is generally common to consider different factors such as elements, parameters, graphical or
mathematical forms and related studies to implement a suitable framework for the definition. This type of definition framework can be used to create legislations and plans to further develop the place NZEB has. Here, like latter cases, the different participators e.g., organizations, research fields and nations, can choose different elements based on their specific desires with respect to their limitations such as economy, capacity etc. Defining the definitions is therefore an important first step when evaluating NZEB, as it provides
indicators of the object in hand and the different method and tools that can be implemented and how the performance can be evaluated.
3.5
Wooden house
Wooden houses are mostly coupled with the concept of passive houses which is a widely accepted approach for construction of low energy use buildings. When high effective
insulation and airtightness is achieved, the cost for active renewable technology is minimized. To reduce stress on heating system, the concept house is coupled with solar technical
solutions which keeps the demand and use to a minimum. The houses are designed to sustain a longer heat gain while at the same time keeping a desired comfort level with a temperature around 20 degrees during the whole year. Heating systems, which is almost the same size as toaster elements according to Omer et al., (2010), are integrated into the space heating for the ventilation system which allows for an energy use of around 15 kWh/m2/yr. Building materials that satisfies the environmental level are chosen and still has the same efficiency, quality, dependability, and durability requirements as for structure with conventional
material. New technology for construction has occurred with the renewable material use and has altered the architectural process. One important task for the passive wooden house, is to balance the life cycle of the building with the right amount of energy. This, which is directly
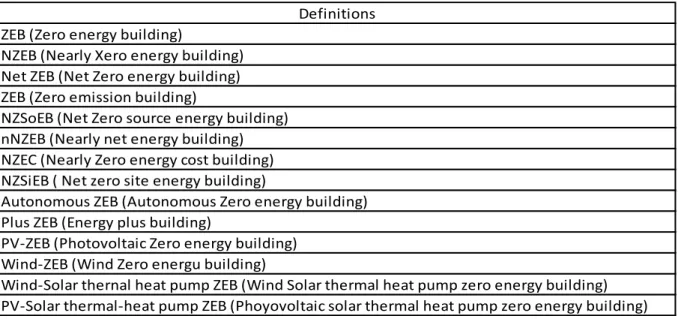
Definitions ZEB (Zero energy building)
NZEB (Nearly Xero energy building) Net ZEB (Net Zero energy building) ZEB (Zero emission building)
NZSoEB (Net Zero source energy building) nNZEB (Nearly net energy building) NZEC (Nearly Zero energy cost building) NZSiEB ( Net zero site energy building)
Autonomous ZEB (Autonomous Zero energy building) Plus ZEB (Energy plus building)
PV-ZEB (Photovoltaic Zero energy building) Wind-ZEB (Wind Zero energu building)
Wind-Solar thernal heat pump ZEB (Wind Solar thermal heat pump zero energy building) PV-Solar thermal-heat pump ZEB (Phoyovoltaic solar thermal heat pump zero energy building)
connected to the sustainable question, includes the different faces of the building, from the material being produced to the house being demolished. Some criteria can e.g., be that the material does not contain toxic substances, achieving an ecological setpoint.
Omer et al. (2010), goes on to explain that the passive house has an absence of active heating and or/ air conditioning and still succeeds in sustaining a desired comfort level all year around. As mentioned previously, the thermal energy should not exceed 15 kWh/m2 for the house to be classified as a passive house. Components for passive houses are high demanding e.g., every surface except the glass sections should be thermally insulated to achieve a U-value (heat transfer coefficient) less or equal to 0.15 W/m2K. Proper installation of shading on the south side should take into consideration the passive solar gain as it effects the overall stability of the house. If the effect of solar radiation is not considered, overheating in the south adjacent walls will most likely occur, especially during winter months. Factors such as airtightness should be efficient to avoid uncontrollable changes between inside- and outside air, creating a type of wind resistance. Separate ventilation system might be installed in different rooms to assure the rooms exposed to the warmest sunlight get sufficient ventilation.
The thickness of the insulation should be around 25-40 cm with a triple glazing for windows and doors to assure that the heat is captured inside the house. The investment of passive houses might exceed the cost with around 10-15% for regular technologies, but often has a minimum payoff of around 10 years.
The material used for passive houses are mostly wooden based. According to Omer et al. (2010), timber is seen as an ecologically sound material as it stores CO2 and releases low emissions during the production of the material compared to other industrial counterparts. Wooden construction of exterior walls can be two thirds of the conventional stonework wall and still have the same heat loss coefficient, which in turn can lead to around 10% more living space for occupants. Another advantage for the wooden material is the cost, being 10%
cheaper than most material. Prefabrication of wooden houses is often frequently done to reduce construction time and cost. According to Schauerte., (D.U), prefabrication of wooden houses, commonly single-family houses, has existed since the 18th century in Sweden and
since the 1800s in Norway.
3.5.1
ETC buildings
An ETC buildings are set out to be climate positive for multi-family residentials (ETC bygg AB u.d). It is a wooden passive house concept, designed to trap the CO2 into the building material but also take the material properties for advantages such as dehumidification of the moisture resonating from the occupants’ bodies. The house can keep the heat gains inside the building, with a heat loss rate equal or less than 14 W/m2, for longer periods than
conventional buildings, decreasing the heating demand without sacrificing a desired comfort level inside. Future changes of the heating or cooling system will therefore be highly possible. ETC designs follow the energy demand of the certification type FEBY, which surround low energy building, capable of having an energy efficiency high enough to consume 25% less energy than for conventional buildings (Feby, u.d). Solar panels are installed on balconies
and roof tops, which is projected to deliver a 20% surplus for a year (etcbygg.se, u.d). The heating system is structured on a geothermal heat system. ETC houses integrate an optimization between buildings, battery storage system and charging points for electrical cars. These factors will not be widely focused on for this degree project.
3.6
Methodologies
The thermal transmittance (or U-value), building load and COP (Coefficient of performance) for the HVAC system, are some important parameters of many, that are key when evaluating a NZEB. According to Deng et al., (2014) these parameters are mostly important for the energy balancing part of a NZEB project, but other factors such as indoor comfort, that has no direct connection to the performance and efficiency of the building must be takin into consideration. Therefore, a NZEB cannot be evaluated the same way a conventional building would be evaluated. If the indoor environment does not reach the desired comfort level, the purpose of having an efficient system for the building is defeated. Indoor comfort and life cycle assessments then must be implemented in the evaluation to avoid poor designs of the building with oversized dimension on energy systems.
When a NZEB is evaluated, different methods need to be considered to reach maximum satisfaction. These methods are often not self-sufficient and sometimes need other methods to strengthen the results. Some methods are based on e.g., the evaluation of the entire life cycle for the building, the primary energy, research method evaluation, and more. Below are some comments on the methods brought up. It is important to keep in mind that many more methods exist outside this text.
• Whole life cycle evaluation:
This type of lifecycle analysis if often split into four groups: preparation (includes
transportation and manufacture), construction, maintenance, and demolition. Evaluating these groups will allow for assessment of the building regarding e.g., environmental impacts, cost etc.
• Primary energy:
Evaluation of consumed primary energy for the entire lifetime using e.g., operational energy, recycled energy, and embodied energy. To perform the evaluation, data regarding
performance which is gathered through experiments and or simulations are needed. • Research method evaluation
This design type and installation is just like in the previous mentioned method, validated through simulations and experiments. The operational performance between the building and the energy system is predicted through simulations and is used prior to the evaluation to gather enough data.
3.6.1
General method for the EU & US
Finding savings and reducing the energy use in the residential sector is the main boundary structure EU is using as a method to forward policies and promoting NZEB designs. The organ with direct affiliation to this method is the before mentioned EPBD. The EPBD has in goal to make the conventional building have properties of NZEB (D’Agostino et al. 2019). One single definition for zero energy buildings cannot be created, so all membered states are obliged by EPBD to create their designated definition based on factors like national, regional, and local conditions and the amount of primary energy used with numerical indicators in kWh/m2 year.
Achieving the lowest possible cost for an economic lifecycle with a desired energy
performance level is a core method of cost optimal level for EPBD. The mentioned method reduces the cost using minimum required energy performance in building sectors and other building elements. In general, reduction of primary energy use with different energy
efficiency measures has different definitions within the methodology. The sought-out result is the one that has the most efficient economical solution. Different approaches exist for when constructing new building or renovating old buildings into NZEB. The goal in this method is to create minimum level of ambition to reach the most optimal cost. There exists no
performance level that can cover all membered states without having to adjust it according to different climate condition, efficiency measures, cost packages, amount of renewable and specific comfort levels.
The core methodology for the American counterpart DOE, discusses that the energy
generated by on- or nearby sites with renewable source is to offset the delivered (consumed) energy annually with a possible surplus. The energy efficient factors for the buildings are not defined, instead a limitation is set on ZEB referring to their demonstrational capabilities in their annual balance.
3.6.2
Simulations
System simulations are done with performance data obtained from different steady state tests. These simulations done on the performance of the system is carried out annually with an hourly evaluation timestep (Deng et al., 2014). The evaluation contains factors such as indoor comfort, system efficiency, balancing, technoeconomic and LCA (Life cycle analysis) which are all assessed. Methods involving these kinds of simulations are mostly used for either preparational work or post validation, and are highly dependent on performance data like electricity consumption, availability, demand/supply etc. The before mentioned
General Method USA
Europe
To offset the delivered energy with on- or nearby site with renewable sources anually Savings and energy consumption reduction Figure 6 Core methodology of approaching NZEB for EU
preparational aspect of the method is crucial when analyzing the performance evaluation as it creates a deeper set of analysis for specified views and designs.
As mentioned in the previous paragraph, simulations and experiments are core steps when creating a study. The task however, to repeat the experiments for an external environment based on data regarding the performance of a NZEB derived from measurements of meters and sensor, is not an easy task. For these situations, simulations are instead commonly used to assist the method to gather enough performance data. This simulation is done for a whole year or for the whole life of the system, just like when using a research method. Although simulations are particularly useful for creating models of the NZEBs energy system, its preferred to use real measured data that are gathered from experiments with e.g., specific weather conditions to validate the simulation models. When verified, applying the simulation models in other case studies become easier to embody for different conditions such as
occupancy, climate, and economy.
3.6.3
Tools
A large amount of simulation tools surrounding building and energy systems have been advanced in the latest years (Deng et al., 2014). These simulation tools are used to assess the different designs and measures e.g., passive designs, active designs of energy efficient
measures and ERP (Enterprise recourse planning) integrations for different building types. Elements such as trade-off and optimization have a higher focus for NZEB assessments than for conventional buildings. Integration of these elements creates and ideal evaluation tool for the algorithm used when optimizing traditional short term energy use calculations.
An additional evaluation of NZEB discusses how sustainable the development for the buildings entire life cycle is. Environmental issues, cost, and net energy are some elements assessed regarding sustainable development. It Is necessary that either a database with information about the life cycle of the building and material, or/and the latter mentioned evaluation tool, is available when assessing the design and evaluation of a NZEB.
Deng et al. (2014), goes on to mention that a prior indicator for a NZEB evaluation is the indoor comfort element. When the performance model of the building is high, the occupancy space should consist of a high level indoor environmental quality and comfort for the
occupant. Simulation software like TRNSYS can evaluate these indicators by integrating them into the output of the transient simulation models and calculations.
LCA (life cycle assessment) is a research method, which does not qualify as a performance indicator, utilized for assessing the use of different material, energy patterns, environmental issues and so on. The comprehensive analysis that derives from an LCA, about environmental impact and energy, explains the high usage of the research method in the building industry. The process between which sources the material was gathered from, to how the building was demolished is connected to the performance indicators referring to emission of CO2,
3.7
CO2 equivalent
To compare the different greenhouse gases the metrical measurement CO2 equivalent is used based on the gases different global warming potential or GWP (ec.europa.eu, 2017). To get the amount of carbon dioxide that is equivalent with other gases, a conversion must be done. For example, if the GWP for methane is 25 so for 1 million metric tons of methane we get the CO2 equivalent of 25 million tons of carbon dioxide.
3.8
Cost
The cost for district heating is circa 98 öre/kWh (eon.se, 2021). The cost for solar energy is between 45 – 100 öre/ kWh (hemsol.se, 2021). The price for land wind power is circa 51 öre/kWh. (vgregion, 2017). For ground source heat pump the price is around 95 öre/kWh (värmepumpsguiden.se, u.d)
3.9
BBR
BBR (Boverkets byggregler) is a set of rules for the technical requirements withing the Swedish planning and building act (boverket.se, 2021). The highest allowed primary energy number for residential houses is 75 kWh/m2,Atemp annually (boverket.se, 2020).
4
CURRENT STUDY
The current study explains the different parameters involved and searched for and how they are used to assess the case studied building. Technical and simulation aspect will be
presented to allow the reader to repeat the work.
4.1
Case studied zero-energy building
The case studied building is a ETC - Climate positive multi-family residential building, built in Västerås. The tenants will be able to move in around April 2021. The building is a designed passive house following the FEBY 18, Gold specifications (etcbygg.se, 2021).
The technique used to build the ETC buildings have existed since 1700s. The new aspect to the concept is the level of comfort for the climate inside which is sustained with minimal energy supply and solar cells. The surplus derived from this concept is around 20% over a year. The material used for the frame, flooring and façade part of the building is wood, which in turn stores CO2. The isolation in the buildings is made of wood fiber.
4.2
Data
The data presented will be gathered from different input parameters, calculation and on-site measurements used for the real building which the building owner presents, e.g., FEBY gold energy calculations is presented. Refer to appendix 1, 2, 4, 5 and 6. If data for simulations are used, its presumed that the latter mentioned is use, if not the source will be illuminated.
4.3
Technical
In this chapter, different systems of the building, units and parameters that will be regarded in the simulation are presented. The aspects for solar, wind, ground source heat pump and district heating will also be discussed. Equations for the grids demand will be presented, providing the necessary functions and parameters.
4.3.1
Heating system
The heat system of the building will be of the geothermal kind. Multiple components such as accumulator tanks, expansion vessels, control valves and pumps are used for the system and are presented below. The CO2 equivalent will be to be 125 gCO2/kWh (naturvårdsverket, 2019)
Table 3 Geothermal heat pump parameters for the hot and cold side
Geothermal heat pump
Hot
side Cold side
Medium Water Ethanol/water
Effect 30 18 kW
Temp in 40 0 celsius
Temp out 55 -3 celsius
Flow 0,5 1,5 l/s
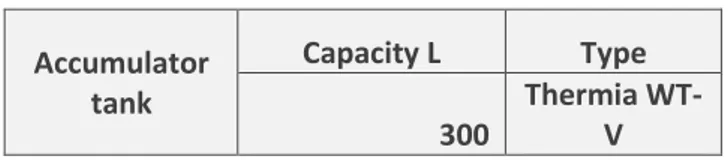
Table 4 Accumulator tank capacity and type
Accumulator tank Capacity L Type 300 Thermia WT-V
Table 5 Expansion vessel parameters
Expansion vessel
Type Armatec-AT 8321E-DE
Medium Ethanol/Water
Volume 50 l
Opening pressure 2,5 bar Expansion vessel
Type Armatec- AT 8321E-DE
Medium Ethanol/Water
Volume 80 l
Opening pressure 4 bar
Table 6 Pump specification
Pump Type Grundfos Magna1 25-80N, pressure controlled Medium Ethanol/Water Flow 0,44 l/s
Pressure set 65 kPa Pump
Type Grundfos Alpha2 25-80 130, pressure controlled Medium Ethanol/Water Flow 0,44 l/s
Pressure set 35 kPa Pump
Pump hot water circulation Type
Grundfos Alpha2 20-40 N, pressure
controlled
Medium Tap water
Flow 0,024 l/s
Pressure set 16 kPa
Table 7 Control valve specification with an acutator
3-way control valve with actuator Medium Ethanol/Water
Dim DN25
KVS 6,3
3-way control valve with actuator
Medium Tap water
Table 8 Shunt group specification
Shunt group - Heating coil
in the air handling unit Primary Secondary
Effect 14 14 kW
Temp in 55 30 celsius
Temp out 30 55 celsius
Flow 0,13 0,13 l/s
Present pressure
difference 15 kPa
Pressure drops in the
connecting object 1,8 kPa
4.3.2
HVAC system
The ventilation system of the house has fans supplying and extracting air through a counterflow heat exchanger. The system is also equipped with heating and cooling coils to reach the desired comfort of the building.
Table 9 Types of system channels System channels S Supply E Exhaust Air O Outside Air W Waste Air
Table 10 Air handling system parameters and specification
Air handling unit
Type REC Indovent - RT 3500
Size 3500
Basic Airflow S/E 545/545 l/s Forced Airflow S/E 545/665 l/s
Heat exchanger Counterflow Efficiency dry 89,5% Temp after VVX at
defrosting,min
10 celius
SFP 1,2 kW/(m3/s)
Table 11 Heating and Cooling coil parameters for the HVAC system
Heating coil apartment channel Size Amount 125 18 Air Water Type Aircoil - CH-W-125 Effect 1,2 1,2 kW Flow 35 0,02 l/s Temp in 17 55 celsius Temp out 45 40 celsius Pressure fall 29 5800 Pa Heating coil Air Water Type REC -NKV 1000X500-3 Effect 14 14 kW Flow 545 0,13 l/s Temp in -20 55 celsius
Temp out 0 30 celsius Pressure fall 17 1800 Pa Cooling coil Air Water
Type REC - OKW 1000X500-3 Effect 8,3 8,3 kW
Flow 545 0,44 l/s Temp in 27 10 celsius Temp out 19 15 celsius Pressure fall 17 2800 Pa
4.3.3
Solar panels
There will be a total of 218 panels installed, 85 installed on the west side, 83 installed on the east side and 50 panels installed horizontally on balconies and vertically on balcony railing. Each panel has an effect of 405W.
The data specifications for the solar module in the simulations will be assumed to follow a 405W shingled monocrystalline solar panel (se.dsnsolar.com, 2021). See appendix 3: Solar panels.
The amount of produced energy will be assumed to follow the climates total incident energy from the sun. The reference data will be from the middle part which is simulated through
Figure 7 Total incident solar energy annually. Source: Wall,