EMBEDDED INSTRUMENT PANEL FOR
CONSTRUCTION EQUIPMENT
June 7, 2012
Rickard Linder and Lars Lagerholm
linder.rickard@gmail.com, lars.lagerholm88@gmail.com
Volvo Construc on Equipment AB, Emerging Technologies
Supervisors:
Reno Filla, Volvo CE
Mats Björkman, Mälardalens Högskola
Examinator:
Mats Björkman, Mälardalens Högskola
IDT (Innova on, Design, Technology)
Mälardalen Högskola
Västerås, Sweden
Abstract
Construc on equipment such as wheel loaders and dumpers are constantly ge ng updated with new tech-nology when it comes to performance and fuel consump on. But the interior in the cockpit has not been exposed to any drama c changes for decades. A modernized cockpit gives the driver a more modern feel of driving a highly technological machine, while at the same me enables for personaliza on.
This thesis work presents a new way of improving the look and feel for displaying relevant informa on and also relaying informa on to both the driver of the machine and spectators outside. It includes a way of rerou ng CAN-bus signals from a construc on machine and displaying it on a tablet. The core idea with the solu on is to make it as modular as possible to further improve and be able to use it in any machine available at Volvo's disposal. With this in mind, any machine could use the same so ware, the same hardware and s ll be able to fully u lize all the features that have been implemented from the thesis work. The idea and implementa onal results are designed as partly embedded and partly towards user interface.
Table of Contents
1 Abbrevia on list 5 2 Introduc on 6 3 Background 7 4 Related work 8 5 Problem Descrip on 96 Analysis of the problem 11
7 Method 12
8 Research 14
8.1 So ware . . . 14
8.1.1 Analysis of opera ng systems . . . 14
8.1.2 iOS . . . 14 8.1.3 Android . . . 15 8.1.4 Windows 7 . . . 15 8.1.5 Symbian . . . 15 8.1.6 RimOS . . . 15 8.1.7 Decision . . . 16 8.2 Hardware . . . 16 8.2.1 Analysis . . . 16 8.2.2 Decision . . . 16 8.3 Android . . . 17 8.4 CAN-bus interface . . . 17 8.5 Router . . . 18 8.6 PC/Kvaser replacement . . . 18 8.6.1 LPC1788-32 developer's kit . . . 18
8.6.2 Mbed NXP LPC1768 development board . . . 19
8.6.3 Decision . . . 19
9 Design 20 9.1 First design of the system . . . 20
9.1.1 Hardware . . . 20
9.1.2 Master/slave configura on . . . 21
9.2 Second design . . . 22
9.3 Connec on . . . 22
9.4 Android func onality used in the system . . . 23
9.4.1 Display the result . . . 23
9.4.2 Layouts . . . 23 9.4.3 Bu ons . . . 23 9.4.4 Expandable list . . . 24 9.4.5 Sliding drawer . . . 24 9.4.6 Alert dialog . . . 24 9.4.7 Progress dialog . . . 24
9.5 Using mul ple units . . . 24
10 Implementa on 26
10.1 Overall system structure . . . 26
10.2 Graphical layout . . . 27
10.2.1 Layouts . . . 27
10.2.2 Mul -touch . . . 27
10.2.3 Hardware accelerated . . . 27
10.3 Impor ng database files . . . 28
10.3.1 Structure of a CAN-message . . . 28
10.3.2 Transla ng the informa on . . . 29
10.4 Dynamic crea on of graphical instruments . . . 30
10.4.1 Analog gauge . . . 30 10.4.2 Graph gauge . . . 30 10.4.3 Bar gauge . . . 32 10.4.4 Textbox gauge . . . 32 10.5 Internal structure . . . 32 10.5.1 Classes . . . 32 10.5.2 Threads . . . 33 10.5.3 Inter-Thread communica on . . . 33 10.5.4 XML layout . . . 33
10.6 Master slave configura on . . . 34
10.7 Communica on between CAN-bus and Tablet . . . 34
10.7.1 Ini al and first protocol . . . 35
10.8 PC/Kvaser replacement . . . 36
10.8.1 Hardware . . . 36
10.8.2 So ware design . . . 39
11 Tes ng and verifying 40 11.1 Tes ng using a CAN-bus simulator . . . 40
11.2 Tes ng the system in a real wheel loader . . . 41
12 Result 43 12.1 Ini al design . . . 43
12.2 Descrip on of the final system . . . 46
12.3 Final CAN-bus to Ethernet converter . . . 54
13 Problems and solu ons 57 13.1 First test in the wheel loader . . . 57
13.2 Version number handler . . . 57
13.3 Decoding messages . . . 57
13.4 Spontaneous program crashes . . . 57
13.5 Terminate program . . . 58
13.6 Network at Volvo . . . 58
14 Conclusions and discussion 59 15 Future Work 61 15.1 Send posi on of a new instrument . . . 61
15.2 Snap to grid . . . 61
15.3 Zoom . . . 61
15.4 Several main-screens . . . 61
15.5 Synchronize the tablet with a smartphone . . . 61
References 62
Appendix A Tablets comparison 63
Appendix B Wiring Diagram 64
Appendix C Mbed Source code 65
Appendix D Guide: Se ng up the system 67
D.1 Ge ng started . . . 67
D.2 Troubleshoo ng . . . 74
Appendix E Guide: Install and use Glass Cockpit on a device 75 E.1 Allow non-Market programs . . . 75
E.2 Install the program . . . 77
E.3 How to use the Glass Cockpit program . . . 80
Appendix F Guide: Se ng up the Android development tools 88 F.1 Downloading so ware's . . . 88
F.2 Installing the so ware's . . . 88
F.2.1 JDK (Java Development Kit) . . . 88
F.2.2 Eclipse Classic . . . 89
F.2.3 Android SDK (Android So ware Development Kit) . . . 91
F.2.4 ADT Plugin (Android Development Tool Plugin) . . . 94
F.3 Select pla orm . . . 103
F.4 Se ng up the emulator . . . 106
F.5 Create a new project in Eclipse . . . 109
F.6 Impor ng an exis ng project into Eclipse . . . 114
Appendix G Guide: Se ng up the Mbed development tools 116 G.1 Ge ng started with Mbed IDE . . . 116
1 Abbrevia on list
ADT Android Development Tools API Applica on Programming Interface CAN Controller Area Network
HMI Human-Machine Interface ID Iden fier
IDE Integrated Development Environment IP Internet Protocol
JDK Java Development Kit LCD Liquid Crystal Display LSB Least Significant Bit MPS Messages Per Second MSB Most Significant Bit PC Personal Computer PCB Printed Circuit Board SDK So ware Development Kit TCP Transmission Control Protocol UDP User Datagram Protocol UI User Interface
USB Universal Serial Bus WiFi Wireless Network
2 Introduc on
The interior of a wheel loader is not quite updated for today's digital world, so the idea with this thesis is to make the interior more modern and modular (possible to change during run me). The idea is to remove the old sta c gauges and replace them with an embedded instrument panel system. This enables the user to de-cide what instruments are important in the specific applica on. By having several such screens, even more informa on can be shown. From here on whenever this report might men on the term "Glass Cockpit", it is referring to this embedded instrument panel. This is as "Glass Cockpit" was the ini al project name for this thesis work.
It is also possible to enable communica on between tablets, so one tablet can be used for deciding what instrument to show and all the other tablets will then show the same gauges. This is perfect if you want to demonstrate a wheel loader. You can just hand out some tablets to the "audience" and one or more master tablets are used for defining what gauges to show. Then all visitors can easily see what happens in the wheel loader in front of themselves.
This pla orm is also good to use as a debugging tool. Since all signals are shown in real me and it is re-ally easy to change the defini on of the signals (just import a new database), the system is easy to modify for the specific applica on. The informa on from the CAN-bus are sent to the tablets by using WiFi, so no cables are needed to the tablet. That makes this pla orm portable.
In today's wheel loaders, if a third-party system is added, there are o en one or several separate small dis-play(s) added to the interior. If the user wants many different systems, the interior will be full of different screens and displays. When using Glass Cockpit, those separate systems can be easily integrated into the orig-inal screens.
Since all users probably do not like the same representa on of a signal, there are four different ways of showing all signals used in the machine. The signals can be shown as an analog gauge, bar gauge, graph view and text box. This makes it possible to choose what type of representa on of the signal is the best at the specific me.
3 Background
The thesis project is the final stage in the master of engineering program. The students included in this project are Lars Lagerholm and Rickard Linder, taking the master of engineering in Robo cs program at Mälardalens Högskola. With this project, the students should use the knowledge from the previous program and courses. The thesis is also the part where the student will get closer to the real working life. There are several important parts of the thesis that should improve the experience and knowledge for the students:
• Problem formula on • Research
• Design
• Implementa on • Tes ng and verifying
• Documenta on and presenta on
The operator environment in the working machines is outdated and needs to be refreshed. By having the old sta c gauges, the instrument panels can not be modified with simple measures. The idea behind this thesis is to improve the user interface and also make the interior more modular. With one or more digital displays, the user can easily modify what gauges to show and what gauges that are important for the actual applica on. This tablet will not only be an user interface to the people that are using the machines. It will also be used as a debug tool for the developers at Volvo CE. By having this tablet, one can very easily load new databases which specifiy the signals that are sent on the CAN-bus. This means that the tablet can be used to read any CAN-buses as long as a correct database is loaded. With this, any signal in the CAN-bus can be read with our solu on.
4 Related work
The "Glass Cockpit" term is usually used in aircra s where the old mechanical gauges are replaced with LCD-screens. By having a LCD screen, the instruments that are shown on the screen can easily be changed. Similar systems are described in [9] as well as in [16]. The gauges can be changed depending on the pilot's needs. With this in mind, this project is to implement the "Glass Cockpit" idea into construc on machines, like wheel loaders, dumpers and so on. The idea is to replace all mechanical and sta c gauges with a modular environ-ment where the user can choose what gauges to show and what gauges are important for the specific task at the moment. In the area of construc on equipment the inside of the cockpit have changed over the years. But looking at the instrument panels, it has looked rela vely similar throughout the decades.
The are some similar approaches that have been tested and in use at Volvo CE. One of have been described as just having a normal laptop PC in the cockpit. This PC will read the CAN-bus and display relevant informa on towards the user/driver. Another approach that have been evaluated is by using an ECU connected into the construc on machine. The ECU is of the same type described as a CAN-bus simulator in [Sec on11.1]. This ECU then records signals from the CAN-bus and writes appropriate informa on on a built in screen.
As the Glass Cockpit idea has not been implemented in working machines before. This project will take the interior of working machines a big leap forward, towards a digital and modular user interface.
5 Problem Descrip on
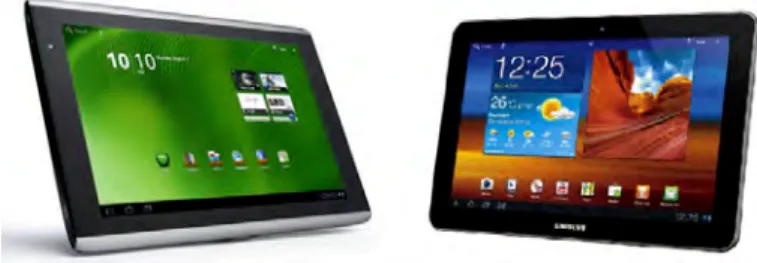
Construc on equipment are constantly being worked on in terms of upda ng them with new technology so it can always be compe ve on the market. But when examining the interior of any modern construc on machine, one can see that the design is quite conserva ve. This can be more observed in [Figure1] and [Figure
2]. By observing this, a layman might get the impression that the technology used, is not advanced enough.
Figure 1: Current opera ng environment in a wheel loader.
Figure 2: Current opera ng environment in a wheel loader.
There is a desired interest to update the opera ng environment so it could look more modern. With this there is a sugges on of implemen ng a Glass Cockpit system. A similar system that have been used in airplanes for many years, which can be seen in [Figure3] and [Figure4].
Figure 3: Glass cockpit used in airplanes, [11].
Figure 4: Glass cockpit used in airplanes, [1].
So the goal with this thesis project is to build a demonstra on environment where the instruments are one or two tablet PC's. For example iPad like devices that are well known to the market and thus have extensive development func onali es already built in. The tablet PC should somehow be able to read informa on from the construc on machines onboard CAN-bus and redirect it onto the tablets screen. The user interface of the tablet program should be similar to any smartphone applica on in today's market. With this it means it should have touch screen func onality with the desired drag and drop features. This is so that the user or driver can easily use the so ware as its func onality is similar like a standard smartphone/tablet.
In order to display informa on on the screen of the tablet PC's there is a much needed func onality that needs to be inves gated and solved. This is to be able to transfer the informa on signals that hold the values that the tablet should update on its screen. The informa on received is from a CAN-bus that uses the J1939 standard, so there must be some kind of layer that transfers the CAN-bus into the tablet PC.
6 Analysis of the problem
As can be seen in the previous sec ons, this project is all about to make a wheel loader look more modern. The idea is to use a "Glass Cockpit" system like in an airplane. That means that some kind of tablet or similar will be used in this project. The first job is to find suitable so ware to start the programming part. Also the hardware is really important. Since the hardware will be used in working machines, for example, the brightness for the screen must be good.
The programming part is the largest part of this project. To make the system more flexible to the user, WiFi connec on between different endpoints will be used. That means that the user does not necessarily need to be in the cabin to see the informa on about the machine. Also the graphical interface is really important, it must be easy to read and understand the informa on on the screen. Also to add and remove instrument and gauges must be a simple and fast forward procedure.
Because the informa on on the screen should be easy to read, the user interface must be good. That means that images and bu ons will be used and that means that the graphical elements in the tablet's opera ng sys-tem will be used. By having analog instruments, it should look quite the same as the old gauges. The benefit with a Glass Cockpit system is that the user can define which instruments to show. The signal should also be able to be represented in different ways, such as analog gauge, graph gauge (signal as a func on of me), bar gauge and text gauge.
It should also be possible to use several phones/tablets, some kind of synchroniza on must be used to en-sure that all data on all units are valid/updated. The configura on of what instrument to show can be specified on the different units, which means that data must be sent between the units.
Before the data from the CAN-bus can be sent to the other units, the data must be translated. By using the CANalyzer so ware which can define and create databases the signals can then be decoded. More about the CANalyzer so ware can be found in [Sec on9.6]. The important informa on about the signals that is read is: iden fier, starbit, length, formate, scale, offset, minimum value, maximum value and type. All this informa on can be found in the database file and must be imported into the phone/tablet before showing the signals. The impor ng part should be possible to do during run me.
7 Method
The first phase of the project was to examine the problems. A rough planning was also made during the first week of the project. The main points for this project were:
• Research about different opera ng systems and hardware's available on the market • Choose what hardware and so ware to use
• Buy and/or build required hardware • Programming the applica on
• Evaluate the system with selected test drivers • Conclusions and recommenda ons for future work • Documenta on and report
When the first rough problem was specified, the research phase began. The first thing was to examine which pla orm (so ware) to use. A er the so ware pla orm was decided, the research of what hardware to use began shortly a er. Since the hardware is dependent of the so ware, the selec on of hardware was lim-ited. Also the quality of the screen was really important because the tablet will be placed in a working machine, which then would get exposed to strong sunlight, cloudy weather and so forth. When all this was decided, it was a quick job to order the hardware and download and star ng to familiarize oneself with the so ware. Because the group members of this project never have worked with this kind of programming before, the sec-ond phase was to research about how to use the so ware. This part of the research has extended all through the project, especially intensive in the beginning of the project. Informa on about what development tools and API etc. was needed. Internet and especially the developing site have been of great help in order to achieve success with the developing of the system.
As the area of the thesis were computer science. The main focus were on programming and development of the system. The programming part were the main part of this project. All the programming for making the system running with wireless connec on between several endpoints and HMI (Human Machine Interface) were needed to be developed. Also the synchronizing part had to be solved, how the tablets should communicate with each other. The other main part was how to read the CAN-bus to get the informa on needed.
The tes ng phase has been all through the project, since all small part has been tested individually before integra ng it into the final system. With this method, bugs and errors could be found rela vely early on and therefore are solved quickly in the process.
In the end of the project, the system was demonstrated to see that the system works together. All systems were tested together to see that the system fulfilled out goals and specifica ons.
Through the project, the documenta on part was really important. The group members have been wri ng log book, which makes it easier to remember important steps during the development of the system. To make it easier to remember all important steps, the skeleton of the final report was created the first week. Through the project, the report have been updated and wri en when important things came up that needed to be added.
During the project, the students in the project had some mee ngs with the supervisor at Volvo. The meet-ings were to update the staff at Volvo and follow the development process. Also during the development process, the specifica on list has changed a few mes when new ideas popped up. Those ideas were discussed at mee ngs before those ideas were either implemented into to real program or scrapped in the research stage.
Mid-way through the project, the students of this project presented the result at a department mee ng. That was so the staff could see and test the Glass Cockpit program. At that me, the program was not quite finished, but the staff could see the result so far and come with ideas how to increase the func onality.
8 Research
8.1 So ware
8.1.1 Analysis of opera ng systems
Before star ng designing the system, a decision on what hardware and opera ng system was needed to be made. In the me of the thesis work there were a number of opera ng systems that were inves gated and that the team was able to choose from:
• iOs (Apple) • Android (Google) • Windows 7 (Microso )
• Symbian (Accenture/Nokia/Symbian) • RimOS (Research In Mo on)
The first thing to examine was how large the specific opera ng system was on the market, which opera ng system was the largest. This is shown in [Figure5].
Figure 5: Worldwide smart phone sales to end user by opera ng systems, [10].
As one can be seen in [Figure5], Android is the largest opera ng system for now. As also can be seen in [Figure5], Android is also the fastest growing opera ng system.
During the research stage on what opera ng system to use, the main points that can be found about the different systems are the following:
8.1.2 iOS Advantages
• Widely used opera ng system
• Good development environment and documenta on (as API etc.) • Simulator and debugging so ware available
• Coding and layout design in same window
Disadvantages
• Must have MAC-computer in order to develop so ware • Locked to Apple devices for usage
8.1.3 Android Advantages
• Widely used opera ng system • Emulator and debugger is available
• Can run the applica ons on different hardware's (from various manufacturers) • Very good documenta on on the Internet (API, forums and examples from Google) • Coding and layout in same window (with plugin)
Disadvantages
• Harder to set up development environment since you needs plugin's. Eclipse so ware with JDK, SDK and ADT plugin needed
• Might not be as stable as iOS, as it can be run on a big selec on of hardware's
8.1.4 Windows 7 Advantages
• Same development as on a normal Windows OS • Can run normal Windows programs (compa bility)
Disadvantages
• Hard to find good informa on on Internet (such as API) • Small market shares (in phone and tablets)
8.1.5 Symbian Advantages
• Widely used opera ng system
Disadvantages
• Not available in tablets
8.1.6 RimOS Advantages
• Widely used opera ng system
Disadvantages
8.1.7 Decision
The main opera ng systems to choose from were Android and iOs. Both systems have really good documen-ta on (such as API etc.) available on the Internet. Both systems have really good development tools with compilers, API, simulator/emulator included. The Android development tool is a bit harder to install than iOs development tool, but it is s ll quite easy nevertheless. The main downside with iOs is the opera ng system and development tool is hardware specific. That can be compared to Android that can be run on variety of hardware's.
Windows was not chosen because the small market shares (not much used in phones and tablets) and from what the team found, poor documenta on. Symbian was dismissed rela vely early from the list of usable sys-tems since this opera ng system is not used in tablets. The RimOS was not used because of that the system is specified to one type of hardware. This opera ng system has also much smaller market shares than the An-droid opera ng system.
By having all this in mind, the Android opera ng system was chosen. That is because Android is an open pla orm to use and as well a very fast growing opera ng system. When the Glass Cockpit was implemented, then one can easily change hardware and s ll be able to use the so ware.
8.2 Hardware
8.2.1 Analysis
Since the tablet will be used in wheel loader and working machines, a really good screen was needed. High resolu on and brightness is a really important factor that allows the screen to show the result in a good way. By searching on the Internet and reading specifica ons, two tablets were interes ng to use, see [AppendixA]. One was the Samsung GT-P7500 Galaxy Tab 10.1 and the other one was Acer Iconia Tab A501, see [Figure6]. The hardware used in all tablets is pre y much the same. It is the design and sizes that are the largest difference between the tablets. The main thing that made the Acer tablet interes ng was that the charger contact is separated from the USB-connector. That means that you can use the USB-connector at the same me as you charge the ba ery of the tablet. You can then use the USB-connector to communicate and drive external logic (that gets power from the USB-connector) on separate boards outside the tablet.
8.2.2 Decision
The Samsung GT-P7500 Galaxy Tab 10.1 is a very compact and powerful tablet. The main thing about this tab is the screen. The brightness of the screen and the touch response is really good. This tablet is also one of the most popular and best-selling tablets. The Samsung tablet also got really good reviews from companies and home users. Because of that, the Samsung tablet was chosen.
8.3 Android
A large part of the project was to find informa on how to use the opera ng system Android [13]. None of the group members of the project had worked with Android before. With this research on even the basic informa-on about the system was needed, such as how to create a new project, find informa informa-on about the API and methods to solve eventual problems.
The main part of research during this project was how to use WiFi in Android, drag- and drop, the user interface (bu ons and how to view objects) and touch-events. Another important thing that had to be researched about was how Android OS handled threading and parallelism. This led to more thoroughly research in these par c-ular fields. In addi on to threading there was also the need to research the way threads communicated with other threads. Even though these things were rela vely easy to grasp for the group members as the overall documenta on of Android is very good, there were s ll some things that took a while to grasp. The main things were that Android is an event based opera ng system. With this it means that the majority of the API that the programmer can use is driven by callback func ons. So the programmer does not have good understanding on what logic happens in the background un l the callback func on is called.
8.4 CAN-bus interface
All data that is needed for this project are available on the CAN-bus. To be able to read the data on the bus, some kind of interface was needed. In the beginning of the project, there were no major requirements of the hardware for reading the CAN-bus. The first unit used for reading the CAN-bus was the "Kvaser Memorator HS/HS", see [Figure7] and [12] for more informa on. This hardware was used because it were available within Volvo. The interface is good and the Kvaser was quite easy to use.
Figure 7: Kvaser Memorator HS/HS.
To be able to simplify the data transmission and reduce the number of nodes in the system (like the PC node), another kind of hardware was studied. The first idea was to have some kind of wireless version of the Kvaser. A er searching on Kvaser's webpage, the "Kvaser BlackBird SemiPro HS/HS" was found. With this hardware, you can configure the Kvaser using the USB-connector and connect it to a computer or router. The problem here was that the "Kvaser BlackBird SemiPro HS/HS" used TCP/IP protocol where as the desired choice were UDP protocol. This is as UDP just streams out data without caring about if messages are received correctly with acknowledges and such. More about the choice of UDP over TCP/IP can be found in [Sec on10.7]. The next idea was to use some kind of development board, so the board can be programmed to perform exactly what is required. With this, the size of the hardware should be drama cally reduced.
8.5 Router
Since this system will be used in a wheel loader and be portable, this size of the system is important. Because of that, the router should also be as small as possible. The research was to find a small router that is fast and have good range. There are many small routers available on the market, but many could be removed from the sugges ons list. One important thing that many of the small routers did not had was external antenna(s). The external antenna increases the range of the router. When this system is built into a box (CAN-reader and router), the antenna can easily be placed outside the box. This increases the range and quality of the signal. There were a few products found that fulfilled the specifica on list. A er some research, there were two main routers to choose from, Dovado Tiny [4] and Edimax 3G-6200nL [5], see [Figure8]. The downside with the Edimax was that it has limited numbers of connectors. The Dovado router is widely used and has good documenta on on the manufacturer web page. It also has good reviews on the web from users. Because of that, the Dovado router was chosen.
Figure 8: Le : Dovado Tiny, right: Edimax 3G-6200nL.
8.6 PC/Kvaser replacement
When the basic system was working, the next task was to replace the PC and Kvaser with something more com-pact. The idea was to find a development board that included processing power, CAN-interface and Ethernet interface. Some research to find a suitable hardware was made and there were two interes ng hardware's choices that were evaluated.
8.6.1 LPC1788-32 developer's kit
Simultaneous as our thesis were ongoing there were some development currently at Volvo to develop a new board, which could be also be used for the Glass Cockpit applica on. The architecture of the new board is similar to the LPC1788-32 board, and the programming is also similar to the LCP1788-32. This means that the LCP1788-32 board can be used for development and then just moved over to the new board when it has been constructed. That is why this board was interes ng to test. More informa on about the LCP1788-32 board can be found in [3].
Since Volvo had one of this development kit, there were some me spent to evaluate it. A er some more basic tes ng of the board, there were some problems to get everything to work. Generally speaking the team felt that this kit was quite hard to work with. Another big factor were also that due to uncertainty of the devel-opment of the new board, the team could not be certain on when this board would be ready for usage. There
was no hard deadline when this card should be finished. By having this in mind, the research con nued to find a suitable board that would make the team creates our system without being dependent on other peoples work.
8.6.2 Mbed NXP LPC1768 development board
The next board that was examined was the Mbed NXP LPC1768 development board, see [Figure9] and [14] for more informa on. It is a small board where you can add CAN and Ethernet connector with the addi on of premade breakout boards. The two connectors (CAN and Ethernet) are the connectors that have to be added to the board. To program this board, a high level API is used to make the programming part fast and easy. This was the mayor benefit this card supplied which brought the thesis groups a en on. As it is designed to be a "Rapid prototyping board" it was promised that the board could offer a fast and painless development me. This felt like the natural way for the thesis team members, as at the me of the decision there was not very much me le on the ongoing thesis project. With this board and the addi on of the breakout board the thesis team could then without much difficulty assemble the circuit boards together with a normal soldering iron. Compared to the "LPC1788-32 developer's kit" men oned above, this variant would be slightly bigger in physical size but as the team members inves gated it further, the size of an encapsulated box would be similar. As this box should contain everything needed for the embedded system, it could not be smaller than the already purchased Dovado router, which transfers Ethernet signals into WiFi.
Figure 9: Mbed NXP LPC1768.
8.6.3 Decision
Since the Mbed LPC1768 is deigned to be easy to use, small and having a well-documented feature list, this were the pla orm that was chosen by the thesis group. The biggest argument of choosing this par cular hardware were because it had as men oned a high level API with good documenta on and feature list. But it was also a big factor as the board developed at Volvo CE had no specific deadline on when it might be ready for use for the thesis group. As me was not something that this group had to spare, they decided to go with the Mbed LPC1768 rapid prototyping board.
9 Design
9.1 First design of the system
9.1.1 Hardware
The first design of the system can be seen in [Figure10]. The hardware used in the first design was: • PC
• Router (D-Link DI524) • Kvaser (Memorator HS/HS)
• Tablet (Samsung Galaxy Tab 10.1 GT-P7500)
A Kvaser is used for reading the messages from the CAN-bus of the wheel loader. The data that is received by the Kvaser is then sent to a computer (PC). The PC is used for sending data to the wireless router via WiFi using the UDP protocol. No manipula on of data is done during those two previous steps, everything that is on the CAN-bus is sent. The tablet is connected to the router and all data from the CAN-bus is streamed through the wireless network. The data is then filtered in the tablet to show the important data to the user.
9.1.2 Master/slave configura on
During the design-phase, there were a few configura ons discussed. By configura ons, it means that depend-ing on the state of the tablet, the permissions are different. It is dependent on the state of the tablet, if the state is master or slave. Some of the sugges ons are listed below:
Configura on 1 - Master configures, slave shows instruments
In this configura on, the master can be used for configuring what instrument to show, see [Figure11]. The slave is used to just show the (from master) specified instruments. The master cannot show instruments and the slave cannot configure what instrument to show.
Figure 11: Configura on 1.
Configura on 2 - Mirror master/slave
In the mirror configura on, the master and slave are able to add/remove instruments and show the selected instruments, see [Figure12]. In this configura on, the state does not affect the func onality of the program. The difference between the master and slave is that the master can broadcast messages for synchronize the visible instruments.
Figure 12: Configura on 2.
Configura on 3 - Master configures and shows instruments, slave shows instruments
The third configura on is that the master configure and show instruments, the slave just shows the instruments specified by the master, see [Figure13]. The slave can not specify what instrument to show.
Decision
By having those different configura ons, only one could be implemented. When discussed, configura on 3 was selected. In the Glass Cockpit program, Volvo wanted to have slaves that could be handed out to visitors. The visitors should not be able to change the instruments shown on the screen. The master on the other hand could be used by staff at Volvo to specify the signals to the slaves. In the configura on 3, the masters are also
Figure 13: Configura on 3.
able to view the instruments. That enables the master to watch the signals during run me. This specifica on was what Volvo wanted and is the configura on that was later on implemented.
9.2 Second design
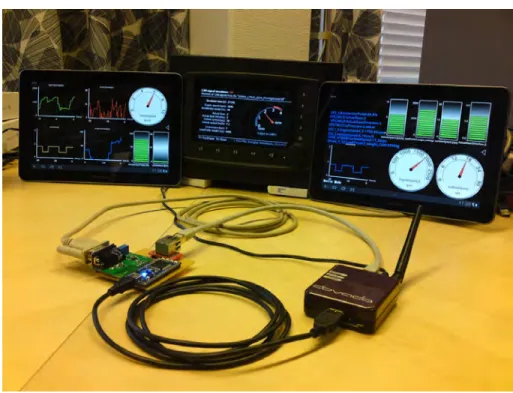
When this system was working, the next step was to op mize the hardware to be as small as possible. The size can be drama cally reduced if a purpose built hardware is used. By using a small router and replace the computer and Kvaser with something purpose built, the system will get more portable and easy to move around/install. This, together with a smaller hardware for replacing the PC would make a small and nice system, see [Figure14].
Figure 14: Second design.
9.3 Connec on
The connec on used between the tablets and the wheel loader is WiFi. For data transfer, the UDP protocol is used. The wireless connec on is used because the tablet will be used as a user interface as well as a debug tool. By having the unit wireless, the user does not necessarily need to be in the machine. The user can then be beside the machine while reading the CAN-bus. The limi ng factor in terms of range is the WiFi sending and receiving. In open terrain, the range is about one hundred meters with a standard antenna. The range can
easily be increased by having a larger antenna. However, a CAN link such as "CANlink BT" from RM [15] can be used to transport CAN signals wireless via bluetooth. Such a device already existed at Volvo CE and could then open up the possibility for transferring signals up to a range of 250 meters. But as the informa on researched about Android showed more posi ve in usability about WiFi. This was the mayor reason for the decision about using WiFi with UDP protocol.
9.4 Android func onality used in the system
9.4.1 Display the result
To show the result from the CAN-bus, some kind of user interface was needed. In [17] there are some ideas on how to create a working GUI for displaying CAN-bus signals. So with this, the team began doing more extensive research on how to print images on the screen as well as be able to drag the objects around. To be able to show analog instruments, the simplest way of showing, for example the engine speed, is to have a two sta c pictures and rotate the pointer. The pictures are split into two separate layers, the background layer is "fixed" (actually imported once from the database file) and the top layer is rotated according to the data received. To be able to fulfill the goals, two different methods were found. One method was to use "Drawables" and one method was to use "Canvas". Both methods support drag and drop and also the needed layer handling.
Drawables
The drawables support all that is needed for this project. The nice thing about drawables is that those can be printed out in a "View", for example an "ImageView", which makes the handling of pictures really simple. When this method was implemented, one problem occurred. It was possible to print the pictures in layers, drag and drop worked, but the rota on of a single layer was hard to achieve. Therefore, the Canvas method was inves gated.
Canvas
Canvas is the second method that can handle mul ple layered pictures. This method is more complex than drawables and also harder to use. Instead of print out the pictures in a "View" as with the drawables, Canvas uses "layouts". When implemen ng this method, some problems with defining the height and width of the layout were found. A er some researching and reconstruc ng, this problem could be solved. Because all of the func onally that was needed for this project was working, this method were used for the further development.
9.4.2 Layouts
Several different layouts are used in this system to split the screen into different fields. The linear layouts are used for areas where the elements inside should be aligned in a linear way. The rela ve layout are used when the developer, for example, want to set the absolute posi on of a bu on or textview. The rela ve layout and frame layout are also used when you should be able to free drag objects on the screen, the linear layout cannot be used in this case.
9.4.3 Bu ons
Bu ons are used as a link between the user and the so ware. This support in Android is really extensive and well documented. It is also easy to use different types of bu ons in the opera ng system. The ini al design of the system consisted mostly out of "ImageBu ons", which means that you can easily specify how the each bu on should look like. You can use an image as a background in an imagebu on. In the final design this is not the case any longer as the finalized design uses the more standardized bu ons as well as the expandable list that are described below.
9.4.4 Expandable list
An expandable list is used for showing the available messages from the specified database. The expandable list is a good way of showing much informa on, whereas the informa on can be separated into a group and sub groups. The message name itself defines the group of the list and the signals define the subgroup. By having this system, it is much easier for the user to quickly find the actual signal.
If the list gets too long to be shown on the screen (or the layout where the expandable list is defined), a scroll view is automa cally created, allowing the user to scroll in the list.
9.4.5 Sliding drawer
The sliding drawer is used for showing the configura on window. The user can easily switch between the main screen and configura on screen by dragging this window. This window will slide if the user drags the icon to expand the window or just clicking at the icon.
9.4.6 Alert dialog
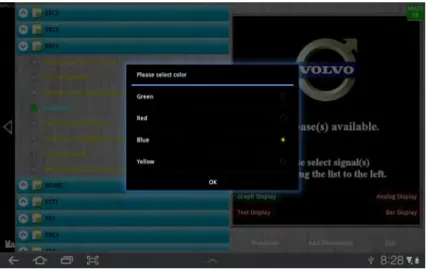
To show what databases that are available, an alert dialog is used. This dialog will be focused when it is shown and the user cannot click any other bu on outside this window. In this dialog, all the files that are available are shown and the user can choose mul ple databases to import at the same me.
9.4.7 Progress dialog
If the database that the user has selected is large, it may take some me to import the database. When the database is imported, the process dialog pops up and tell the user to wait. By having this pop up dialog, the user has to wait because the pop up window blocks the user from pushing any other bu on.
9.5 Using mul ple units
By having several physical units interconnected in the system, more instruments can be shown at the same me. One ini al idea was to have one tablet and one phone. The phone can then be used as a configura on unit, were the user can change gauges and instruments. The good thing about this system is that the user pro-file can be stored in the phone. It does not ma er what machine the user uses, the phone will automa cally load the current user profile. The database of what instrument to use is stored in the phone and then uploaded to the tablet.
The second idea was to have several tablets in the system. The tablets should be able to have two states, master and slave. The master tablet can show and configure what instrument and/or gauges to be displayed/removed to/from the user. The master also sends out broadcast messages to all other tablets (both master- and slave tablets) what instrument to show or delete. It is possible to have mul ple master units in the system at the same me. To enable this, version control is needed to tell which message is the newest.
The slave tablets are listening to the broadcast messages and show/remove the instruments that the broadcast messages tell the tablet, depending on the master tablet(s). The user can look at the signal list if the database is loaded, but the slave cannot add any signals to show. It is only the master that can add new signals.
9.6 Import informa on from database file
At Volvo, a program called CANalyzer is used for reading and working with the CAN-bus. This program is also used for crea ng the database files, that specifies the signals used in the system. There are standard defini ons available to define signals, but any customized new signals must be added by hand into the CANalyzer program. Therefore, the Glass Cockpit system should be able to import files that are created from CANalyzer.
Since the informa on that is shown in the graphical instruments are created dynamically, the informa on used are imported from the database file. The database file specifies the name, unit and range of each individual signal. If the user wants different characteris cs for the signals, the user can easily change the database file and upload it to the tablet. Then the new ranges or names are used in the tablet.
The informa on about the CAN-messages and signals can also be separated into separate files. The system supports mul ple readings from different database files. This enables the user to import different databases during run me. However due to the protocol of the instrument handling, the user can not remove databases during run me. In order to remove loaded databases the user is forced to restart the program.
10 Implementa on
10.1 Overall system structure
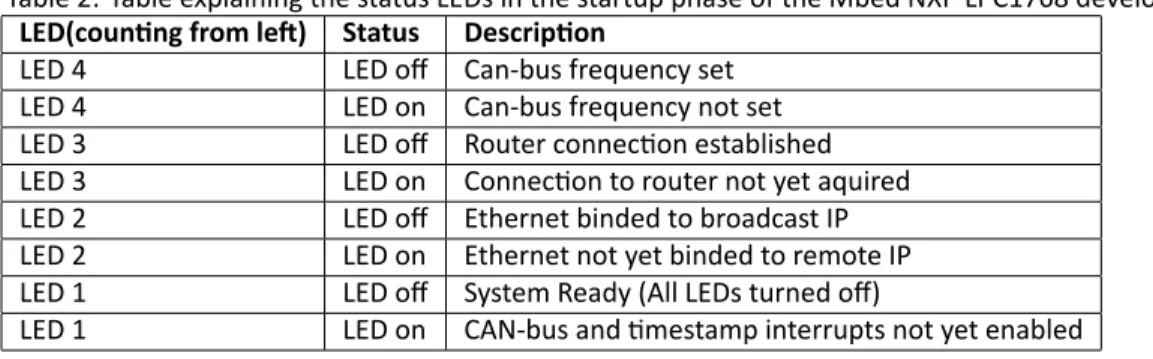
The overall system is can be abstractly described as in [Figure15]. As one can see in the men oned figure there are a few groups that are painted similarly. What this means is that they are either a same thread or that they are different threads doing similar system tasks. The following table gives a short explana on to all of the specific blocks that are shown in [Figure15].
1. Main: The main handles all UI updates and crea on/removing of visual gauges.
2. CAN-Receiver: A thread that handles receiving of UDP CAN-messages as well as doing basic filtering. 3. Master Broadcast: A thread that creates and transmits packages to remote tablets.
4. Slave Receiver: A thread that receives incoming packages from remote tablets. 5. Remote Tablet: A separate tablet in the system.
6. Graphical Instruments: These are divided into four parts that handle their respected visual gauge. • Text gauge
• Bar gauge • Analog gauge • Graph gauge
Figure 15: Abstract descrip on of the overall system.
10.2 Graphical layout
10.2.1 Layouts
To structure the graphics, some kind of graphical layouts were used. On the start screen, there is a triangle on the right side of the screen. This triangle serves as a handle and can be moved by touch. By dragging or pushing this handle, the configura on screen is shown on the screen. This layout that the configura on screen is devel-oped on is called a "slidingdrawer" in Android. It enables the user to drag a new layout on top of the first layout. On the configura on screen, there are several different layouts. There is an expandable scroll list (called ex-pandablelistview in Android). This list stores all different messages and signals that are shown to the user in the form of clickable grouped bu ons. The groups are sorted by CAN-message and the sub groups are the signals within the messages. This view is specified in the XML-file. When an instrument or gauge is added to the screen, an indicator is changed to show the user what is currently visible on the screen. Also the currently selected signal is shown to the user (the color of the text is changed).
There are also some simple push-bu ons for adding instruments of the desired messages and signals. These instruments are graphs, analog gauges, bar gauges and textboxes. There are also bu ons for adding databases as well as exi ng the program. When a graph, analog gauge, bar gauge or textbox is added, the bu on changes its color to indicate what gauge is currently on the screen. The color is reseted if the instrument is removed from the screen. There is also one invisible bu on that changes the state between master and slave mode. This bu on is implemented so that the user must hold the bu on ac vated for one second to make the tablet change state. That ensures that unauthorized persons are not able to change the state of the tablet, this can be found later on in [Figure41].
Pop-up windows are used to inform the user that they should ac vely select something, since the pop-up win-dow blocks everything in the background. This is used for example when to choose a graph interval or import a database. This is to ensure that the user makes a choice before con nuing with something else. When the user should wait, for example when a large database is imported, a wai ng dialog will appear on the screen. This dialog serves like a loading screen and also blocks the user from doing something else un l the complete database has been loaded. When this pop-up window appears, a new thread is created to handle this window. This is to get the round bar to spin smoothly. When the impor ng of the database is done, the thread is termi-nated.
A message counter is also included to show the user the number of incoming messages per second (MPS). This is to give the user an es ma on on how good the signal strength is. This counter is located in the top le corner of the screen and shows the messages per second (MPS) that are arriving into the tablet. A value of 0 indicates that there are no messages received by the tablet.
10.2.2 Mul -touch
All instruments and gauges that are added to the screen are all added into separate layouts. By having this sys-tem, the instruments and gauges can be "drag and dropped" independently. This also means that mul -touch is available, which in the Samsung tablet is limited to ten different objects that can be moved simultaneously.
10.2.3 Hardware accelerated
When the program was ini ally tested with all func onality added and especially a er the graph instruments had been implemented, the system felt a bit slow and the response when the user dragged objects on the screen was a bit sluggish. With this, it was decided to try to find ways to increase the performance of the system. The ini al thought were to enable the hardware accelera on that for some reason were turned off by default. As a result the speed was drama cally increased and the system got a very smooth feeling to it. With
this, other ideas for op miza ons were scrapped at this stage. Hardware accelera on in generally increased the feeling and handling of the system, as well as the usability.
10.3 Impor ng database files
10.3.1 Structure of a CAN-message
To define the signals used in the CAN-bus, some kind of database defini on of the signals had to be used. Volvo CE had the so ware "CANalyzer" as company standard for CAN-bus management. Then it deemed fit to use this program to export database files (.dbc). The database files are imported into the Glass Cockpit system to define the signal specifics. When trying to import a database, a pop-up window (called alert dialog in Android) is displayed to make it easy for the user to specify which database(s) to import. In order for the Glass Cock-pit so ware to locate the database files, the user is needed to create a copy of the database file on the flash memory of the tablet. There is a specific folder called "Database" which is located in the root directory of the tablet. If this for some reason does not exist, the user is requested to create such a folder. A er this has been done the user should be able to locate and import database files into the Glass Cockpit program. To do so the user simply need to press the "Add Database(s)" bu on and all files located in the "Database" folder should be listed there. The user can then easily choose which database(s) to use.
A message defini on can look like this, see [Figure16]:
Figure 16: Example of a defini on of one message.
The defini on of the message that the system use are as you can see in [Figure17]: 1. Defines the start of the message
2. Defines the message ID
3. Defines the name of the message
Figure 17: Defini on of a message.
The defini on of the signal that the system use are as you can see in [Figure18]: 1. Defines the start of the signal
3. Defines the start bit of the signal 4. Defines the length of the signal
5. Defines what type of signal it is, @1 is Intel type (li le endian) and @0 Motorola type (big endian). + is unsigned and - is signed
6. Defines the scale factor and offset of the signal value
7. Defines the minimum and maximum value of the signal (for display use only) 8. Defines the unit of the signal
Figure 18: Defini on of a signal.
10.3.2 Transla ng the informa on
To be able to translate a signal, the database must first be imported. The database files are imported as a stream of characters. The character stream is then iterated through in order to collect all the necessary informa on that the program need to successfully decode CAN-messages. When the data is stored for the specific signal, the bu on of that signal is created in the scroll list. The informa on extracted from the database is stored as the following:
• Descrip on name • Startbit
• Length
• Format (small/big endian) • Format (signed/unsigned) • Scale • Offset • Minimum value • Maximum value • Type
The incoming signal from the CAN-bus is a byte-string and the first thing to do is to translate those bytes into bits. When the message is a bit-string, we can then use the informa on from the database to translate the message. When the informa on is imported, the incoming signals can be translated and the user can read the result.
10.4 Dynamic crea on of graphical instruments
There are four different ways of displaying a single signal: • Analog gauge
• Graph gauge • Bar gauge • Textbox gauge
All graphical elements are created during run me. A background image is used for each instrument gauge (which means that a few different images are loaded) to represent all the signals. The text and numbers of the scales are taken from the database file and all of the gauges are scaled depending on the defini ons of each signal from the database file. All graphical elements are placed in separate views (layouts) which enables that the separate graphical elements can be moved independently.
10.4.1 Analog gauge
The images that are being used for the analog guage can be seen in [Figure19]. All the informa on that are displayed is created dynamically depending on the informa on extracted from the database.
The handle is rotated depending on the scale factor and offset which are specified in the database file. Those values are used to calculate the degree of rota on so the analog gauge is showing the correct value to the user. The background is a sta c image and it is only the handle that is rota ng during run me.
There are six values printed out in the gauge, minimum value, maximum value and four values with equal range in between. To get the radius of the text, the Android func on "drawTextOnPath" are used, where the text is printed onto a specified path.
Figure 19: Two different images used for the analog gauge.
10.4.2 Graph gauge
In the graph view, one image is loaded, [Figure20]. The black background is added in this picture just to show the white axis, the background which in [Figure20] is displayed as black, is transparent in the program. As men-on before, all the informa men-on displayed in the graph is loaded directly from the database in order to specify the axis and names. See [Sec on12] for images of the fully loaded and func onal gauge instruments. In order to create a graph instrument the user must first press the graph view bu on. The first thing to appear on the screen will then be a pop-up window. The user is then asked to specify the interval for the X-axis in
seconds (5s, 10s, 30s or 60s). When this is done there will be displayed another pop-up window that asks the user to specific the color of the graph. When that is specified, the graph is printed out on the screen with the specified X-axis interval. The update frequency and number of points are dependent on the X-axis me. The text is calculated one me and stored in a bitmap which makes the update faster, since the text is does not need to be calculated every me.
The X-axis interval is the me that is shown in the graph. In order to get a fluent response of the graph gauge, there was a need to keep it upda ng regularly depending on the X-axis. This was solved by have the graph gauge as a separate thread. The period me of the thread were tested during the development process to see what period me should be used. The update frequency of the thread can be calculated from the period me of the thread: 1/(Period me). Also the number of points to be displayed in the graph can be calculated: (Period me of thread)/(X-axis interval me). The Y-axis includes three values. The values printed out are min-imum value, maxmin-imum value and average value. The minmin-imum and maxmin-imum values are imported directly from the database file and the middle value is calculated during run me. The name and unit of the graph is also imported from the database file.
To be able to print the points and lines at the right posi on, a local coordinate system was created. The coor-dinates are stored in a list that holds the translated value from the signal. When the graph is printed out on the screen, the list is iterated through for each update. When a new value is read, the first element in the list is deleted and the new value is added last in the list. This gives the "scrolling" view with the newest value to the right in the graph. In [Table1] it is displayed the different choices the user can select for each graph. It also shows the period me, update frequency and as well the number of points the graph handles with each interval me.
Table 1: Table showing the different op ons that the user can choose for the graph instrument.
X-axis interval me [s] Period me of thread [ms] Update frequency [ mes/s] Number of points
5 20 50 250
10 27 37 370
30 56 18 536
60 100 10 600
10.4.3 Bar gauge
As with the other gauges, the text is created out of informa on from the database file. There are two images loaded, one background and one green bar, see [Figure21]. The incoming value is then translated to calculate a percentage of the value. This percentage value is then used to calculate the number of green bars to print to the screen. There is one equa on to define where all green bars should be printed, depending on the number or bars to print. As with the graph gauge, three different values are printed out on the "Y-axis", which is the minimum value, maximum value and the calculated average value.
Figure 21: Two different images used for the bar gauge.
10.4.4 Textbox gauge
The textbox gauge is a bit different compared to the other gauges. This is because there is no customized visual interface created for this gauge. The textbox is just an Android implemented view that the program displays. In Android this view is called TextView, which is the ones the program u lizes.
Just as the other gauges, all informa on is taken from the database file and this informa on is needed in order to provide the program to decode the message into the correct values. These values are then simply wri en to the textbox gauge. The textbox will then have the name of the gauge (imported from database file) as well as the latest decoded signal data. The value has of course been translated using scale factor and offset (as defined in the database file) before it is shown on the screen.
10.5 Internal structure
This sec on will try to describe as abstractly but also as in detailed as possible. The general structure can be described as it is divided into different classes depending on what can be shown on screen. The program also has different layouts that define on how everything is placed and adjusted for displaying a nice looking graphical interface. The program has been divided into a series of threads to fully u lize the processors scheduling capabili es.
10.5.1 Classes
The general design is constructed to be class oriented. For this, the program has a set of classes that each has a very specific roll in the system. These rolls can be for example handling the prin ng of data in the graphical views. Other classes that exist are bu onclasses, classes that handles the threads, classes for interthread com-munica on as well as data storage classes.
Storage classes
There are a set of storage classes built into the program. The most important storage classes are the ones that keep track of the data specific details that are needed to show the interes ng informa on to the screen. These values are updated from the database upon a successful import of the database by the user. Ini ally the database values are stored on the bu onclass that is used to select a bu on to be shown to the screen. When an instrument is being loaded to the screen via the bu ons, the informa on from the bu ons is being copied into another storageclass that keeps track of the specific values of the instruments shown only on the screen. So then the program will always keep track of what is being displayed on the screen as well as the specific parameters for each unique instrument. These values will later be used for upda ng each of the instruments at its appropriate me.
Graphical view classes
The main func onality for the whole system is to show CAN-bus informa on on screen with a series of different types of graphical instruments. For this, the program is needed to have some kind of structure for handling these kinds of specific tasks. The answer for this was to create an unique type of class for each different kind of visual instrument. So as the program has four different types of graphical instrument to be able to display, the program itself has four different types of classes. When the user wants to display an instrument onto the screen the program will create a new instance of the correct class that represents the specific instrument. The class will then contain all the informa on needed in order to create and maintain the instrument on screen. Each class is designed so that the incoming data from the CAN-bus is updated correctly depending on the specific characteris cs given from the imported database that has been done early in the program run cycle.
10.5.2 Threads
The program has been divided into a minimum of five threads. The threads are designed to handle a separate task in order to u lize parallelism within the Android hardware. Of these five threads there is only one thread that is not designed to handle ingoing or outgoing wireless communica on from the tablet. These threads are either handling incoming CAN data communica on or the Master-Slave communica on. So in general the threads are built to take load of the processors main thread. The main thread in the system is designed to only handle the graphical handling of the screen. As in general, there is only one thread that is allowed by the system to keep updates of the graphical display on screen. So with this in mind the program have the main thread only to keep track of adding, removing and upda ng instruments to screen. As described previously, there is a minimum of five threads. This is because of the graph instrument is designed to be a separate thread in order to have a periodic update. So the number of threads that are running in the system will increase with the number of graphs displayed on the screen.
10.5.3 Inter-Thread communica on
In order to fully communicate with the separate threads within the system, the program have been designed to use Handlers. A Handler is an Android specific class that allows the threads to send messages between a sender and a receiving threads message queue. A Handler can generally be described as some kind of mailbox/mail-slot communica on system that exists in the Windows and Linux opera ng system. With this communica on there is no need to have shared variables that then need to be protected by semaphores or mutex's. Some of the threads also have an internal interrupt so they are only ac vated upon a received message. Therefore the processor does not need to waste processing power on something that will not be of use for the moment.
10.5.4 XML layout
The development in Android gives the programmer the ability to construct a basic or more advanced predefined graphical layout wri en in XML. This program has been design so that it u lizes the basics of XML
program-ming into the overall design. With this the program could easily get a simplified basic graphical layout. The more advanced func onality was then added on top of the already placed XML layout. There is also one more important file that are of importance, the AndroidManifest.xml. This file is used to set permissions for the applica on. It is also used to set the logo and name of the applica on etc.
10.6 Master slave configura on
Since the master/slave configura on was required, some kind of communica on between the units was needed. This was solved by using a UDP broadcast protocol that, upon request sent out a synchroniza on message to all the nodes in the network. The size of the synchronizing message is 512 bytes, which gives the system ap-proximately 85 different signals that can be represented in the synchronizing message. Each signal can have up to four kinds of graphical representa ons. That means that the total number of instrument that can be synchronized is 85x4 = 340 graphical instruments. For example we can have 85 different instruments that read different CAN-messages, but all of these 85 instruments can have four kinds of graphical displays.
In the current system, the maximum theore cal number of nodes (tablets) is 253 nodes. This is because the broadcast message is sent on addresses 192.168.0.1 to 192.168.0.254. 192.168.0.255 is used to specify broad-cast.
The broadcast message is defines as [Figure22] shows and the following dot list explains the figure: • Byte 0: Counter
• Byte 1: Version number • Byte 2: CAN id
• Byte 3: CAN id • Byte 4: CAN id • Byte 5: Start bit • Byte 6: Bit length
• Byte 7: Type of instrument, Graph period me, Graph color
Figure 22: Defini on of the broadcast message.
The counter is used to specify the number of instrument to add. The version number specifies the version number of the specific broadcast message, to tell the other tablets if this is a new or an old message. CAN-id is the iden fier of the CAN-message. Start bit defines the start bit of the specified signal and bit length the length of the signal. Instrument type defines what kind of instrument to add (analog, bar, graph, textbox). It also specifies the period me and color if the graph view is added (since the period me is defined by the master).
10.7 Communica on between CAN-bus and Tablet
The external communica on that is being used in the system is UDP over WiFi. UDP protocol is used because then the system does not care about if messages are being received and so forth. With this the program can then just send away its informa on and never care about if it were received or not. This was a trade-off that
was decided early in the research stage of the thesis work. As with receiving the CAN messages from the CAN-bus the program never needs to care about incoming messages's order and such. So the system just treats the all incoming messages the same, no caring about acknowledgments and mestamps or anything like that. The main reason for this choice were, as this is system is only for displaying signals and their values. So the program never needs to verify that the signals were correct in any way. As if there would occur that a mismatched or corrupt message were received, the display of the signal would merely get a "hiccup". And in result there would be a faulty reading from that message. But as the applica on is designed towards displaying informa on for a human, this defect might be easily spo ed and therefore ignored.
10.7.1 Ini al and first protocol
The communica on from the physical CAN-bus was as previously men oned in this report, a Kvaser Memorator module. This module was used in the ini al and first design of the CAN transi on area used in this thesis work. The Kvaser module receives CAN messages and retransmits the messages into a computer program. This program later repacks the message into a UDP data packet as described in [Figure23].
Figure 23: Descrip on of ini al CAN-message datagram packet.
[Figure23] describes how many bytes the transmi ng packet consists of, as well as which bytes are handling the data field of the CAN-message and which bytes are the ID of the message. The packet is divided so that byte 0-7 contains the 8 bytes of data that a CAN-message can maximum consists of. These are added "as is", which means that the bytes are appearing in the exact same way as they are appearing on the physical CAN-bus. So there is no modifica on on the actual data that is being redirected from the CAN-bus. On the ID bytes on the other hand, there has been a slight modifica on in the UDP packet compared to the ID's transferred on the CAN-bus. In the ini al design, the ID bytes have been slightly changed compared to the ones on the CAN-bus. The UDP packet consists of only 3 bytes, whereas the CAN message contains 4 bytes of ID. This is because of an op miza on done in the transfer protocol as a results from problems described in [Sec on13.1]. The protocol then could be op mized by one byte as it would anyway just be filtered out in the tablet otherwise. So the so ware program then filtered out the MSB byte of the ID sequence from the CAN-message. And in result it just got the three remaining bytes for packaging to the UDP transmit packet. The ID sequences are constructed as the lowest values are to the far right in the datagram packet in increasing order towards the le . Note that this only applies for the three ID bytes as the databytes are the same as from the CAN bus. With this the ID are divided as the MSB byte is byte number 8. And the LSB are byte 10, with byte 9 as in between.
10.8 PC/Kvaser replacement
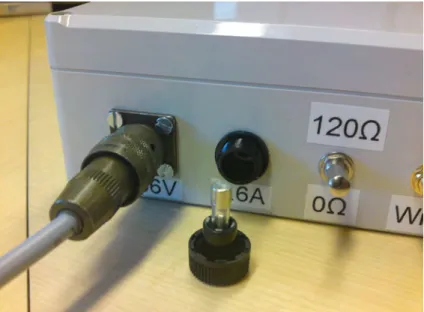
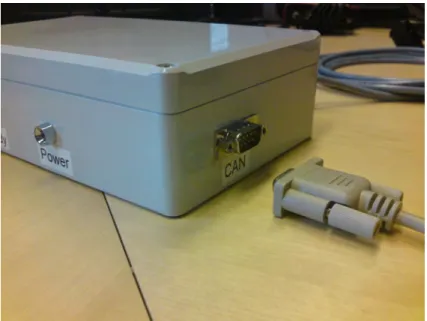
10.8.1 Hardware
The hardware used is the Mbed NXP LPC1768 development board, see [Figure24] for more informa on about the pin configura on. With this hardware, the user can add Ethernet and CAN-connectors to be able to handle those kinds of signals. The first task was to solder the new boards to the development board. All this electronics is soldered to a prototyping board (Phenol hard-paper) to get a stable surface to a ach all three boards.
Figure 24: Mbed NXP LPC1768 pin configura on.
Overview
A complete list of parts needed for running this system is: • Mbed NXP LPC1768 development board
• CAN-bus breakout board
• Ethernet connector (RJ45 Ethernet MagJack) • Ethernet PCB (RJ45 Ethernet MagJack Breakout) • Break Away Headers
• Prototyping Board (Phenol hard-paper) • Router (Dovado Tiny)
• WiFi cable • WiFi antenna
• Voltage regulator (XP POWER - JTK1524S05) • Switch (Termina on resistor)
• Fuse holder with fuse
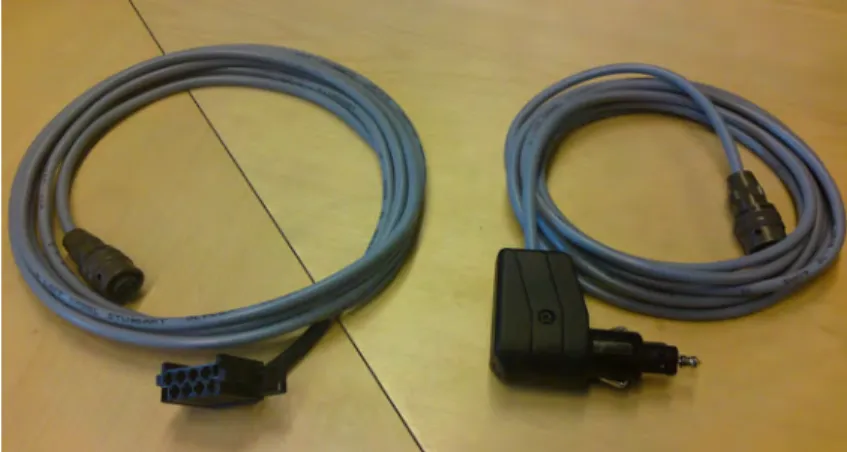
• Power in (Cable and connector) • DSUB9 (CAN in)
• Ethernet cable
• CAN-bus cable (DSUB9 connectors) • USB cable (Type A to Type Mini) • Two LED's
• Resistors (two 170ohm and one 100ohm) • Transistor (NPN)
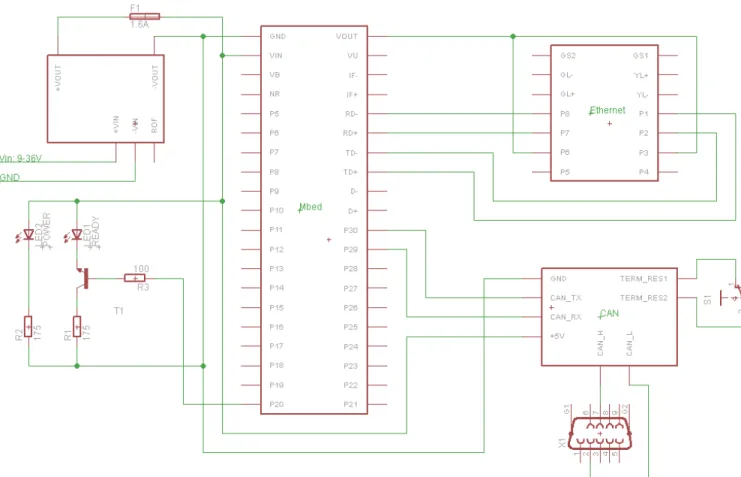
The Mbed development board is connected to the CAN-bus board and the Ethernet board, see [Appendix
B] how the system is wired. The break away headers are used to solder the breakout boards to the Phenol hard-paper, making a stable and robust pla orm. When all this is correctly connected (described later in this sec on), the embedded system can be connected to the router for distribu ng the signals from the CAN-bus. An Ethernet cable is used to connect the embedded system to the router. The USB cable is used to program the Mbed development board. The voltage regulator is used to power the embedded system. Finally the CAN-bus cable is used to connect the embedded system to the CAN-bus to read signals. To start up the complete system, see [AppendixD].
CAN-bus connector
The CAN-bus connector is a separate board with some electronics to translate the CAN-signals to the develop-ment board, see [6] for more informa on. There was some documenta on which pins to use. The first task was to solder the "Bridge Configura on" to enable right pins in the DSUB9 connectors. The CAN-breakout board should be in "CAN Analyzer" mode which means that the three bridges should be soldered in the right hand side, see [Figure25].
Figure 25: Solder bridge configura on.
Next step is to solder the CAN-bus breakout board to the Mbed NXP LCP1768 board. The pin-configura on is as can be seen in [Figure26]. Note that the silkscreen on the CAN-bus breakout board is incorrect. In normal cases in a CAN-bus, you connect TX to TX and RX to RX. On this board the text is wrong and if you check the drawings, you can see that the silkscreen is wrong. Connect the pins as [Figure26] and the board should work.