REAL-TIME CHARACTERIZATION OF
FUEL BY NEAR-INFRARED
SPECTROSCOPY
Quantitative measurements of moisture content, ash content, heating value,
and elemental compositions in solid biofuel mixtures.
ALI AHMAD SHAHNAWAZI
KAJSA EDLUND
School of Business, Society and Engineering
Course: Examensarbete energiteknik/Degree
Project in Energy Engineering
Course code: ERA403 Credits: 30 hp
Program: Master of science in engineering -
Energy Systems
Supervisor: Jan Skvaril Examiner: Eva Thorin Costumer: MDH Date: 2021-06-29 Email: asi16002@student.mdh.se aliahmad.kh93@yahoo.se ked15002@student.mdh.se kajsaedlund@hotmail.se
ABSTRACT
The global energy demand supplies mainly from fossil fuels, which is neither sustainable nor environmentally friendly and aims to global warming. Therefore, both more investments in renewable energy sources such as bioenergy are required, as well as new technologies such as carbon capture and storage (CCS) to handle the emissions from existing combined heat and power (CHP) plants. In this degree project, the focus is to determine the moisture content, ash content, heating value, and elemental compositions of solid biofuel mixtures in real-time by utilizing the optical technique of near-infrared (NIR) spectroscopy. A total number of 150 samples of solid biofuel mixtures were prepared and illuminated by NIR light. All spectra of the samples were recorded in a wavenumber range of 12000 cm-1 – 400 cm-1 in a dish on a turn
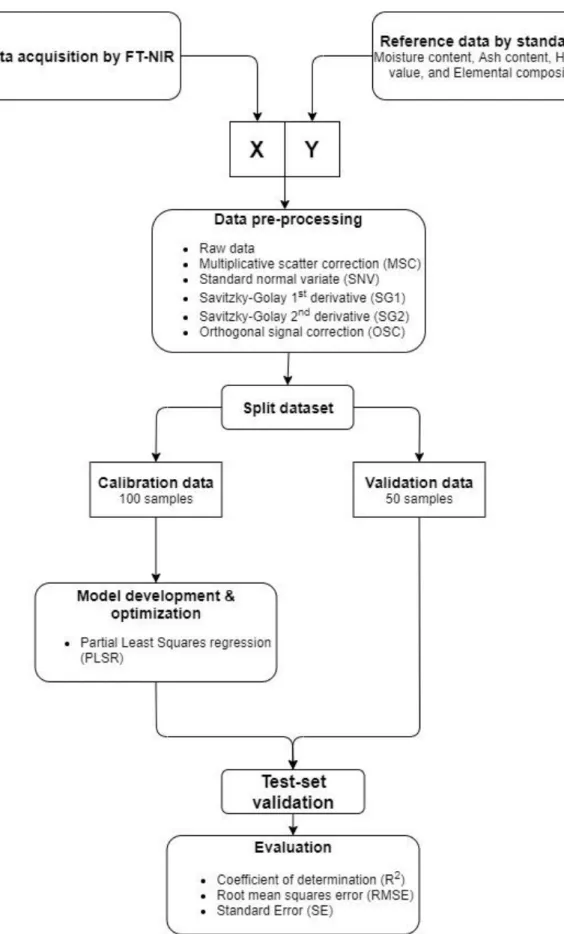
table which was in a moving mode with a speed of 0.5 m/s. Each sample was scanned three times to avoid, or at least minimize the deviation of the spectra and the samples were mixed between each scan to get more reliable representative spectra data. Partial least square regression models were created to analyze the spectra data. A data split was done randomly, 100 for calibration and 50 for validation. Then the data was pre-processed with different methods including multiplicative scatter correction (MSC), standard normal variate (SNV), Savitzky-Golay 1st derivative (SG 1st), Savitzky-Golay 2nd derivative (SG 2nd), and orthogonal
signal correction (OSC) to reduce noise and scatter effect. The results of NIR spectra treated by OSC method obtained 𝑅2, RMSE and SE of 0.900, 2.241 and 2.204, respectively for prediction of moisture content, 0.424, 0.913 and 0.922 for prediction of ash content, 0.640, 0.370 and 0.368 for prediction of heating value, respectively. The obtained prediction of 𝑅2, RMSE and SE were 0.687, 0.066 and 0.058 for nitrogen, 0.636, 0.361 and 0.364 for carbon, 0.483, 0.269 and 0.270 for hydrogen, respectively. As the results shows, these models to predict the ash content and hydrogen content has a lower accuracy than what is expected in process modeling while the prediction of moisture content has the highest accuracy.
Keywords: NIR, spectroscopy, solid biofuel mixtures, moisture content, ash content, heating value, elemental composition, boiler, CHP pant, CCS, CO2, emissions
PREFACE
This degree project was a part of the program Master of Science in Engineering with focus on energy systems at Mälardalen University in Västerås, Sweden, during the spring 2021. The work was also a part of the RENAISSANCE research project held by Dr. Jan Skvaril at Mälardalen university. Furthermore, this work is also linked to the research project ‘AI assisterad koldioxidinfångning i biomassabaserade kraftvärmeverk’ (Projektnr: 51592-1). The support from Energimyndigheten is acknowledged.
We would like to give special thanks to our supervisor Dr. Jan Skvaril for his support and guidance throughout the whole project. His expertise and knowledge contributed a lot, and he made this work a great experience for us. We also want to thank Robert Tryzell for his help with the laboratory equipment at the university. Lastly, we would like to thank Professor Eva Thorin, our examiner of this work, for her feedback and suggestions on the thesis.
Västerås, June 2021
SUMMANFATTNING
Det globala energibehovet levereras främst från fossila bränslen som varken är hållbara eller miljövänliga och som bidrar till global uppvärmning. Därför krävs det både mer investeringar i förnybara energikällor så som bioenergi såväl som nya teknologier som koldioxidavskiljning och lagring (på engelska: carbon capture and storage, CCS) för att hantera utsläppen från befintliga kraftvärmeverk. Koldioxidavskiljning och lagring kan också kombineras med bioenergi för ytterligare reducering av koldioxidutsläpp. Biomassa är ett förnybart bränsle som kan balansera den förnybara energimixen som levereras huvudsakligen från vind- och solkraft. Kraftvärmeverk är en effektiv teknik för användning av bioenergin.
Syftet med detta examensprojekt är att demonstrera den potentiella användningen av optiska spektroskopisensorer för realtidkarakterisering av egenskaper i fasta biobränsleblandningar och se hur de egenskaperna (fukt-innehåll, ask-innehåll, värmevärdet, och elementära kompositioner) kan påverka energiomvandlings processer. Ytterligare så utvärderas det om nära-infraröd spektroskopi som har en stor potential att förutse elementära kompositioner av fasta biobränsleblandningar i realtid ska kunna förbättra och stödja Koldioxidavskiljning och lagrings teknologier. Detta arbete avgränsas till 150 prover med blandningar av olika typer av fasta biobränsleblandningar: flis, bark, och sågspån. Bränslets elementära kompositioner avgränsas till bara kol, kväve, och väte. Proverna belystes med nära-infrarött ljus och spektra av proverna registrerades i ett vågnummerområde av 1200 cm-1 – 400 cm-1. Under skanning
så placerades proverna på ett rörligt bort med en hastighet på 0,5 m/s för att täcka hela proven. Varje prov skannades tre gångar för att minimera avvikelser för spektra data.
Partial least square regression (PLSR) modeller skapades för att analysera den uppmätta
spektra data. Datauppsättningen delades slumpmässigt in i två delar där 100 prover valdes för kalibrering och 50 prover valdes för validering. Därefter förbehandlades all data för att minska oljud och spridningseffekter, olika typer av metoder användes inklusive multiplikativ spridningskorrigering (MSC), standardnormalvariat (SNV), Savitzky-Golay första derivata (SG 1st), Savitzky-Golay andra derivata (SG 2nd), och ortogonal signalkorrigering (OSC).
Resultatet för denna studie visar att NIR-spektra som har behandlats med OSC erhöll bra modeller med värden för 𝑅2, RMSE och SE av 0.900, 2.241 och 2.204; 0.640, 0.370 och 0.368; 0.687, 0.066 och 0.058; 0.636, 0.361 och 0.364 för förutsägelse av fuktinnehåll, värmevärde, kväve-innehåll och kol-innehåll. NIR-spektra som behandlades med SG 1st erhöll modeller
med värden för 𝑅2, RMSE och SE av 0.424, 0.913 och 0.922; 0.483, 0.269 och 0.270; för förutsägelse av innehåll och väte-innehåll. Dessa modeller visar att förutsägelse av ask-innehåll och väte-ask-innehåll har en lägre noggrannhet än vad som förväntas i processmodellering medan förutsägelse av fukt-innehåll har den högsta noggrannheten.
Nyckelord: NIR, spektroskopi, fasta biobränsleblandningar, fukthalt, ask innehåll, värmevärde, elementär komposition, panna, kraftvärmeverk, CCS, CO2, utsläpp
CONTENT
1 INTRODUCTION ...1
1.1 Background ... 1
1.1.1 The application of near infrared spectroscopy (NIRS) ... 2
1.1.2 Wood as solid biofuel ... 2
1.1.3 Carbon capture and storage (CCS) ... 3
1.2 Purpose/Aim ... 3
1.3 Research questions ... 3
1.4 Delimitation ... 4
2 METHODOLOGY ...5
2.1 Literature review ... 5
2.2 Experimental data acquisition ... 5
2.3 Model calibration and validation ... 5
3 LITERATURE STUDY ...7
3.1 Fluidized bed combustion in CHP plants ... 7
3.1.1 Bubbling fluidized bed boiler ... 7
3.1.2 Circulating fluidized bed boiler ... 7
3.1.3 Combustion of solid biomass ... 9
3.1.3.1. STOICHIOMETRY AND ELEMENTAL COMPOSITIONS ...9
3.1.4 High moisturized solid biomass combustion ...10
3.1.5 Ash-related issues ...10
3.1.5.1. BED AGGLOMERATION PROBLEM ... 10
3.1.5.2. SLAGGING AND FOULING ... 11
3.1.5.3. CORROSION ... 11
3.1.6 Countermeasures ...11
3.1.7 Carbon capture and storage in CHP plants ...12
3.2 NIR Spectroscopy ...13
3.2.1 Basic principle of NIR spectroscopy ...14
3.3 Chemometrics ...16
3.3.2 Validation ...17
3.4 Utilization of NIR spectroscopy ...19
4 CURRENT STUDY ... 21
4.1 Experimental work ...21
4.1.1 Sample preparation ...21
4.1.2 NIR spectra measurement ...21
4.1.3 Moisture content ...22
4.1.4 Ash content ...23
4.1.5 Calorific (heating) value ...24
4.1.6 Elemental composition ...26 4.2 Chemometrics ...26 5 RESULTS ... 31 5.1 Data pre-processing ...31 5.2 Moisture content ...33 5.3 Ash content ...34 5.4 Heating value ...36 5.5 Elemental composition ...37 5.5.1 Nitrogen ...38 5.5.2 Carbon ...39 5.5.3 Hydrogen ...40 6 DISCUSSION... 43
6.1 Evaluation of the samples and experimental work ...43
6.2 Result discussion ...43
6.3 Fluidized bed combustion in CHP plants ...44
6.3.1 Evaluation of moisture- and ash content ...45
6.3.2 Challenges with deployment of CCS ...46
6.4 Socio-economic and environmental impact of this study ...47
8 SUGGESTIONS FOR FURTHER WORK ... 49
REFERENCES ... 50
APPENDIX 1 SAMPLE PREPARATION
APPENDIX 2 THE RESULTS OF REFERENCE VALUES
LIST OF FIGURES
Figure 1 A simple schematic of a circulating fluidized bed (CFB) boiler, edited by the authors, used with permission. ... 8 Figure 2 Absorption bonds in the NIR region and a typical spectra of solid biomass sample,
used with permission. ...14 Figure 3 Picture of the FT-NIR setup and its equipment, used with permission. ...21 Figure 4 Pictures of some of the biofuel mixtures samples used in the experimental work
before grinding (left) and after grinding (right). ... 22 Figure 5 Picture of some of the grinded samples in aluminum trays after drying. ... 23 Figure 6 Picture of some of the samples in porcelain dishes with ash ... 24 Figure 7 a) bomb and its accessories, b) bomb calorimeter and water handling system, and c)
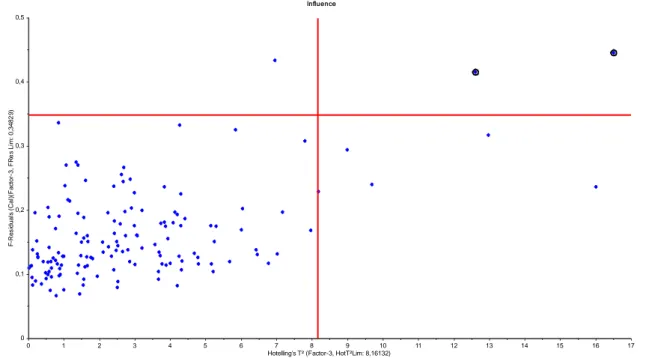
bomb calorimeter ... 25 Figure 8 Line plot of the acquired raw spectra from the FT-NIR measurements ... 26 Figure 9 Example of an influence plot with two marked potential outliers in the upper right
corner. ... 28 Figure 10 Example of Martens Uncertainty Test, the left plot is with important variables
being marked and the right plot is recalculated with the unmarked variables
downweighed... 29 Figure 11 A flowchart describing the chemometric approach of this work. ... 30 Figure 12 Line plots of the acquired spectra after being pre-processed with different
techniques, a) MSC b) SNV c) SG 1st derivative with 7 smoothing points d) SG 2nd
derivative with 19 smoothing points. ... 31 Figure 13 Line plots of the acquired spectra after being pre-processed with OSC a) moisture
content b) ash content c) heating value d) Nitrogen e) Carbon f) Hydrogen. ... 32 Figure 14 Cross-validation results for the PLSR model pre-processed with OSC for moisture
content presented in a Predicted vs. Reference plot. Blue represents the calibration and red represents the cross-validation. ... 33 Figure 15 Prediction ability results for the PLSR model pre-processed with OSC for moisture
content. ... 33 Figure 16 Cross-validation results for the PLSR model pre-processed with SG 1st derivative for
ash content presented in a Predicted vs. Reference plot. Blue represents the
Figure 17 Prediction ability results for the PLSR model pre-processed with SG 1st derivative
for ash content. ... 35 Figure 18 Cross-validation results for the PLSR model pre-processed with OSC for heating
value presented in a Predicted vs. Reference plot. Blue represents the calibration and red represents the cross-validation. ... 36 Figure 19 Prediction ability results for the PLSR model pre-processed with OSC for heating
value. ... 37 Figure 20 Cross-validation results for the PLSR model pre-processed with SG 1st derivative
for Nitrogen presented in a Predicted vs. Reference plot. Blue represents the calibration and red represents the cross-validation. ... 38 Figure 21 Prediction ability results for the PLSR model pre-processed with SG 1st derivative
for Nitrogen. ... 38 Figure 22 Cross-validation results for the PLSR model pre-processed with OSC for Carbon
presented in a Predicted vs. Reference plot. Blue represents the calibration and red represents the cross-validation. ... 39 Figure 23 Prediction ability results for the PLSR model pre-processed with OSC for Carbon.
... 40 Figure 24 Cross-validation results for the PLSR model pre-processed with SNV for Hydrogen
presented in a Predicted vs. Reference plot. Blue represents the calibration and red represents the cross-validation. ...41 Figure 25 Prediction ability results for the PLSR model pre-processed with SNV for
Hydrogen. ...41
LIST OF TABLES
Table 1 Summarized calibration, cross-validation, and prediction results for all the created PLSR models for moisture content. ... 34 Table 2 Summarized calibration, cross-validation, and prediction results for all the created
PLSR models for ash content. ... 36 Table 3 Summarized calibration, cross-validation, and prediction results for all the created
PLSR models for heating value. ... 37 Table 4 Summarized calibration, cross-validation, and prediction results for all the created
PLSR models for Nitrogen. ... 39 Table 5 Summarized calibration, cross-validation, and prediction results for all the created
PLSR models for Carbon. ... 40 Table 6 Summarized calibration, cross-validation, and prediction results for all the created
NOMENCLATURE
Symbol Description Unit
𝐴𝑑 Ash content on dry basis [%]
𝐸 Energy level [J]
h Planck constant [Js]
𝑙𝑜 Access air [mole/kg fuel]
𝑚 Mass [g]
𝑀𝑎𝑟 Moisture content as received [%]
𝑀𝑑 Moisture content on dry basis [%]
Υ Frequency [s-1]
q Heating value [MJ/kg]
Φ The air moisture ratio [mole/mole]
ABBREVIATIONS
Abbreviation Description
AFI Ash fusibility index
µm Micrometre
BECCS Bio energy with carbon capture and storage
BFB Bubbling fluidized bed
BioSNG Biomass substitute natural gag
BMP Biochemical methane potential
CCS Carbon capture and storage CFB Circulating fluidized bed
CHP Combined heat and power
cm Centimetre
CO2 Carbon dioxide
DW Dry weight
FB Fluidized bed
FG Flue gas
FBC Fluidized bed combustion
FT-NIR Fourier transform – near infrared
HSI Hyperspectral imaging
𝑅2 Coefficient of determination
RMSE Root mean square error
m/s Meter per second
MIR Mid infrared
MLR Multiple linear regression
mm Millimetre
mg Milligram
MSC Multiplicative Scatter Correction
MWth Megawatt thermal
NIR Near infrared
NIRS Near infrared spectroscopy
nm Nano meter
OSC Orthogonal signal correction PAT Process analytical technology
PC Principal component
PCA Principal component analysis PLSR Partial least square regression RPD Residual prediction deviation
SE Standard error
SG Savitzky-Golay
1
INTRODUCTION
This degree project is a part of the RENAISSANCE project at Mälardalen University. This degree project focuses on the application of real-time characterization of material flows (in this case, moisture content, ash content, heating value, and elemental compositions of solid biofuel mixtures) by implementing near-infrared (NIR) spectroscopy. Furthermore, the study focuses on how the solid biofuels moisture and ash-related issues can affect the boiler, CO2 emissions, and carbon capture and storage techniques in a combined heat and power (CHP) plant.
1.1 Background
The global energy demand supplies mainly from fossil resources such as oil, coal, and natural gas, which are neither sustainable nor environmentally friendly. Using such fuels can increase the concentration of CO2 in the air, which consequently, leads to climate change and global warming (Dincer and Rosen 1999). About 81% of the total global energy supply originate from fossil resources and about 14% from renewable resources, of which 70% coming from biomass (Popp et al. 2021).
In order to stop global warming, more investments in renewable energy sources are required, as well as new methods and technologies. That be able to characterize the biofuel properties in real-time such as optical spectroscopy, but also handle the emissions from existing combined heat and power (CHP) plants such as carbon capture and storage (CCS). Which has the potential to play a crucial role toward climate change target (Bui et al. 2018). Raza et al. (2019) provide a deeper insight into the CCS technologies and how the CO2 will be captured and stored to stop global warming.
Biomass is used by converting its chemical energy into other forms of energy like heat by wood-burning, or it can be used indirectly in carbonization or ethanol production (de Oliveira Matias & da Silva Catalão, 2018). As a sustainable fuel, biomass is the energy source that can balance the renewable energy production in a renewable energy mix that supplies mainly from wind and/or solar power. CHP plants is an efficient technology for utilizing bioenergy (Pääkkönen and Joronen 2019).
Several different vibrational spectroscopic techniques have the same basic physical origin; they can observe the absorption bands in the MIR, NIR and Raman spectra of the chemical components because of molecular vibrations (Siesler, Ozaki, Kawata, & Heise, 2008). To efficiently utilize biomass as a bioenergy source, some methods/techniques are required to analyze the matter compounds in real-time. In this case, the focus is to determine the moisture- and ash content, heating value, and elemental compositions of solid biofuel mixtures in
real-time by implementing an optical technique to detect and recognize the chemical bands’ vibrations in the near-infrared (NIR) region.
1.1.1 The application of near infrared spectroscopy (NIRS)
A rapid and inexpensive optical method to characterize the properties of materials is the spectroscopic analysis in the light spectrum’s near-infrared spectral region. The near-infrared (NIR) spectroscopy is a non-destructive method widely used for quality control, analyzing, determining, and evaluating the physio- and chemical properties in pharmaceutical industries in line, online and real-time (Shawky and Selim 2019; Patel 2017; Ziémons et al. 2010). In the food industry, Grassi and Alamprese (2018) and Pu et al. (2020) studied the potential of NIRS implantation in process analytical technology (PAT) to improve the quality of the products and the efficiency of the processes.
In recent years, the NIR spectroscopy method was utilized in energy conversion processes; Skvaril, Kyprianidis, and Dahlquist (2017) reviewed the applications of NIRS in biomass energy conversion processes. Sirisomboon, Funke, and Posom (2020) developed a mathematical model to apply the NIRS technique instead of bomb calorimetry and gravimetry in order to assess the gross- and net calorific value (higher and lower heating value) of bamboo chips; Feng et al. (2018) applied NIRS hyperspectral imaging (HSI) combined with chemometrics to online predict the properties of pellets.
In order to have a stable combusting operation in a boiler, a method/technology that provides a rapid, proper and continues knowledge about the fuel properties will be needed before it feeds into the boiler. NIR spectroscopy is a method that has been proven to be a reliable and non-destructive, and rapid method that has a great potential to determine the properties of biofuel, system optimization, advanced control etc. (Skvaril, Kyprianidis, and Dahlquist 2017). Posom, Maraphum, and Phuphaphud (2020) used NIR spectroscopy to evaluate wood chips’ elemental compositions and found a desirable performance in predicting carbon, hydrogen, and nitrogen.
1.1.2 Wood as solid biofuel
Wood is one of the most used materials globally and can be used for different purposes; one common purpose is energy use. In 2002, over 1.8 billion cubic meters of wood was used as fuel which accounted for over 54% of the world’s wood consumption. Trees are mainly divided into two groups, coniferous and broadleaved. Coniferous usually grows in temperate climates while the broadleaved thrive in a more tropic climate (de Oliveira Matias & da Silva Catalão, 2018). The chemical composition of the wood is the main parameter that will decide the quality of the fuel. Varying chemical composition is dependent on the species of tree and where it grows; other factors like used fertilizers and pesticides, handling and processing, or in the manufacturing process for wood chips and pellets where waste wood materials are being used
contaminated by other materials like dust, dirt, and soil. In general, wood consist of 45 to 50% carbon, 40 to 50% oxygen, around 6% hydrogen, less than 1% nitrogen, and traces of inorganic elements. Contaminated wood can have a negative impact on the environment when it is being combusted due to particulate emissions and ash disposal. The ash content in wood is usually between 0.5 and 3% dry weight (DW) (Chandrasekaran et al. 2012).
1.1.3 Carbon capture and storage (CCS)
Carbon capture and storage is a technology that can reduce the CO2 emissions that are emitted
to the atmosphere from fuel combustion and industrial processes; the technology can also contribute with negative emissions, which means that CO2 can be taken from the atmosphere
directly or that the CO2 comes from processes that is bio based (“IEA” n.d.). According to Raza
et al. (2019), the CCS technology can reduce the global CO2 emissions with 17% by 2050. There
are mainly three stages in CCS; the first stage is to capture and separate the CO2, this can be
done with various technologies. The second stage is the transportation of the CO2, this can also
be done by different methods, and one cost effective way is through pipelines. Furthermore, the last stage is storage and monitoring; the CO2 can be stored at various sites; two examples
are deep aquifers and active or depleted oil/gas reservoirs. Monitoring the CO2 during and after
injection is necessary to ensure that it is migrating and remaining confined in the storage for a long time.
1.2 Purpose/Aim
This degree project’s primary goal is to demonstrate the potential use of optical spectroscopy sensors for real-time characterization of properties in solid biofuels mixture, and see how the properties (moisture content, ash content, heating value, and elemental compositions) will affect the energy conversion processes.
Furthermore, evaluating if NIR spectroscopy which has the potential to predict the elemental compositions of solid biofuel mixtures in real-time can enhance the carbon capture and storage technologies by providing information in advance about the percentage amount of each element of biofuels. For instance, adjusting the required air or chemicals in combustion processes to get cleaner flue gas for CCS application in CHP plants to mitigate the CO2 emissions.
1.3 Research questions
The following research questions will be addressed in this work:
• What are the potentials and limitations for implementation of NIR-spectroscopy sensors in CHP plants?
• What accuracy can be achieved by the NIR-spectroscopy technique in real-time characterization of properties (moisture content, ash content, heating value, and elemental composition) of solid biofuels mixture?
• How will the properties of interest affect the energy conversion processes where the technique is implemented?
1.4 Delimitation
In this study, the experimental work was conducted in the laboratories at Mälardalen University. 150 samples of different solid biofuel mixtures were used; the types of biofuels were: wood chips, bark, and saw dust. The moisture content, ash content, heating value, and elemental compositions of the samples were considered to be the properties of interest. The elemental compositions included only Carbon, Hydrogen, and Nitrogen; Sulphur was excluded due to its low concentration in the samples.
For the modelling part of this work, Principal component analysis and Partial least square regression were used and five different data pre-processing techniques, including: Multiplicative Scatter Correction, Standard Normal Variate, Savitzky-Golay first derivative, Savitzky-Golay second derivative, and Orthogonal Signal Correction; these methods were chosen due to being some of the most common ones in the field of chemometrics.
Further, the thesis is limited to only give an overview of boilers and carbon capture and storage (CCS) technologies, and not deepening in detail.
2
METHODOLOGY
All necessary procedures to perform the theoretical, experimental, and analytical work of this thesis are presented in this chapter.
2.1 Literature review
In order to get a deeper understanding and to be more familiar to the application of near-infrared spectroscopy in the energy conversion field, a literature review was conducted. The literature study included ash-related issues and countermeasures in fluidized bed combustion (FBC) boilers, elemental compositions, and the possibilities of CCS implantation in power/CHP plants. The previous studies were important since they provided additional relevant information and knowledge in the area with similar focuses. Gathering of this relevant information and knowledge was essential to understand the utilization of NIRS in the energy conversion field. To find right and relevant information for the thesis, the online libraries of Mälardalen University was utilized. Databases such as Google Scholar, Science Direct, Diva, ResearchGate etc. were regularly used. Keywords such as near-infrared spectroscopy, solid biofuel, moisture content, ash content, ash-related issues, heating value, elemental composition, boiler, combined heat and power plant, carbon capture and storage, CO2 emissions were used for the search engine to find the right scientific papers.
2.2 Experimental data acquisition
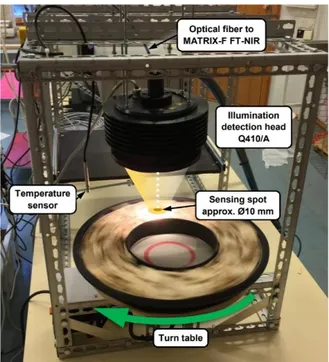
NIR spectral data were acquired by using Fourier transform-NIR (FT-NIR) spectrometer with an illumination head that was fixed around 17 cm over the samples on the rotating board with a speed of approximately 0,5 m s-1 and the sample was illuminated at a point between the center
and edge of the dish. The rotation speed of the board and the fixed light were due to enable the replication of the actual movement of solid biomass (in this case, solid biofuel mixtures of wood chips, bark, and sawdust) on a conveyor belt. Every time when starting up the software program of NIR spectrometer, before scanning the samples, a background scan (white scan) is needed as reference spectra. The temperature of the ambient air in the spectra laboratory during spectra acquisition was 20+1 °C.
2.3 Model calibration and validation
Two machine learning algorithms have been used to create models from the acquired experimental data. Two of the most common algorithms were chosen including: Principal component analysis (PCA) and partial least square regression (PLSR). Before model calibration, the raw data was pre-processed; the following pre-processing methods were used: Multiplicative Scatter Correction, Standard Normal Variate, Savitzky-Golay first- and second
derivative, and Orthogonal Signal Correction. The models were validated by using full cross validation and test set validation.
All data pre-processing, model calibration and validation were conducted in the Unscrambler software by Camo analytics; Unscrambler is an easy to use tool for modelling, prediction, and optimization, and is commonly used for NIR spectroscopy data (“Unscrambler | Camo Analytics” n.d.).
3
LITERATURE STUDY
This chapter presents a literature study with relevant theoretical information and knowledge from previous studies that is needed to analyze the experimental part of this work.
3.1 Fluidized bed combustion in CHP plants
Since the 1970s the fluidized bed combustion (FBC) has been in favor and mainly used to incinerate solid fuels in combined heat and power (CHP) plants to produce heat and electrical power. Thanks to the fluidized bed (FB) unit that makes it possible to convert the chemical energy from solid fuels with different origin (from different types of solid biomass to coal and municipal solid waste as well as mixtures of them) into thermal/electrical energy through combustion in these boilers (Martinez Castilla et al. 2020). This flexibility makes FBC more applicable to use one type or mixtures of solid fuels as feedstock, depending on the fuels’ price and availability. The BFC boiler principle is that the solid particles behave like fluid in the bed with the aim of the injected gas from below that flows through it. Due to low environmental impact and high flexibility, the FBC indicates as one of the most promising energy conversion technologies (Khan et al. 2009). Generally, fluidized bed boilers are divided into two categories, bubbling fluidized bed (BFB) and circulating fluidized bed (CFB) boilers.
3.1.1 Bubbling fluidized bed boiler
The BFB combustor is operating with a lower fluidization velocity (approximately 1 - 3 m/s) and utilizes for smaller heat and power generation applications with common sizes of around 10 – 300 MWth (Malmgren and Riley 2012). Usually the access air is employed in three stages,
primarily air is introduced at the bottom, secondary air is introduced at the splashing zone, and tertiary air is introduced further higher up (at free board) and is well distributed through the entire boiler (Khan et al. 2009). Due to the absence of recycling devices in BFB boilers, the design is simplified and have lower capital and operating costs. But the point is that the absence of recycling process unable the recycling process of the collected solids back to the lower bed which leads to less material is elutriated. On the other hand, the BFB boilers have the ability to use fuels with high moisture, such as sewage and industrial sludge, peat, and sawdust with a significantly high percentage of moisture (Wheeldon and Thimsen 2013).
3.1.2 Circulating fluidized bed boiler
The CFB combustor boiler is the predominant type of the FBC boilers that is used for heat and power generation. The CFB boiler is constructed with a main loop composed of a riser, separator, and loop seals where the two-phase solid-gas chemical reaction occurs. The primary fluid mechanism inside the furnace is categorized into two parts, the lower- and the upper part. The lower part, called dense zone, is the bubbling bed and upper part, called freeboard, is the suspension zone (Yue et al. 2005; Y. Zhang, Li, and Zhou 2016). Y. Zhang, Li, and Zhou (2016) mentioned in their book that the CFB is the updated version of the BFB boiler, in other words,
the second generation of the fluidized bed with a higher gas velocity (approximately 3 – 5 m/s) that allows the solid particles to move freely from the bed into the riser, but enough particles return to the bed to maintain the uniform temperature distribution through the furnace. CFB boilers generally have higher efficiency than BFB boilers because of higher fluidization velocities (Khan et al. 2009). Due to the flexibility of fuels and reduction of emissions with CFB boilers, Zhu (2013) suggests that the flexible fuels allow CFB boilers to easily combust fuels with different qualities and sizes but also have significantly lower emissions of NOx and Sox without any additional expensive device for the flue gas emissions control systems. It is due to lower operating temperature (800 – 900 °C) in CFB boilers which in pulverized coal combustion (PCC) boiler is significantly high (1300 – 1700 °C). Furthermore, Zhu (2013) described that adding limestone into the process that can absorb the SO2 which will be formed during the combustion, and ammonia will be injected into the boiler outlet to reduce the formation of NOx emissions further.
Figure 1 visualizes a simple schematic of a CFB boiler with some devices such as solid fuel silo, riser, bed, superheater, economizer etc.
Figure 1 A simple schematic of a circulating fluidized bed (CFB) boiler (Skvaril et al. 2019), edited by the authors, used with permission.
3.1.3 Combustion of solid biomass
Combustion belongs to the exothermal of chemical reactions where the bounded carbon, hydrogen, and sulphur in the fuel (in this case solid biofuel mixtures) oxidize into carbon dioxide, water, and sulphur dioxide. This means that during the exothermic reaction, heat releases while chemical energy of the fuel converts into thermal energy. Sulphur is out of the scope of this study due to its low concentration in the samples and the detection limitation of the elemental analyzer instrument.
3.1.3.1.
Stoichiometry and elemental compositions
The fuel consists of elemental compositions such as carbon (C), hydrogen (H), nitrogen (N), sulphur (S), oxygen (O), and ash. The elements (C, H, and S) are completely combustible, and the products will be carbon dioxide, water, and sulphur dioxide. But sulphur dioxide is not desirable because it can react later with oxygen and water vapor to build sulphur acid (𝐻2𝑆𝑂4). The chemical reactions of carbon, hydrogen and sulphur are shown in Equation 1, Equation 2, Equation 3, respectively (Wester 2012).
Equation 1 𝐶 + 𝑂2 → 𝐶𝑂2+ ℎ𝑒𝑎𝑡 Equation 2 𝐻2+ 1 2𝑂2→ 𝐻2𝑂 + ℎ𝑒𝑎𝑡 Equation 3 𝑆 + 𝑂2 → 𝑆𝑂2+ ℎ𝑒𝑎𝑡
A complete combustion of fuel will need a certain amount of access air (𝑙𝑜) in mole/kg fuel; thus the required air can be calculated by Equation 4 (Wester 2012).
Equation 4 𝑙𝑜= (1 + Φ) ( 𝐶 𝑀𝐶 + 𝐻 𝑀𝐻2 + 𝑂 𝑀𝑂2 + 𝑆 𝑀𝑆2 ) (1 +𝑁2 𝑂2 +𝐴𝑟 𝑂2 +𝐶𝑂2 𝑂2 ) [ 𝑚𝑜𝑙𝑒 𝑘𝑔 𝑓𝑢𝑒𝑙]
Where Φ is the air moisture ratio and its value depends on pressure and temperature, and 𝑁2, 𝐴𝑟, 𝑎𝑛𝑑 𝐶𝑂2 represent the percentage concentration of nitrogen, argon, and carbon dioxide, respectively. The following 𝑀𝐶, 𝑀𝐻2, 𝑀𝑂2, 𝑎𝑛𝑑 𝑀𝑆2are the molar weights for carbon, hydrogen, oxygen, and sulphur, respectively.
3.1.4 High moisturized solid biomass combustion
Wu et al. (2009) highlighted the moisture content of solid biofuels in the boiler. The authors concluded that combusting of solid biofuel with high moisture content is not desirable in the boiler, since it will cause several issues such as temperature drop in the boiler, needs of more energy to remove the fuel´s moisture, increase of bed temperature fluctuations, and finally decreasing of boiler efficiency. Orang and Tran (2015) studied feedstock with varying moisture content at different temperatures during the combustion of pulp and paper mills. They pointed out that the combustion occurs at three stages: drying, de volatilization, and char burning. The results showed that the feedstocks with moisture content higher than 30% remarkably increase the drying and ignition time of the fuels but have small impact on the de volatilization and no impact on char burning rate. Feedstocks with moisture content of 40% needed at least a temperature of 800 °C to ignite, temperatures of 500 °C needed further drying and ignition time, and at 400 °C it did not ignite.
According to Bahadori et al. (2014), the efficiency of the boiler decreases while combusting solid biomass with high moisture content. It is due to more energy needed to evaporate the water from the fuels. Labbé et al. (2020) evaluated the drying cost of feedstocks at 12% and 24% moisture content. As results, the feedstocks with moisture content of 12% showed lower energy consumption. In other words, lower drying cost than feedstocks with 24% of moisture content.
3.1.5 Ash-related issues
One of the main challenges in biomass fired boilers is the ash deposition that will induce several ash-related problems such as agglomeration, slagging, fouling, and corrosion. This is due to presence of alkali species (alkali chlorides and sulphates) in biomass fuels during the combustion (Niu, Tan, and Hui 2016). Alkali chlorides are outside the scope of this thesis.
3.1.5.1.
Bed agglomeration problem
Agglomeration can be formed by compounds of various elements such as alkali metals (K and Na), alkali earth metals (Mg and Ca), chlorine, sulphur. That is due to either low melting points of these elements or high temperature caused by high local oxygen concentration where the oxygen is injected (Q. Zhu 2013). Chirone, Miccio, and Scala (2006) investigated the mechanism of bed agglomeration formation during combustion of biomass fuel in a FBC boiler. As result, they found that as a consequence, the contents of potassium and sodium on the sand surface with higher temperature caused the bed agglomeration, and the primary mechanism for the formation of bed agglomeration is the competition between bed particles and the breaking of the agglomerates by inertial forces.
Olofsson et al. (2002) studied bed material agglomeration in FBC boilers with biomass fuel at the temperature range of 670 – 870 °C and at a pressure level of 1.0 – 1.5 MPa. They observed two types of agglomeration (homogeneous and heterogeneous) were formed. The first one, possibly formed by erosion of the bed at low temperatures and the presence of silicon, the alkali
metals accounted for contributing to the homogeneous agglomeration mainly. The second one is mainly formed by interaction of fuel ash and bed materials at high temperatures.
3.1.5.2.
Slagging and fouling
Slagging and fouling are common problems in the boiler that are associated to the solid biofuel ash. The materials that are deposited on the water walls and superheater tubes inside the boiler are mainly comprised of alkali compounds, it is due to high volatile alkalis in biomass (Lachman et al. 2021). Teixeira et al. (2012) studied the ash fusibility index (AFI) by co-combustion of straw pellets, olive cake, and wood pellets with coals. However, the authors thought the fouling were caused mainly by 𝐾𝐶𝑙 and 𝐾2𝑆𝑂4, that identified in fruit origin biomass, not wood pellets. Niu, Tan, and Hui (2016) suggest that biomass ash-related problems are not only laying on chlorine and alkali metals but also related to ash fusion characteristics which can cause fused slag deposits on the wall surfaces of the heat exchanger tubes inside the boiler. Nunes et al. (2019) evaluated the use of maritime non-debarked woodchips as an alternative solid fuel feedstock in the boilers in Portugal. But as results showed, the feedstock remarkably contributed for the formation of slagging and fouling phenomena on the walls surface in the boiler.
3.1.5.3.
Corrosion
Corrosion is mainly associated with the presence of 𝐾𝐶𝑙 in the biomass-ash depositions, where 𝐾𝐶𝑙 reacts with oxide scale directly and releases 𝐶𝑙 which later reacts with metals on the surface of superheater tubes and accelerate corrosion in the boiler, while 𝑆𝑂2 has positive impact in regards to corrosion (Yin and Wu 2009).
The problems associated with Cl induced corrosion, occur often at metal temperatures higher than 500 °C, while steam boilers operating the superheater at temperatures below 450 °C, the corrosion process reduces significantly. Corrosion occur even in lower temperatures (100 – 150 °C) but not in a short term and not the same scale as at temperatures higher than 500 °C. (Khan et al. 2009)
3.1.6 Countermeasures
In order to avoid biomass-ash agglomeration problems, Khan et al. (2009) suggest that one solution could be to run fluidized bed furnace at lower than optimal temperature, but they also pointed out with lower temperature the efficiency of the boiler will be decreased.
In order to reduce slagging and fouling in the heating surface in the boiler, Yang et al. (2019) treated high-alkali species in coal by hydrothermal pre-treatment using a batch-tube autoclave at 300 °C for one hour and then analyzed the treated coals. The results of treated coals were superior compared to untreated coals via hydrothermal pre-treatment and thereby lowering the slagging and fouling tendency. In order to reduce slagging and fouling in the heating surface in the boiler, Yang et al. (2019) treated high-alkali species in coal by hydrothermal pre-treatment using a batch-tube autoclave at 300 °C for one hour and then analyzed the treated
coals. The results of treated coals were superior compared to untreated coals via hydrothermal pre-treatment and thereby lowering the slagging and fouling tendency.
Y. Zhu et al. (2014) highlighted the countermeasures of slagging and fouling in biomass fired boilers and suggest the addition of additives such as kaolin that consists mainly of Si-Al compounds and soil can aim to countermeasure the slagging and fouling phenomena.
According to Yin and Wu (2009), the positive impact of 𝑆𝑂2 has been proven in terms of corrosion control in the boiler and reduce the risk of high-temperature corrosion. On the other hand, the 𝐾𝐶𝑙 is the main reason to the corrosion in the boiler. In order to countermeasure this corrosive deposition, 𝐾𝐶𝑙 need to be converted into 𝐾2𝑆𝑂4, which is less corrosive according to the reaction in Equation 5 (Yin and Wu 2009).
Equation 5
2𝐾𝐶𝑙(𝑠) + 𝑆𝑂2(𝑔) + 𝑂2(𝑔) → 𝐾2𝑆𝑂4(𝑠) + 𝐶𝑙2(𝑔)
3.1.7 Carbon capture and storage in CHP plants
One of the most important environmental challenges is the CO2 emissions that need to be reduced rapidly to stop further global warming. Using CCS technologies as mentioned in section 1.1.3 alongside bioenergy in CHP plants can make a difference in terms of CO2 emissions reduction. One of the interesting options is the combination of bioenergy with CO2 capture and storage to reverse the concentration of CO2 in the atmosphere. In order to make the CCS technologies more suitable, there will be needed some information about the compositions of the flue gas in good time.
In this case, NIR spectroscopy could be the technology that may provide the information to CCS applications by analyzing the elemental compositions of solid biofuels in real-time. The results of analyzed properties of biomass by NIR spectroscopy could be a guide for applying in flue gas flow rate, flue gas compositions in combustion, and air requirement (Posom and Sirisomboon 2017). Janković et al. (2018) tested raw and pyrolyzed samples of the plane tree seeds (PTS) by several analytical techniques such as Raman spectroscopy analyzes, Fourier Transform Infra-Red analyzes etc. for its characterization procedure and the pre-treatments in possible applications in CCS technologies. As results, the authors stated that the pyrolyzed samples of the plane tree seeds showed that it has the potential to be applicable in CCS technologies.
Carbo et al. (2011) highlighted the possibilities of combining bioenergy with carbon capture and storage (BECCS) technologies for negative CO2 net emissions. They suggest the BECCS technologies such as biomass substitute natural gas (BioSNG) production is compatible to fossil fuels due to its low CO2 emission avoidance cost of 62 €/ton CO2.
Gough and Upham (2011) evaluated the potentials and obstacles for large-scale deployment of BECCS in near term. The author pointed out that co-firing of biomass with coal gives the opportunities to achieve negative CO2 emissions system through BECCS. Hence, BECCS will
play an important role in CO2 reduction, but care needs to be taken about the obstacles such as access to CCS infrastructures and forestry.
Bui, Fajardy, and Mac Dowell (2018) evaluated the possibilities to improve the performance of BECCS in case of negative CO2 emissions. The authors pointed out that biomass with high moisture- and ash content aims to increase the CO2 emissions negativity, but it will also decrease the efficiency of the system. They also mentioned that there would not be any big issues in the technical performance, but the lack of economic and potential drivers are the main barriers why the BECCS cannot be commercialized in large-scale. Therefore, accessibility of sustainable biomass supply chain and stablish suitable carbon sequestration sites are essential for implementation of BECCS. Babin, Vaneeckhaute, and Iliuta (2021) provided a similar study for implementation of BECCS; they mentioned that BECCS has low energy efficiency but integrating with CHP could offset the energy penalties from CCS and makes it applicable from the economic point of view, especially with feedstocks such as wood chips, residual biomass, or municipal solid waste.
Yi et al. (2018) provided an evaluation study about the life cycle-economic-CO2 emissions of biomass and coal co-fired with and without CCS in power plants in United Kingdom. The investigations showed, co-firing of biomass and coal with or without CCS has not advantages compare to coal fired plant with or without CCS regarding energy use, because the biomass supply chain process consuming a significant amount of energy. However, for applicability of biomass and coal co-fired power plant with CCS there will be needed some suitable measures such as pipeline for transportations of CO2 sequestration to the storage site etc.
The research study from Raza et al. (2019) provided deeper look into different aspects of CO2 and its long term storage safety in deep geological sites. The authors emphasize the cost-effective way of CO2 transportation from power plants to the storage sites through pipelines, and the storage sites needs to be monitored both during the injection and after injection of CO2 for safety reasons. Further from the economic point of view, they pointed out that the cost of CO2 separation, transportation, and injection needs to be considered before beginning of a CCS project.
3.2 NIR Spectroscopy
The IR spectrum is divided into three regions, near-infrared, mid-infrared, and far-infrared. NIR spectra has the wavelength range from 800 – 2500 nm, which corresponds to the wavenumber range from 12500 – 4000 c m-1, MIR spectra has the wavelength range from 2500
– 25000 nm, which corresponds to the wavenumber range from 4000 – 400 c m-1, and FIR
spectra has the wavelength range from 25 µm – 1 mm, which corresponds to the wavenumber range from 400 – 10 cm-1 (Ozaki et al. 2021).
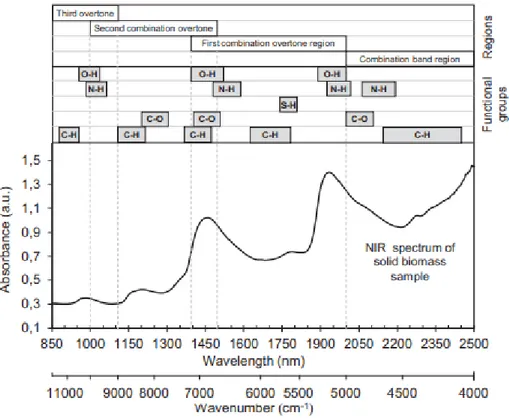
A typical measurement of solid biomass with NIR spectroscopy by Skvaril, Kyprianidis, and Dahlquist (2017) is presented in Figure 2 which shows the different combination overtone regions of chemical bonds containing hydrogen.
Figure 2 Absorption bonds in the NIR region and a typical spectra of solid biomass sample (Skvaril, Kyprianidis, and Dahlquist 2017), used with permission.
As mentioned in section 1.1.1, the NIR spectroscopy technique is a rapid, cheap, and quick method that utilizes in different fields to determine chemical properties of materials. The NIR spectroscopy is a non-invasive and in situ analysis method that permits non-contact analysis of samples in different state, with different shape and thickness by using optical fiber (Ozaki et al. 2021).
Pu et al. (2020) and Pasquini (2003) described that NIR spectroscopy is a non-destructive, non-invasive method that employs the photon energy (hυ) in the energy range of 2.69 x 10⁻¹⁹
to 7.96 x 10⁻²⁰ J to recognize molecular vibrations of the chemical bonds which contain
hydrogen such as OH, NH, CH and SH. Ozaki et al. (2021) suggest that due to analysis of aqueous solutions, NIR spectroscopy is more suitable than IR spectroscopy since the water bonds intensity is much weaker in the NIR spectrum than in the IR spectrum.
3.2.1 Basic principle of NIR spectroscopy
The principle of NIR spectroscopy is based on absorption, radiation, and reflection due to electromagnetic waves. During the interaction of electromagnetic radiation (i.e. light) with the matter, some energy absorbs by molecules and the molecules enter a higher energy level. This transition affects the molecules to vibrate and generate identifiable overtone bonds in the NIR region, where bonds and atoms that contain hydrogen are stretching into the molecules (Patel 2017; Skvaril, Kyprianidis, and Dahlquist 2017).
from one (ground level) to another level. These transitions are constantly happening, and energy is absorbed. The absorptions occur in the mid-IR region and repeated in the NIR region as overtone. (Williams, Manley, and Antoniszyn 2019)
The NIR spectroscopy deals overtones and combinations that are originate from fundamentals and IR deals with the fundamentals. When a molecule irradiates with the IR light, the photon energy (hυ) of the absorbed IR light is the energy difference between a certain energy level of vibration of the molecule (𝐸𝑚) and another energy level of a molecule (𝐸𝑛) as in the following equation (Ozaki et al. 2021).
Equation 6
ℎ𝑣 = 𝐸𝑛− 𝐸𝑚
The equation above is known as Bohr frequency condition and the transition of energy level between molecular vibration makes IR absorption spectrum to be a vibrational spectrum of a molecule (Ozaki et al. 2021).
The chemical compounds are able to absorb light at particular wavelength and the range of absorbance of the light is proportional to the concentration of absorber, and the absorbance is defined as Equation 7 (Ozaki et al. 2021).
Equation 7
𝐴𝑏𝑠𝑜𝑟𝑏𝑎𝑛𝑐𝑒 = −𝑙𝑜𝑔10 𝐼 𝐼0
Where 𝐼0 is representing the light intensity, 𝐼 is representing the amount of light that reached the detector, and the fraction of 𝐼/𝐼0 is representing the incident of the light that penetrates the sample and was detected.
The relation between NIR spectra and sample absorption (A) as shown in Equation 7 is based on the Beer Lambert law. Further, the algorithms used to interpret optical data for absorbing samples could be explained as different paths to relate the sample absorbance (A) at a certain wavelength to analyte concentration as Equation 8 (Burns and Ciurczak 2007).
Equation 8
𝐴 = 𝑀𝑐𝑑
Where, A is the absorbance (optical density), M is the molar absorptivity, c is the molar concentration of absorber, and d is the sample path length.
3.3 Chemometrics
Chemometrics is a collective name for numerous different methods like signal processing, calibration, multivariate statistics and pattern recognition, and neural network for instance. Chemometrics is the practice of using mathematics and statistical techniques to indicate information from multivariate chemical data; this was first presented in 1971 by Svante Wold, a Swedish scientist. The primary steps in a chemometric analysis consist of designing the experiment, pre-processing of the data, classification, and calibration. (Mukherjee 2015) Ozaki et al. (2021) mention that chemometrics is commonly used in spectral analysis for NIR spectroscopy to retrieve quantitative and qualitative information from the NIR spectra; they also mention that multivariate data analysis, like principal component analysis (PCA) and partial least square regression (PLSR), is a significant part of chemometrics.
Principal component analysis is used to simplify high-dimensional data without losing the trends and patterns. The simplification is done by projecting the data geometrically onto lower dimensions, or principal components (PCs), to present the data in a concise way with as few PCs as possible. One of the main utilizations of PCA is to easily inspect and understand a data set and to identify outliers. (Lever, Krzywinski, and Altman 2017)
In the mid-70s, Herman Wold invented the partial least square regression technique; it was intended to be used for econometrics but nowadays it is also commonly used in chemometrics. The PLSR is working with two different data sets, one is the predictors (X-variables), and the other is the responses (Y-variables), to find a linear relation between the two data sets; the values for the Y-variables can then be predicted for a new sample. One example of utilization is that spectral data is used as predictors and the concentrations of a constituent are the responses. (Hubert and Branden 2003)
3.3.1 Data pre-processing
As previous mentioned, data pre-processing is one of the primary steps in a chemometric analysis. As stated by Cui and Fearn (2018) the purpose with data pre-processing is to improve the robustness of a calibration model by removing noise and reducing scatter effects from the raw spectra; it is also mentioned that there are no right or wrong implementation when choosing a pre-processing method, it is mostly done by trial-and-error experimentations. Rinnan, Berg, and Engelsen (2009) also highlighted the importance of data pre-processing for spectral data and describes some of the most common pre-processing techniques for NIR spectral data. There are mainly two categories for these commonly used pre-processing techniques: scatter correction methods and spectral derivatives; the first category consists of three concepts: Multiplicative Scatter Correction (MSC), Standard Normal Variate (SNV), and normalization. The goal with the scatter correction methods is to minimize the samples variability that is due to scatter. The second category, spectral derivatives, mainly consists of two methods: Norris-Williams derivation, and Golay derivation (only the Savitzky-Golay derivation will be used in this study since it is the most common one).
The Savitzky-Golay technique is used for derivative estimation, and for smoothing and reducing noise. For the derivative estimation, the raw data is seen through a symmetric filter, window wise; the window contains 2𝑔 + 1 points and each window will estimate the center point. A polynomial with a given order will be used to fit these 2𝑔 + 1 points to estimate a new value at that wavelength. This will result in a loss of g points on each spectral end. A total number of 7-11 smoothing points and a polynomial of second or fourth degree are usually enough for spectral data of high resolution; but more smoothing points will be required if a higher degree of the derivative is used. (Rinnan et al. 2009)
Another category of pre-processing techniques is the reference-dependent techniques, this category includes, among others, the Orthogonal Signal Correction (OSC) (Rinnan et al. 2009). This technique is also commonly used in the field of spectroscopy and compared to the other techniques previously mentioned this technique use both the X-variables and the Y-variables. The X-variable data is corrected by removing components that is orthogonal to the Y-variables so that only non-relevant information is removed (Padilla et al. 2010). Blanco et al. (2001) applied OSC to NIR data with only one factor and used it in a PLS model, the result was a simple model with good prediction ability.
It can be difficult to choose the appropriate pre-processing technique in advance to model validation, and one should be careful not to choose an improper one or one that is too harsh so that it removes valuable information. Using multiple pre-processing steps is mostly not recommended (Rinnan, Berg, and Engelsen 2009).
3.3.2 Validation
To see how a model is performing, a validation is needed. For a regression model, the ability to do predictions on new data in the future is important; a validation will evaluate the uncertainty for such predictions. A regression model is considered to be valid if that uncertainty is relatively small. Two common validation methods for regression models are cross-validation and test set validation. (CAMO software AS 2006)
In cross-validation, the same data that is used for calibrating the model is also used for validating the model. Some of the samples from the calibration dataset are left out when the model is calibrating so those samples can be used for prediction instead; this process is done several times with different samples until all the samples have been left out once. There are different approaches for cross-validation: full cross-validation, segmented cross-validation, and test-set switch. In full cross-validation, there is only one sample that is left out each time, in segmented cross-validation there is a group of samples that is left out, and for the test-set switch, the calibration dataset is split into two datasets where both datasets will be used as calibration set and test set. (CAMO software AS 2006)
In a test set validation, the whole dataset is divided into a calibration set and a validation set (also called test set); the calibration set is only used for the calibration of the model whilst the validation set is only used for validation of the calibrated model. The calibration dataset should usually include 60-80% of the whole dataset. The split of the dataset could either be a manual selection where the user chooses which samples that should be calibration data and which
samples that should be validation data, or it could be a random selection where the computer chooses the datasets. (CAMO software AS 2006)
To evaluate the validation results, three evaluation factors will be used: the coefficient of determination, root mean square error, and standard error.
The coefficient of determination 𝑅2 is a measure that shows co-linearity between predicted values from developed PLSR model and reference values. The values of 𝑅2 are between 0 – 1, where 𝑅2= 0 indicates non-linear dependency and 𝑅2= 1 indicates 100% linear dependency. The value of 𝑅2 calculates as in Equation 9 (Skvaril 2017).
Equation 9 𝑅2= 1 −∑ (𝑦𝑖− 𝑦̂) 2 𝑛 𝑖=1 ∑𝑛 (𝑦𝑖− 𝑦̅)2 𝑖=1
Where y is the predicted value, 𝑦̂ is the reference value, and 𝑦̅ is the mean reference value, and the n is the total number of predicted points of the sample.
The difference between predicted values from the developed PLSR model and reference values is called root mean square error (RMSE) and can be calculated as in Equation 10 from PLS regression model (Skvaril 2017).
Equation 10 𝑅𝑀𝑆𝐸 = √∑ (𝑦𝑖− 𝑦̂) 2 𝑛 𝑖=1 𝑛 − 1
Another important factor in validation of PLS regression models is the standard deviation of the residuals, or standard error (SE) and can be calculated as in Equation 11 (CAMO Software AS, n.d.). Equation 11 𝑆𝐸 = √ 1 𝑛 − 1∑(𝑦̂ − 𝑦𝑖 𝑖− 𝐵𝑖𝑎𝑠) 2 𝑛 𝑖=1
Where Bias is the average value of the difference between predicted values from the developed PLS regression model and reference values. The Bias is calculated with Equation 12 (CAMO Software AS, n.d.). Equation 12 𝐵𝑖𝑎𝑠 = √1 𝑛∑(𝑦̂ − 𝑦𝑖 𝑖) 𝑛 𝑖=1
To define what a good model is, some thresholds for 𝑅2can be used; these values will vary depending on the field of science. In consumer behavior science, 𝑅2 values between 0.04 and 0.5 are accepted, in process modelling 𝑅2 values of 0.65 or above are recommended, and in analytical chemistry 𝑅2should be at least 0.99 (Skvaril 2020).
3.4 Utilization of NIR spectroscopy
As mentioned in section 1.1.1 the NIR spectroscopy techniques are well suited for at line, in line and online measurements and utilize widely in various fields from determination of contaminants of drugs in pharmaceutical industries to determination of heating value, moisture content, ash content, and elemental compositions of biomass in energy fields. Triolo et al. (2014) utilized NIR spectroscopy by testing the Partial Least Squares (PLS) model to determine the biochemical methane potential (BMP). The achieved results were 0.84 for coefficient of determination (𝑅2) for the determination of the BMP. Huang et al. (2009) used NIR spectroscopy combined with multiple linear regression (MLR) model to predict the straw properties such as carbon, hydrogen, nitrogen, and heating value in 222 samples that collected from different parts of China. As results showed; carbon, hydrogen, nitrogen, and heating value were predicted with 𝑅2 of 0.97, 0.77, 0.87, and 0.96 for validation of the samples, respectively. K. Zhang et al. (2017) used NIR spectroscopy combined with partial least squares (PLS) regression with principal component regression (PCR) to develop a calibration model for determination of higher heating value and elemental compositions such as carbon, hydrogen, nitrogen, sulphur, and oxygen contents of sorghum biomass. The prediction 𝑅2 were for higher heating value 0.96, for carbon 0.96, for hydrogen 0.87, for nitrogen 0.86, for sulphur 0.84, and for oxygen contents 0.83 for validation. The authors rated the accuracy of the models as excellent for prediction of higher heating value and carbon content, whereas for the remaining elements the models could provide reliable predictions.
Posom and Sirisomboon (2017) developed a PLS regression model to predict lower heating value, carbon, hydrogen, nitrogen, oxygen, and sulphur by using FT-NIR spectroscopy. The results showed that the PLS regression models provided 𝑅2 of 0.934, 0.803, 0.856, 0.973, 0.785, and 0.522 for validation of lower heating value, carbon, hydrogen, nitrogen, oxygen, and sulphur, respectively. They pointed out that the model was not satisfactory for prediction of oxygen content, while the model has a high performance in regards to the prediction of lower heating value, carbon- and hydrogen content. Gillespie, Everard, and McDonnell (2015) assessed the NIR spectroscopy combined with PLS regression model to predict the quality indices of biomass pellets. The results showed that the model provided 𝑅2 of 0.85 for moisture content, 0.78 for carbon content, 0.82 for ash content, and 0.95 for higher heating value. Other similar studies in the area of utilizing NIR spectroscopy were done in recent years by Daraei (2016), Hedlund (2018), Dahl (2018), and Ševčík (2019) at Mälardalen University. Daraei (2016) evaluated the prediction of chemical properties of wood such as acid insoluble lignin (AIL), total lignin, pulp yield, kappa number of pulp, moisture content, and acid soluble lignin (ASL) by utilizing the NIR spectroscopy with orthogonal signal correction (OSC). The 𝑅2
for AIL, total lignin, pulp yield, and kappa-number of pulp were 0.92, 0.89, 0.85, 0.99, respectively. While 𝑅2 for moisture content was 0.52 (not reliable) and for ASL 0.077, poor due some errors.
Hedlund (2018) investigated if it is possible to use NIR spectroscopy for detection of glass in refuse derived fuel (RDF). The results were not satisfactory and not applicable, the author suggests the reasons why it failed could be either the poor quality of the models or the number of should be increased up to 300 – 500, (which in this case were 100 samples).
Dahl (2018) made artificial mixture of RDF to investigate the possibilities of utilizing NIR spectroscopy to predict the fossil shares (plastics) in waste materials by developing PLS regression models. As results, the author obtained 0.782 for coefficient of determination (𝑅2) before removing the outliers, and 0.81 for 𝑅2 after removing the outliers. Further, the author mentioned that the 𝑅2 above 0.65 are recommended for process modelling.
Ševčík (2019) used NIR spectroscopy by developing a PLS regression model to identify inorganic chlorine content in RDF. The author suggests, the best regression reached was 0.332 for RMSE, and 0.97 for 𝑅2 by using a combination of Savitzky-Golay Filter (SGF) smoothing and multiplicative scatter correction. Further the author pointed out that the salt content of about 0.2-1 wt.% in sample can be identified.
4
CURRENT STUDY
4.1 Experimental work
This section will describe the methodology for the experimental work that were conducted in the laboratories at Mälardalen university. The materials used (wood chips, bark, and sawdust) for this part of the study were received from Eskilstuna Energi och Miljö.
4.1.1 Sample preparation
A total number of 150 samples of approximately 400-600 grams were taken by mixing various amounts of the materials into smaller plastic bags; the amounts of the materials were roughly estimated and shown in appendix 1. The mixing process was randomly conducted to get the samples more representative of an actual material flow. The samples were retained for some days in the airtight plastic bags to sufficiently distribute the moisture content.
4.1.2 NIR spectra measurement
The NIR spectra measurements were done using a Fourier Transform Near Infrared (FT-NIR) spectrometer with a diffuse reflectance over a spectral wavenumber range of 12000 cm-1 to
4000 cm-1. The sample was placed in a round dish approximately seventeen centimeters below
the sensor. The measurements were conducted three times on each sample while the dish was rotating with speed of 0.5 m/s to get a representative result; the sample was also mixed between the measurements. The setup can be seen in Figure 3.
After the scanning, the sample was split into three different aluminum trays, two of them were used for only the moisture content, and one of them were left to air dry for a couple of days before it was grinded. The grinding was conducted two times, the first time with a filter of 4 mm, and the second time with a filter of 0,5 mm. Figure 4 is showing some of the samples before and after grinding.
Figure 4 Pictures of some of the biofuel mixtures samples used in the experimental work before grinding (left) and after grinding (right).
4.1.3 Moisture content
The determination of moisture content for the samples as received (AR) was conducted by following the simplified standard method (Swedish Standards Institute 2017b). The samples were weighted before and after they were dried in an oven at a temperature of 105 °C for a minimum of six hours and a maximum of 24 hours; the moisture content could then be calculated by using Equation 13.
Equation 13
𝑀𝑎𝑟 =
(𝑚2− 𝑚3) (𝑚2− 𝑚1)
∗ 100
Where 𝑀𝑎𝑟 is the moisture content in percent as received, 𝑚1 is the mass of the empty aluminum tray, 𝑚2 is the mass of the aluminium tray, including the sample before drying, and 𝑚3 is the mass of the aluminum tray, including the sample after drying when it is still hot. The results for the moisture content for all the samples as received can be seen in appendix 2. The determination of moisture content for the grinded samples was conducted by following the Moisture in general analysis sample (Swedish Standards Institute 2015b). Approximately two grams of the sample was placed in a small aluminum tray and then dried in an oven at a temperature of 105 °C for around four hours; this was conducted in duplicates. The moisture
content, 𝑀𝑑, could then be calculated in the same way as 𝑀𝑎𝑟 in Equation 13. Figure 5 is showing some of the grinded samples after drying.
Figure 5 Picture of some of the grinded samples in aluminum trays after drying.
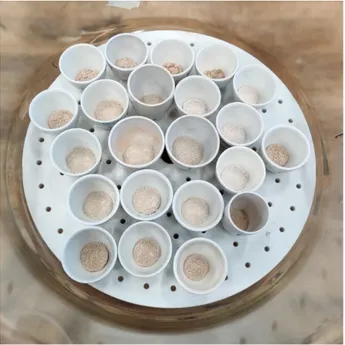
4.1.4 Ash content
The determination of ash content for the grinded samples was conducted by following the determination of ash content (Swedish Standards Institute 2015a). Approximately 1.5 grams of the sample was placed in a small porcelain dish and then heated in a furnace at 550 ◦C for four hours. After the sample had been completely burned, the dish was placed in a desiccator with desiccant to cool down for 30 minutes before it was weighted; this was conducted in duplicates. The ash content could then be calculated by using Equation 14.
Equation 14 𝐴𝑑= (𝑚3− 𝑚1) (𝑚2− 𝑚1) ∗ 100 ∗ 100 100 − 𝑀𝑑
Where 𝐴𝑑 is the ash content in percent on a dry basis of the sample, 𝑀𝑑 is the moisture content in percent on a dry basis of the sample (in this case, the samples that air dried for calculation of ash content had a moisture content of approximately 5 – 20 %), 𝑚1 is the mass of the empty porcelain dish, 𝑚2 is the mass of the porcelain dish including the sample, and 𝑚3 is the mass of the porcelain dish including the ash.
The tests were repeated if the duplicates’ calculated ash content had a difference bigger than 0.3% absolute. Figure 6 is showing the porcelain dishes, including the ash for some of the samples.