Model scale fire experiments in a model
tunnel with wooden pallets at varying
distances
Rickard Hansen
Haukur Ingason
Summary
This report is part of the research project “Concept for fire and smoke spread prevention in mines”, conducted by a research group at Mälardalen University.
The project is aimed at improving fire safety in mines in order to obtain a safer working
environment for the people working for the mining companies in Sweden or for visitors in mines open to the public.
This report comprises a number of model scale fire experiments conducted in a model tunnel at SP facilities in Borås, Sweden.
The main purposes of the report are:
- Obtain data which can validate models to calculate the total heat release rate of multiple objects
- To investigate the influence on the heat release rate curve that a varying distance between the fuel objects will have.
- To investigate the influence on the heat release rate, fire growth rate and time to ignition for adjacent fuel objects. The effects of ventilation are taken into account in the model.. The work in this report started with describing the theoretical basis of scaling theory and the determination of heat release rate at fire experiments, continuing with describing the
experimental setup with the fuel load and instrumentation used. After that the experimental procedure and the experimental results were described and analysed. The results from the experiments were thereafter discussed and finally conclusions were drawn.
The findings and conclusions of the study were as following:
It was found that an increasing ventilation rate slightly increases the maximum heat release rate, which is in accordance with earlier research.
The ventilation rate will have an influence on the fire growth rate. In the tests with the highest ventilation rate, a slower fire growth rate was displayed compared to the other two cases. This could possibly be explained by the fact that the height of the pile of wooden pallets (205 mm) was practically equal to the short side of the pile (200 mm) and the fire was started on the long side, thus as the longitudinal ventilation is increased less fuel area is exposed to the tilted flames resulting in that less parts take place in the combustion during the growth phase and thus the fire growth rate decreases.
When studying the graphs of the various heat release rates it was found that when the distance between pile #1 and pile #2 increased to a certain level the ignition of pile #2 will be delayed resulting in that not all piles are burned with their maximum heat release rate at the same time. The delay in ignition of adjacent pallet can be distinguished by a “hump” before the peak value in the heat release rate curves. In cases with short distances between the piles the ignition of
adjacent piles took place almost simultaneously and resulting in a total heat release curve where the pallet piles burn at their maximum at nearly the same time, i.e. the effects of the delay of ignition is not really showing up in the time to reach maximum heat release rate.
It was also found that the peak value of the heat release rate decreases as the distances between the piles are increased – from ~500 kW down to ~450 kW – as the curve is stretched out in time. The ignition data indicated that the time to ignition of adjacent piles would decrease as the longitudinal ventilation was increased.
Further validation work should take place with respect to validating the experimental data with output data from theoretical models.
Further studies and experiments should take place that vary additional parameters besides the distance between the individual fuel objects. This in order to make further comparisons with calculation models to predict the total heat release rates of complex objects, such as for example a vehicle.
Preface
This report is part of the research project “Concept for fire and smoke spread prevention in mines”, conducted by a research group at Mälardalen University.
The project is aimed at improving fire safety in mines in order to obtain a safer working
environment for the people working for the mining companies in Sweden or for visitors in mines open to the public.
The following organisations are participating in the project: Mälardalen University, LKAB, Sala Silvergruva, Stora Kopparberget, Brandskyddslaget and Swepro Project Management.
Contents
1. Introduction ... 6
2. Background ... 8
2.1 Scaling theory... 9
2.2 Determination of heat release rate... 10
3. Experimental setup ... 12 3.1 Fire load... 13 3.2 Instrumentation... 17 4. Experimental procedure ... 19 5. Experimental results ... 20 5.1 Reference tests... 20
5.2 Heat release rate ... 21
5.3 Gas temperatures ... 22
5.4 Total heat flux ... 22
5.5 Ignition time ... 23
6. Discussion of results... 24
6.1 Reference tests... 24
6.2 Heat release rate and ignition time ... 24
7. Conclusions ... 26 References ... 27 Appendix A.
1. Introduction
Research regarding fire safety in mines has so far mainly been directed towards coal mines. Thus the need for recommendations, models, engineering tools etc for non-coal underground mines are in great need.
The aim of the current research project “Concept for fire and smoke spread prevention in mines” is to improve fire safety in mines in order to obtain a safer working environment for the people working for the mining companies in Sweden or for visitors in mines open to the public. The fire safety record in mines in Sweden is in general good with very few fire accidents that have occurred. The main reason is that there is a great awareness of the fire safety problems in mines. The awareness comes from the fact that escape routes from mines are generally limited. The reason why there is a limited amount of escape routes is that it is expensive to construct extra escape routes which are not a part of the tunnel mining system. The costs to build extra escape tunnels may be better spent on different safety equipment or systems for fire prevention or evacuation. Such systems can be ventilation systems, fire fighting equipment or rescue chambers located at different places in the mines.
The research project consists of different steps, where each step is based on results and knowledge from the earlier steps. The steps are: literature survey, inventory of technical and geometrical conditions, calculation of smoke spread, model scale tests and reports and recommendations. All results will be compared and evaluated against earlier experiences. This report deals with the step regarding model scale experiments.
The main purposes of the model scale experiments are:
- Obtain data which can validate models to calculate the total heat release rate of multiple objects
- To investigate the influence on the heat release rate curve that a varying distance between the fuel objects will have.
- To investigate the influence on the heat release rate, fire growth rate and time to ignition for adjacent fuel objects that increasing ventilation will have.
The output of the entire research project will mainly consist of: - performed tests,
- written reports
- recommendations within the mining companies regarding fire safety work, - recommendations and the engineering tools for calculation of fire development - smoke spread in mines,
The work presented here substitutes an important part in the research project and will be a vital part of the continuation for research in this area.
2. Background
The fire safety problems in mines are in many ways very similar to the problems discussed in road, rail and metro tunnels being under construction. As in mines, there is usually a limited amount of escape routes and the only safe havens are the safety chambers consisting of steel containers with air supply within and rescue rooms which have a separate ventilation system and will withstand a fire for at least 60 minutes.
Rescue operation is hard to perform when the attack routes often are equal with the possible path for smoke to reach the outside. The possibilities for a safe evacuation and a successful fire and rescue operation are strongly linked to the fire development and the smoke spread in these kinds of constructions.
For mining companies the problems with evacuation and rescue operations in case of fire are closely linked to policies, work environment protection and their systematic fire safety work. An accident not only can cause injuries, or in the worst case deaths, but also large costs due to production losses, reparations and loss in good-will.
The main problem with mines today is that they have become more and more complicated, with endless amount of shafts, ramps and drifts, and it is difficult to control the way the smoke and heat spread in case of a fire. The ventilation strategy is of the greatest importance in such cases in combination with the fire and rescue strategies. Since there are very few fires that occur, the experience of attacking such fires in real life is little. New knowledge about fire and smoke spread in complicated mines consisting of ramps is therefore of importance in order to make reasonable strategies for the personnel of the mining company and the fire and rescue services. The main experience from fighting mine fires comes from old coal mines, which are usually quite different in structure compared to mines in Sweden which mainly work with metalliferous rock products. In Sweden the mines consist of either active working mines with road vehicle traffic and elevator shafts for transportation of people and products or old mines allowing visitors. In some cases it is a combination of both types.
As the mine industry is changing and the challenging techniques are developed, the measures to guarantee the safety of personnel need to be adjusted. The new technology means new types of fire hazards, which in turn requires new measures to cope with the risks. New equipment means new types of fire development. The knowledge about fire developments in modern mines is relatively limited. The fire development of vehicles transporting material inside the mines is usually assumed to be from ordinary vehicles, although the vehicles may be considerably different in construction and hazard. The difference may mainly be in the amount of liquid (e.g. hydraulic oil) and the size of the rubber tyres.
As there is a need to validate models that can predict the fire development in vehicles it was decided to carry out some model scale tests taking into account the distance between burning objects. Further, model scale experiments are easy to work with and give very valuable
information on fire behaviour. Thus, conducting model scale fire experiments is important for this project.
2.1 Scaling theory
The use of scale modelling is very convenient as it allows us to translate the results from model scale fire experiments into a full scale system. The scale modelling technique uses the theory of dimensionless groups as a basis.
The model tunnel in the fire experiments was built in scale 1:15, which means that the size of the tunnel was scaled geometrically according to this ratio. Neglecting the influence of the thermal inertia of the involved material, the turbulence intensity and radiation, but scaling the HRR, the time, flow rates, the energy content and mass, we end up with scaling models found in table 1. Table 1. List of scaling models [1].
Unit Scaling model Equation number
Heat release rate [kW] 5/2
⋅ = M F M F L L Q Q& & (1) Velocity [m/s] 1/2 ⋅ = M F M F L L u u (2) Time [s] 1/2 ⋅ = M F M F L L t t (3) Energy [kJ] F c M c M F M F H H L L E E , , 3 ∆ ∆ ⋅ ⋅ = (4) Mass [kg] 3 ⋅ = M F M F L L m m (5) Temperature [K] TF =TM (6)
In table 1, L is the length scale, the index F relates to the full scale and the index M relates to the model scale. Thus in our actual model F is 15 and M is 1.
2.2 Determination of heat release rate
The heat release rate in the fire experiments was determined by measuring the mass flow rate and gas concentrations in an exhaust duct connected to the model tunnel.
The heat release rate – using mass flow rate and gas concentration data – can be calculated using the following equation [1]:
(
)
(
)
− − − ⋅ − − ⋅ ⋅ ⋅ = 2 2 2 2 2 2 1 1 1 14330 0, 0, CO O CO O CO O a X X X X X X m Q& & [kW] (7) Where: am& is the air mass flow rate on the upstream side [kg/s]
2 , 0 O
X is the volume fraction of oxygen in the incoming air (set to 0.2094)
2 , 0 CO
X is the volume fraction of carbon dioxide measured in the incoming air (approximated to
0.00033)
2 CO
X is the volume fraction of carbon dioxide downstream of the fire
2 O
X is the volume fraction of the oxygen downstream of the fire
A u
m&a =
ρ
a⋅ ⋅ [kg/s] (8)Where:
a
ρ
is the ambient air density [kg/m³], which was set to 1.2 kg/m³ u is the average longitudinal velocity upstream the fire [m/s]A is the cross-sectional area of the tunnel [m²]
In equation (7) it is assumed that [1]:
- 13100 kJ/kg is released per kg of oxygen consumed
- The relative humidity of incoming air is 50%
- The ambient temperature is 15ºC
- CO2 in incoming air is 330 ppm (0.033 %)
- The molecular weight of air is 0.02895 kg/mol and 0.032 kg/mol for oxygen
The total air mass flow rate - m& - inside the tunnel can be calculated both for the upstream - m& a
- and the downstream - m& - side. g
The equation for the total air mass flow rate is [1]: A
u T T
Where:
ζ is the theoretically determined mass flow correction factor; in the calculations a value of 0.817 was used
a
T is the ambient temperature [K], which was set to 293 K
c
u is the centreline gas velocity [m/s]
The centreline gas velocity was determined with aid of the measured pressure difference - ∆p - for each bi-directional probe and the corresponding gas temperature.
The centreline velocity was calculated using the following equation [1]:
a a c T T p k u ⋅ ⋅ ∆ ⋅ =
ρ
2 1 [m/s] (10) Where:k is a calibration coefficient equal to 1.08
The mass flow rate was calculated using equation (9) and applying the centreline velocity both upstream and downstream. The downstream centreline velocity - ug,c - was transformed to a
“cold” centreline velocity - u0,c - by applying the ideal gas law.
The O2, CO and CO2 were measured at two heights: 0.88 × H and 0.5 × H, where the tunnel height H was 0.4 m.
The heat release rate calculated according to equation (7) can be obtained by calculating the air mass flow rate upstream of the fire and by transforming the measured O2, CO and CO2 to an average value by using the correlation given by Newman [2]. Newman assumes that the local gas temperature and the local gas concentration correlate through the average values over the cross-section: h avg h i avg i T T X X ∆ ∆ ⋅ = , , (11) Where: h i
X , is the concentration of species i at height h
avg i
X , is the average concentration of species i
h
T
∆ is the difference between the temperature at height h and the ambient temperature
avg
T
∆ is the difference between the arithmetic average temperature over the cross-section and the ambient temperature at corresponding location.
Ingason and Lönnermark [3] used this correlation in order to determine the heat release rate in a series of large scale tunnel fire tests.
3. Experimental setup
A total of 12 tests were carried out in a 1:15 scale model tunnel. The parameters tested were: the distance between the piles of wood pallets and the longitudinal ventilation rate. Further, the effect of different distances between piles of wood pallets was investigated.
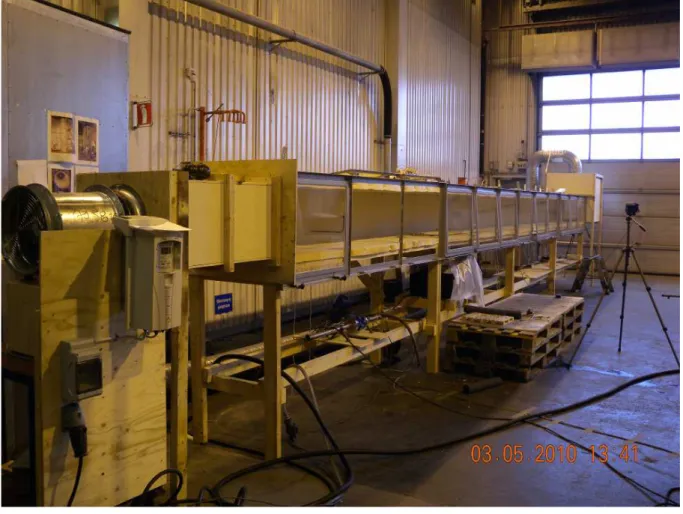
Longitudinal ventilation was established using an electrical axial fan attached to the entrance of the model tunnel, see Figure 1. The fan was 0.375 m long with an inner diameter of 0.315 m. The longitudinal velocities were obtained by adjusting a frequency regulator. In between the fan and the tunnel entrance, two nets consisting of smooth pipes with lengths of 450 mm and diameters of 45 mm were attached to the fan and at the entry of the tunnel respectively. Longitudinal wind velocities of 0.3 m/s, 0.6 m/s and 0.9 m/s were used in the test series. According to equation (2), the corresponding large scale velocities were 1.16 m/s, 2.32 m/s and 3.49 m/s.
The tunnel itself was 10 m long, 0.6 m wide and 0.4 m in height, see Figure 2. The corresponding large scale dimensions were thus 150 m long, 9 m wide and 6 m high.
During the tests the produced smoke flow was removed by the central ventilation system connected to the end of the model tunnel, and then cleaned by the cleaning tower. In order to eliminate the effect of the central ventilation system on the model tunnel ventilation, a cubic box made of Promatect H board as installed between them. The cubic box was enclosed except the bottom exposed to the ambient.
The model was constructed using non-combustible, 15 mm thick, boards (Promatect H).
The manufacturer of the boards provides the following technical data: the density of the board is 870 kg/m3
, the heat capacity is 1130 J/kg K and heat conduction is 0.175 W/m·K. The floor, ceiling and one of the vertical walls, were built in Promatect H boards while the front side of the tunnel was covered with a fire resistant 5 mm window glaze.
Figure 1. The 1:15 model scale tunnel used in the project.
Figure 2. A drawing of the model tunnel [4].
3.1 Fire load
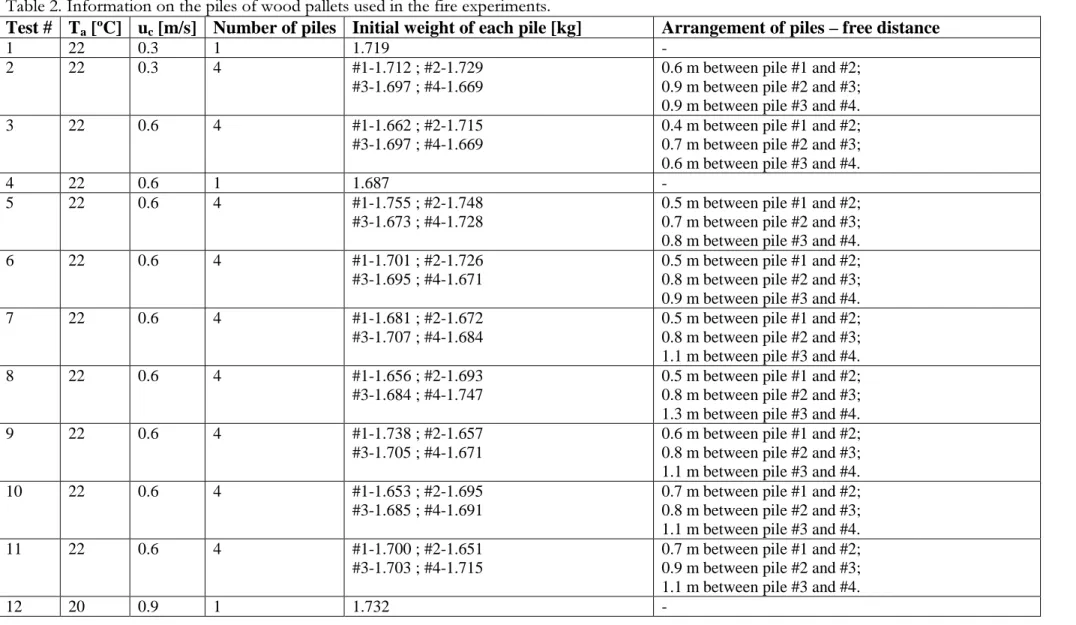
The fire load consisted of piles of wood pallets (pine), where each pile consisted of five individual wood pallets. Test fire 1, 4 and 12 were reference tests and consisted of a single pile of pallets, whereas in the other tests the fire load consisted of four piles of wood pallets placed at different distances.
The wooden pallets were geometrically scaled 1:4 using the standard European measurements 1200 mm by 800 mm. These pallets were originally designed and built for use in another project on fire safety on board ships [Arvidson]. As a large number of pallets were available, it was decided to use them in the present project.
The scaled-down pallets had an overall dimension of 300 mm by 200 mm by 36 mm (L × W × H).A detailed description – with measurements - of a wood pallet is given in Figure 3. More detailed information about the piles of wood pallets for each test is given in Table 2.
Table 2. Information on the piles of wood pallets used in the fire experiments.
Test # Ta [ºC] uc [m/s] Number of piles Initial weight of each pile [kg] Arrangement of piles – free distance
1 22 0.3 1 1.719 -
2 22 0.3 4 #1-1.712 ; #2-1.729 #3-1.697 ; #4-1.669
0.6 m between pile #1 and #2; 0.9 m between pile #2 and #3; 0.9 m between pile #3 and #4. 3 22 0.6 4 #1-1.662 ; #2-1.715
#3-1.697 ; #4-1.669
0.4 m between pile #1 and #2; 0.7 m between pile #2 and #3; 0.6 m between pile #3 and #4.
4 22 0.6 1 1.687 -
5 22 0.6 4 #1-1.755 ; #2-1.748 #3-1.673 ; #4-1.728
0.5 m between pile #1 and #2; 0.7 m between pile #2 and #3; 0.8 m between pile #3 and #4. 6 22 0.6 4 #1-1.701 ; #2-1.726
#3-1.695 ; #4-1.671
0.5 m between pile #1 and #2; 0.8 m between pile #2 and #3; 0.9 m between pile #3 and #4. 7 22 0.6 4 #1-1.681 ; #2-1.672
#3-1.707 ; #4-1.684
0.5 m between pile #1 and #2; 0.8 m between pile #2 and #3; 1.1 m between pile #3 and #4. 8 22 0.6 4 #1-1.656 ; #2-1.693
#3-1.684 ; #4-1.747
0.5 m between pile #1 and #2; 0.8 m between pile #2 and #3; 1.3 m between pile #3 and #4. 9 22 0.6 4 #1-1.738 ; #2-1.657
#3-1.705 ; #4-1.671
0.6 m between pile #1 and #2; 0.8 m between pile #2 and #3; 1.1 m between pile #3 and #4. 10 22 0.6 4 #1-1.653 ; #2-1.695
#3-1.685 ; #4-1.691
0.7 m between pile #1 and #2; 0.8 m between pile #2 and #3; 1.1 m between pile #3 and #4. 11 22 0.6 4 #1-1.700 ; #2-1.651
#3-1.703 ; #4-1.715
0.7 m between pile #1 and #2; 0.9 m between pile #2 and #3; 1.1 m between pile #3 and #4.
The total the different piles of wood pallets ranged from 1.651 kg to 1.755 kg (see Table 2). The variation is because each wood pallet was manufactured by hand.
3.2 Instrumentation
Various measurements were conducted during each test. The first pile of wood pallets was placed on a weighing platform (W), consisting of a scale attached by four steel rods to a free floating dried Promatect H board measuring 1.00 m long, 0.45 m wide and 0.015 m thick.
In the case when more than one pile of wood pallets was used in the tests, only the first pile was weighed. The weighing platform was connected to a data logging system recording the weight loss every second. The centre of the weighing platform was 3.3 m from the tunnel entrance (x=0) and the accuracy of the weighing platform was +/- 0.1 g.
The temperature was measured with welded 0.25 mm type K thermocouples (T). The location of the thermocouples is shown in Figure 5 and Figure 6. Most of the thermocouples were placed along the ceiling at a distance of 0.04 m from the ceiling. A set of thermocouples was placed 4.65 m (pile A in Figure 5) and 8.75 m from the inlet opening (pile B in Figure 5), respectively. The thermocouples in each set were place in the centre of the tunnel and 0.04 m, 0.12 m, 0.20 m, 0.28 m and 0.36 m, respectively, above the floor. These thermocouples are identified as T8, T14-T17 for pile A and T12, T18-T21 for pile B in Figure 6.
Four plate thermometers were placed at the floor level during the tests in order to measure the heat flux at the locations. The locations of the plate thermometers were 2.3 m (S24 in Figure 6), 4.65 m (S25), 6.25 m (S26) and 8.75 m (S27) from the tunnel inlet at x=0.
Two bi-directional probes (B22 and B23) were placed at the centreline of the tunnel 1.3 and 8.75 m , respectively, from the inlet. The pressure difference was measured with a pressure transducer with a measuring range of +/- 30 Pa.
The gas concentrations (O2, CO2 and CO) (G) were measured 8.8 m from the entrance (at pile B,
i.e. G28 and G29) by two measuring probes consisting of open copper tubes (Ø 6 mm), except O2 at the centre line (G29). They were located at two different heights, 0.2 m and 0.35 m above
the floor. The gas concentrations in the centre of the exhaust duct at the floor level and 3.7 m horizontally away from the tunnel inlet were also measured. The oxygen was measured with an M&C Type PMA 10 (0 – 21 %) and the CO2 (0 - 10%) and CO (0 – 3 %) was measured with
Siemens Ultramat 22. In Figure 6 the number of and identification of the probes used is presented.
The weighing platform, the thermocouples, the pressure transducers, the gas analysers and flux meters were connected to IMP 5000 KE Solotron loggers. The data was recorded on a laptop computer at a rate of about one scan per second.
Figure 5. The layout of instruments and measurements (dimensions in mm) [4].
4. Experimental procedure
The wood pallets used in each test were dried overnight in a furnace at 60 ºC (<5% moisture). Before the tests, the weights of the wooden pallets were measured. In addition, the moisture of the upper wooden pallet was measured with MC-300w Humitest wood moisture meter with a measuring range of 0-80 % H2O. The first pile of wood pallets was placed on the weighing
platform at a height 50 mm above floor. In test 1 and 2 the adjacent piles were placed directly on the floor whereas in test 3-12 the piles were placed on an extra Promatect H board in order to keep them at the same level as the first pile. A cube of fibreboard measuring 0.03 m, 0.03 m and 0.024 m was soaked in heptane (9 mL), wrapped with cellophane and was placed on the weighing platform board at the upstream edge of the pile of wood pallets. At 2 minutes from start of the logging system, this cube was ignited. During tests with several piles of wooden pallets, the time of ignition of adjacent piles were clocked and documented manually. After each test, the left wooden pallets or char was dried over a night again and then measured to determine the net weight loss during a fire test. A total of 12 tests were carried out. More detailed information about each test is presented in Table 2.
5. Experimental results
In the following a presentation of the test results is given. A summary of the main results related to maximum heat release rate, ceiling temperatures, heat flux and ignition time are given.
All the detailed test results for each test – with respect to heat release rate - are given in Appendix A.
5.1 Reference tests
In order to obtain the heat release rate of a single pile of wood pallets under varying ventilation velocities, single piles consisting of five wood pallets were burned in the model scale tunnel at centreline velocities of 0.3, 0.6 and 0.9 m/s.
The pallets were put into a 60 ºC furnace one night before the test. The ignition source was a cube of fibreboard measuring 0.03 m, 0.03 m and 0.024 m was soaked in heptane (9 mL),
wrapped with cellophane and was placed on the weighing platform board at the upstream edge of the pile of wood pallets.
The tests were done in order to obtain data for comparison regarding the influence of increasing centreline velocities.
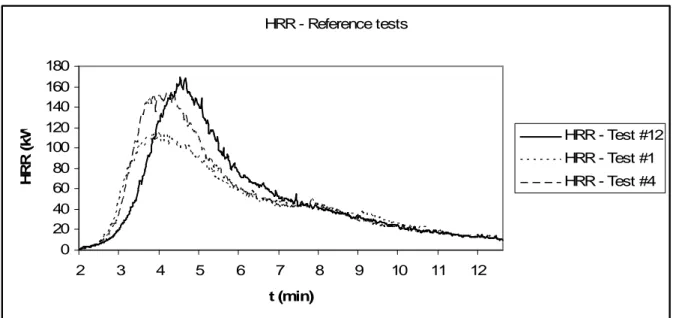
The heat release rate results from these tests are shown in Figure 8.
The peak heat release rate from the test with a centreline velocity of 0.3 m/s was 116 kW, which corresponds to 101 MW according to equation (1), for the test with a centreline velocity of 0.6 m/s, corresponding values were 154 kW and 134 MW, respectively, and for the test with a centreline velocity of 0.9 m/s the corresponding values were 169kW and 147MW, respectively. The heat of combustion, energy content, full-scale mass and full-scale energy content was calculated for the three reference tests. See Table 3 for the results.
Table 3. The results from the reference tests.
Test # u c [m/s] M m [kg] max Q& [kW] max , f m& [kg/s] max q& [kW/m²] max t [s] c H ∆ [MJ/kg] M E [MJ] F m [kg] F E [MJ] 1 0.3 1.719 116 0.083 0.301 132 17.1 29.4 5800 99000 4 0.6 1.687 154 0.209 0.543 142 18.4 31.1 5690 105000 12 0.9 1.732 169 0.265 0.405 162 18.9 32.7 5850 110000
The average value of the heat of combustion for the three cases is 18.1MJ/kg. According to Tewarson [6] the net heat of complete combustion H∆ for pine is 17.9 MJ/kg and the chemical heat of combustion ∆Hc =12.4 MJ/kg.
HRR - Reference tests 0 20 40 60 80 100 120 140 160 180 2 3 4 5 6 7 8 9 10 11 12 t (min) H R R ( k W ) HRR - Test #12 HRR - Test #1 HRR - Test #4
Figure 8. The heat release rates of the three reference tests.
5.2 Heat release rate
In Table 4 the main test results related to the air flow conditions and the heat release rates are given. The test number is given in the first column. The second column shows the average centre line value of the measured longitudinal velocity, uc, measured upstream of the fire. The nominal
values of u can be found in Table 2. The third column show the mass flow rate, m& , based on a
the centreline velocity upstream of the fire. The flow correction coefficient was in our case set to ζ =0.817. The forth column shows the fuel mass burning rate, m& , at the peak heat release rate. f
The fifth column shows the peak heat release rate based on equation (8). In the calculations, a combustion efficiency of χ =0.9 was applied. This value was multiplied with the heat of combustion of 18.1 MJ/kg obtained from the reference tests. The parameter tmax is the time
from ignition when Q&maxoccurs.
Table 4. The results of measurements from test #2, 3 and 5-11.
Test # u [m/s] c m& [kg/s] a m&f,max [kg/s] Q&max [kW] tmax[s]
2 0.241 0.061 0.019 114 146 3 0.782 0.218 0.188 504 233 5 0.755 0.211 0.187 467 242 6 0.774 0.216 0.148 488 257 7 0.765 0.214 0.198 485 194 8 0.747 0.208 0.206 479 211 9 0.723 0.203 0.157 461 245 10 0.699 0.196 0.125 454 272 11 0.687 0.192 0.115 464 305
5.3 Gas temperatures
Test results related to the measured gas temperatures are shown in Table 5. The maximum ceiling temperature at distance xf from the centreline of the fire source is shown in columns two to
nine (identified as T5-T12 in Figure 6). The identification and location of these thermocouples can be found in Figure 6. In columns ten and eleven, the maximum arithmetic average
temperature at thermocouple piles A and B is given. The average ambient temperatures can be found in Table 2.
Table 5. The results of gas temperature measurements from test #2, 3 and 5-11.
Test # 5 T [ºC] 6 T [ºC] 7 T [ºC] 8 T [ºC] 9 T [ºC] 10 T [ºC] 11 T [ºC] 12 T [ºC] A avg T , [ºC] B avg T , [ºC] 2 806 918 783 530 484 343 250 212 235 102 3 683 1020 850 775 804 810 659 519 830 490 5 657 957 832 799 892 860 690 506 857 479 6 658 944 809 737 844 821 766 540 838 538 7 678 962 850 772 848 801 779 547 867 527 8 657 947 800 751 836 812 783 567 864 562 9 647 947 809 724 793 807 787 567 844 552 10 640 931 782 684 814 798 791 599 860 607 11 629 914 778 707 812 759 795 627 874 639
It can be noted from the data in Table 5 that the average gas temperature at site B increases as the last pile is placed closer to site B. The average temperature at site A stays practically constant except for test #2, but in test #2 only the first pile was ignited. The maximum gas temperature at the other sites was practically constant and this could be explained by the fact that the ventilation rate was the same for all tests except for test #2.
The gas temperature data can be used in future validations against theoretical calculation models.
5.4 Total heat flux
The total heat flux measured by plate thermometers positioned at floor level and at different locations from the fire (identified as S24, S25, S26 and S27 in Figure 6.). The heat flux was calculated using an equation where the average gas temperature at the sites was used [1]. In column two to five of Table 6 the maximum heat flux measured with heat flux meters flux 1, flux 2, flux 3 and flux 4 are given.
Table 6. The results of measurements from test #2, 3 and 5-11.
Test # '' 1 q& [kW/m²] '' 2 q& [kW/m²] '' 3 q& [kW/m²] '' 4 q& [kW/m²] 2 0.079 0.299 0.008 0.045 3 0.057 2.555 1.857 0.466 5 0.057 2.554 1.978 0.495 6 0.053 2.757 1.904 0.611
7 0.056 3.208 0.287 0.674
8 0.002 0.0007 0.082 0.033
9 0.047 3.360 2.003 0.827
10 0.044 2.196 2.482 0.915
11 0.050 2.105 2.494 1.105
In test #7 the plate thermometer S26 (q& ) was underneath pile #4, thus the resulting low heat 3''
flux in this case.
The total heat flux data can be used in future validations against theoretical calculation models.
5.5 Ignition time
Test results related to the measured gas temperatures are shown in Table 7. The time of ignition of adjacent piles of wooden pallets was recorded manually based upon visual observations. The ignition time of pile #1 was 2 minutes in all cases.
Table 7. The ignition time of adjacent piles of wooden pallets.
Test # Ignition time of pile #1 [s] Ignition time of pile #2 [s] Ignition time of pile #3 [s] Ignition time of pile #4 [s] 2 120 - - - 3 120 216 249 270 5 120 231 284 303 6 120 225 269 296 7 120 216 259 300 8 120 219 260 315 9 120 230 282 310 10 120 250 303 344 11 120 254 316 355
6. Discussion of results
In the following sections an analysis of the experimental data is carried out.
6.1 Reference tests
When studying the graphs of Figure 8, it can easily be seen that the maximum heat release rate increases with an increasing longitudinal ventilation.
Also test fire #1 and #4 shows an almost identical fire growth rate, whereas the test fire #12 with the highest longitudinal ventilation displays a slower fire growth rate. This could possibly be explained by the fact that the height of the pile of wooden pallets (205 mm) was practically equal to the short side of the pile (200 mm) and the fire was started on the long side, thus as the longitudinal ventilation is increased less parts of the upper portions of the pile is exposed to the tilted flames, resulting in that less parts take place in the combustion during the growth phase and thus the fire growth rate decreases.
6.2 Heat release rate and ignition time
When studying the graphs in Appendix A it can be seen that for test #3, 5, 6 and 7 all pallet piles burn at their maximum almost simultaneously and resulting in a total heat release curve where the pallet piles burn at their maximum at nearly the same time, i.e. the effects of the delay of ignition is not really showing up in the time to reach maximum heat release rate. For test #8, 9, 10 and 11 the distance between the two first piles have been stretched out, delaying the ignition of pile #2 and resulting in that not all piles are burned with their maximum heat release rate at the same time. The delay in ignition can be distinguished by a “hump” before the peak value in the heat release rate curves in Appendix A.
It can also be seen that the peak value of the heat release rate decreases as the distances between the piles are increased – from ~500 kW down to ~450 kW – as the curve is stretched out in time. When studying the ignition times in table 7, it can be seen that for test #2 the longitudinal
ventilation was too low in order to obtain ignition of adjacent piles of wooden pallets. For test #3 it can be seen that the distance between the piles was so short that the ignition occurred almost simultaneously – within less than a minute all three piles were ignited - in the three adjacent piles.
The data in table 7 indicates that the time to ignition of adjacent piles will decrease as the longitudinal ventilation is increased.
The tests that were conducted showed that the ventilation will have an influence on the fire growth rate and the maximum heat release rate.
The data from the tests will be used during the validation work in a future article [7] where the ignition of adjacent fuel objects is investigated using a summation method to calculate the total heat release rate of the included fuel objects. The summation method was applied using the ignition time of the individual piles of wooden pallets. Preliminary results indicate that the method is a possible way forward. The method also indicates that the delay of ignition will result in a “hump” in the total heat release rate curve.
In figure 9 and 10 the test fires with the lowest and highest maximum heat release rate – respectively - are found.
HRR - tes t #10 0 50 1 00 1 50 2 00 2 50 3 00 3 50 4 00 4 50 5 00 2 3 4 5 6 7 8 9 10 1 1 1 2 t (m in) H R R ( k W ) HRR - test #10
Figure 9. The test fire with the lowest maximum heat release rate – test #10.
HRR - t est #3 0 1 00 2 00 3 00 4 00 5 00 6 00 2 3 4 5 6 7 8 9 10 11 12 13 t (mi n) H R R ( k W ) HRR
7. Conclusions
Fire tests were carried out in a 1:15 model scale tunnel. Fire loads consisting of piles of wooden pallets were used in the fire tests. Longitudinal ventilation was tested under different fire conditions. The parameters tested were: the free distance between piles of wooden pallets and longitudinal ventilation rate.
The effects of different ventilation rates on the fire growth rate and the heat release rate were investigated.
The aims of the report were to obtain data which can be used in future studies to validate models to calculate the total heat release rate of multiple objects, to investigate the influence on the heat release rate curve that a varying distance between the fuel objects will have, and to investigate the influence on the heat release rate, fire growth rate and time to ignition for adjacent fuel objects that increasing ventilation will have.
It was found that an increasing ventilation rate also increases the maximum heat release rate, which is in accordance with the earlier findings of Ingason [1].
Also the ventilation rate will have an influence on the fire growth rate, in the tests the case with the highest ventilation rate displayed a slower fire growth rate than the other two cases, this could possibly be explained by the fact that the height of the pile of wooden pallets (205 mm) was practically equal to the short side of the pile (200 mm) and the fire was started on the long side, thus as the longitudinal ventilation is increased less parts of the upper portions of the pile is exposed to the tilted flames, resulting in that less parts take place in the combustion during the growth phase and thus the fire growth rate decreases.
When studying the graphs of the various heat release rates it was found that when the distance between pile #1 and pile #2 increased to a certain level the ignition of pile #2 will be delayed resulting in that not all piles are burned with their maximum heat release rate at the same time. The delay in ignition can be distinguished by a “hump” before the peak value in the heat release rate curves. In cases with short distances between the piles the ignition of adjacent piles took place almost simultaneously and resulting in a total heat release curve where the pallet piles burn at their maximum at practically the same time
The ignition data indicated that the time to ignition of adjacent piles would decrease as the longitudinal ventilation was increased.
Further validation work should take place with respect to validating the experimental data with output data from theoretical models.
Further studies and experiments should take place that vary additional parameters besides the distance between the individual fuel objects. This in order to make further comparisons with calculation models to predict the total heat release rates of complex objects, such as for example a vehicle.
References
[1] Ingason H. (2005), Model scale tunnel fire tests, Longitudinal ventilation, SP report 2005:49, SP Technical Research Institute of Sweden, Borås
[2] Newman J.S. (1984), Experimental evaluation of fire-induced stratification, Combustion and Flame, 57, pp 33-39
[3] Ingason H. and Lönnermark A. (2005), Heat release rates from heavy goods vehicle trailers in tunnels, Fire Safety Journal, 40, pp 646-668
[4] Li Y.Z. and Ingason H. (2010), Model scale tests with automatic sprinklers in tunnels, SP report 2010, To be published
[5] Arvidson M. (2008), Down-scaled fire tests using a trailer mock-up, SP report 2008:42, SP Technical Research Institute of Sweden, Borås
[6] Tewarson, A.(2002), "Generation of Heat and Chemical Compounds in Fires". In The SFPE Handbook of Fire Protection Engineering (P. J. DiNenno, D. Drysdale, C. L. Beyler, W. D. Walton, R. L. P. Custer, J. R. Hall, and J. M. Watts, Eds.), NFPA, Quincy, USA
[7] Hansen R. and Ingason H. (2010), Heat release rates of multiple objects at varying distances, To be published
Appendix A.
HRR - test #1 0 20 40 60 80 100 120 140 2 3 4 5 6 7 8 9 10 11 12 t (min) H R R ( k W ) HRRFigure A.1. The results from test #1.
HRR - test #2 0 20 40 60 80 100 120 2 3 4 5 6 7 8 9 10 11 t (min) H R R ( k W ) HRR - test #2
HRR - test #3 0 100 200 300 400 500 600 2 3 4 5 6 7 8 9 10 11 12 13 t (min) H R R ( k W ) HRR
Figure A.3. The results from test #3.
HRR - test #4 0 20 40 60 80 100 120 140 160 180 2 3 4 5 6 7 8 9 10 11 t (min) H R R ( k W ) HRR
HRR - test #5 0 50 100 150 200 250 300 350 400 450 500 2 3 4 5 6 7 8 9 10 11 12 t (min) H R R ( k W ) HRR
Figure A.5. The results from test #5.
HRR - test #6 0 100 200 300 400 500 600 2 3 4 5 6 7 8 9 10 11 12 t (min) H R R ( k W ) HRR - test #6
HRR - test #7 0 100 200 300 400 500 600 2 3 4 5 6 7 8 9 10 11 12 t (min) H R R ( k W ) HRR - test #7
Figure A.7. The results from test #7.
HRR - test #8 0 100 200 300 400 500 600 2 3 4 5 6 7 8 9 10 11 12 t (min) H R R ( k W ) HRR - test #8
HRR - test #9 0 50 100 150 200 250 300 350 400 450 500 2 3 4 5 6 7 8 9 10 11 12 t (min) H R R ( k W ) HRR - test #9
Figure A.9. The results from test #9.
HRR - test #10 0 50 100 150 200 250 300 350 400 450 500 2 3 4 5 6 7 8 9 10 11 12 t (min) H R R ( k W ) HRR - test #10
HRR - test #11 0 50 100 150 200 250 300 350 400 450 500 2 3 4 5 6 7 8 9 10 11 12 t (min) H R R ( k W ) HRR - test #11
Figure A.11. The results from test #11.
HRR - test #12 0 20 40 60 80 100 120 140 160 180 2 3 4 5 6 7 8 9 10 11 12 t (min) H R R ( k W ) HRR - test #12
![Table 1. List of scaling models [1].](https://thumb-eu.123doks.com/thumbv2/5dokorg/4741931.125776/9.892.98.646.559.928/table-list-of-scaling-models.webp)
![Figure 3. The measurements of the scaled down wooden pallets [5].](https://thumb-eu.123doks.com/thumbv2/5dokorg/4741931.125776/14.892.111.677.369.962/figure-measurements-scaled-wooden-pallets.webp)

![Figure 6. The identification of all the instruments, meters, probes etc [4].](https://thumb-eu.123doks.com/thumbv2/5dokorg/4741931.125776/18.892.115.840.352.844/figure-identification-instruments-meters-probes.webp)