No. 802A - 1996
Discomfort caused by low-frequency motions
A literature survey of hypotheses and possible causes of motion sickness
Johan Forstberg and Torbjorn Ledin
K Z?e
R:
/VET -8233 5>} é a KON ST g? i h. Oy \_ Z/Swedish Road and
VTI meddelande
No. 802A - 1996
Discomfort caused by low-frequency motions
A literature survey of hypotheses and possible causes of motion sickness
Johan Forstberg and Torbjorn Ledin
Swedish National Road and j Transport Research Institute
Publisher: Publication:
VTI Meddelande 802A
Published: Project code:
Swedish National Road and December 1996 70011
& Transport Research Institute
S-581 95 Linkoping Sweden Project:
Comfort disturbances caused by low-frequency motions in modern trains
Author: Sponsor:
Johan Forstberg and Torbjorn Ledin Adtranz Sweden, Swedish State Railways (SJ), Swedish Transport and Communications Research Board (KFB), Swedish National Road and Transport Research Institute (VTT) Title:
Discomfort caused by low-frequency motions: A literature survey of hypothesis and possible causes of motion sickness
Abstract
The concepts of comfort and discomfort, possibly leading to motion sickness signs and symptoms, in the field of transportation and other sources of motion have been reviewed in this report. Comfort, being a subjective feeling for the person exposed to motion, must be measured in a structured way in order to allow evaluation. Relations to physical characteristics of the motion are, of course, valuable hints for designing transportation means if they can be proven to have a sufficient predictive power. This reasoning then leads to an analysis of what types of motion are more likely to cause problems, thus giving the vehicle design engineer a hint of what improvements may be of value to increase passenger satisfaction.
The report outlines the frequency of complaints in different vehicles as reported in the literature. Many modes of transport are accompanied by varying problems with motion sickness. The results from a number of studies of typical motion provocation are related. Different measurement systems from questionnaires of slight symptoms of dissatisfaction to measuring the frequency of vomiting are described.
The peripheral vestibular organs in the inner ear play a very important role in the occurrence of motion sickness, as it is well known that subjects completely lacking functioning vestibular parts of the inner ear are immune to motion sickness. The report thus presents the anatomy, physiology and also mathematical models of the organs in detail, and also how these models fit into the models of motion sickness
generation.
This report is also published as TRITA-FKT Report 1996:39.
ISSN: Language: No. of pages:
0347-6049 English 58+App.
Preface
This work constitutes a part of the research project Comfort disturbances caused by low-frequency motions in modern trains. The project is supported and financed by the Swedish State Railways (SJ), Adtranz Sweden, the Swedish Transport and Communications Research Board (KFB) and the Swedish National Road and Transportation Research Institute (VTI).
Johan Forstberg (BA, MS) is a researcher at VTI, Linkoping and also a postgraduate researcher at KTH (the Royal Institute of Technology) in Stockholm under the supervision of Prof. Evert Andersson, of the Railway Technology department at KTH.
Torbjorn Ledin (MS, MD, PhD) is a physician employed in the ENT department of the University Hospital in LinkGping.
Johan Forstberg has mainly covered the technical and modelling aspects of the problem survey, whereas Torbjorn Ledin has covered the medical parts of the problem. Both are responsible for the views and conclusions expressed.
Acknowledgements
The support of SJ, Adtranz, KFB and VTI in this research project is greatly appreciated.
The authors express their gratitude to Prof. Evert Andersson and MD Lars Odkvist (senior physician at the ENT dept of the University Hospital in Linkoping) for their support and encouragement.
We also want to thank Christina Rutger and Tony Palm for reviewing the English.
KTH TRITA-FKT report 1996:39 VTI meddelande 802A
Contents
SUIMITMAY ces 1
1 cece cece ce ece eee es eee ccc ece cece ssc ccc cece cece ee 1 % BACK@EOUNO rece reese ess terra bases sere reer 355 pve cure s nan 3 2.1 A CONC@pPtU@l DACK§TOUNG errr errr reer srs r rrr ssri reir reese ee 3 2.2 Methods for studies Of MOtION SICKNESS errr rrr errr rrr rrr rrr reek 6 2.3 ThE @PDFOACH sever revere rr rere errr errr re rrr renner erea eae errr eee ed 6 2.4 ThE theOfEtIC@l rrr rrr errr rrr reer rse ever revere reer reer ee 6 3 Description of the vestibular system. How we perceive motion ... 9 3.1 The S@MICITCUI@T C@N@IS ree +v srv erver errr evere errr re rrr rr rrr reek, 1 1 3.2 THE OtOIIth OFFANMS er evr evere irr vv errr vre evere rere errr errr rere rere e. 13 3.3 Co-operation between the vestiDUI@r keer kere e}, 16 3.4 The optimal estimator model for spatial OrMIentat10N 17 4 Hypotheses concerning C@Uuses Of MOtiON SICKN@SS ...cccccccsssssssssccccccccss 23 4.1 Overstimulation of the veSt1DUIAT rre errr reer errr reeks 23 4.2 The sensory rre rrr revers rrr ere rere rr errr ere eee 23 4.3 The Oman control th@eOFY @PPFOACH 6666+ ere sever rre rere reer eee. 27 4.4 An evOIUttON@FY RYDPOTR@SIS rer errr erver seers eres reer reer rere ee. 29
5 Symptoms of and susceptibility t0 MOtiON 31
Su ce o e 31
5.2 Other factors modifying motion sickness susceptibility ...222222.. 22 3.3 SHOE S FPUIES rev rrr ev revere r revere rere rere rrr e rere rere evere rere rere rarer aaa 35 6 Studies of interaction between motion and motion sickness ... N7 6.1 Single sinusoidal vert1C@l OSC1IIAMON 000 reve rv rere errr rere ee 37 6.2 Complex period1¢ vert1C@l OSC1IIAMONS rere erea aree eee keer e 41 6.3 Angular motions with various physical SHIMUI eee 42 6.4 GrOUNG-DAS@U eve revver rere evere reese reer e errr errr rere eee. 47 6.5 Other MOGES Of tFANSDOFT 66s veers srv rrr rr reer rr vv rrr errr errr errr rere ee. 483 ofa Om)ito N B O e 49
7 51
S RefENENICES ee 8598000500 0 53
Appendix A. Notations and general defIMItIONS..sss0sssssssssssccccccccccccccccccccccccccc0es 59 Appendix B. A model for adaptation of the semicircular canals to rotation 61 Appendix C. Frequency responses of the vestibular system ... 63
KTH TRITA-FKT report 1996:39 VTI meddelande 802A
Appendix D. Prediction of motion sickness due to vertical motion ... 65 Appendix E. Motion sickness symptoms in a moving room... 67 Appendix F. Description of Figures @Nd TADIGS 69
KTH TRITA-FKT report 1996:39 VTI Meddelande 802A
Summary
The concepts of comfort and discomfort, possibly leading to motion sickness signs and symptoms, in the field of transportation and other sources of motion have been reviewed in this report. Comfort, being a subjective feeling for the person exposed to motion, must be measured in a structured way in order to allow evaluation. Relations to physical characteristics of the motion are, of course, valuable hints for designing transportation means if they can be proven to have a sufficient predictive power. This reasoning then leads to an analysis of what types of motion are more likely to cause problems, thus giving the vehicle design engineer a hint of what improvements may be of value to increase passenger satisfaction.
The report outlines the frequency of complaints in different vehicles as reported in the literature. Many modes of transport are accompanied by varying problems with motion sickness. In aeroplanes as well as in trains, the incidence is low. In larger vehicles, such as buses and ships, where the passenger is unable to control the motions himself and more often also cannot predict the upcoming motions, more subjects seem to suffer. Similarly there is a difference between driver and passengers in cars. The importance of vertical motions, typically in a ship on a rough sea, has long been known. The influence of lateral accelerations and roll motions has not been studied so closely. These factors are probably of great importance in modern high speed trains, which are often made to tilt actively during curving in order to increase speed on existing railway tracks. Tilting trains may have raised the very low level of incidence of motion sickness associated with train travel, but compared with other modes of transport it is still relatively low.
The peripheral vestibular organs in the inner ear play a very important role in the occurrence of motion sickness, as it is well known that subjects completely lacking functioning vestibular parts of the inner ear are immune to motion sickness. The report thus presents the anatomy, physiology and also mathematical models of the organs in detail, and also how these models fit into the models of motion sickness generation.
Three models of motion sickness are presented. The first is the overstimulation model where the motion stimulus is too large for the neural centres to handle, thereby causing motion sickness. This theory does not explain many aspects of motion sickness, i.e. how a moving visual field can cause problems in the absence of subject motion. The most popular theory is the sensory conflict hypothesis, where a mismatch between expected and observed motion is postulated to result in sickness symptoms. A third hypothesis which explains why frank motion sickness ultimately leads to vomiting is that the interaction between the sensory systems results in a detection of a possible neural poisoning (though erroneous), as the signals do not correspond completely. A reasonable activity for the body is in this case, is to eliminate the possible source of the poison, i.e. by emptying the stomach.
1 KTH TRITA-FKT report 1996:39 VTI meddelande 802A
The results from a number of studies of typical motion provocation are related. Different measurement systems from questionnaires of slight symptoms of dissatisfaction to measuring the frequency of vomiting are described.
KTH TRITA-FKT report 1996:39 11 VTI Meddelande 802A
1 Introduction
Comfort - discomfort
Comfort has both psychological and physiological components. According to Richards (1980) comfort involves a sense of subjective well-being and the absence of discomfort, stress or pain. However, comfort is defined not only by the absence of negative attributes. Comfort is experienced positively to various degrees. Comfort involves evaluation; it is felt to be good and the opposite is felt to be bad. The only way of finding out whether a person is comfortable or not is to ask the person in question.
Ride comfort
Ride comfort is a person's reaction to a set of physical conditions in a vehicle environment, such as dynamic, ambient and spatial factors. Dynamic factors consist of accelerations and changes in accelerations in all three axes (lateral, longitudinal and vertical), angular motions (roll, pitch and yaw) and also sudden movements such as shocks and jolts. The ambient factors may include temperature, pressure, air quality, ventilation and the spatial factors may include workspace, leg room and seating (Oborne 1976, Richards 1980).
Motion-related comfort
However, ride comfort can also be used in a narrower sense (ride quality) taking only the motions of the vehicle into consideration. Ride comfort in this sense can be divided into a mean ride comfort level, regarding only accelerations (lateral, longitudinal and vertical) in a frequency interval from 0.5 Hz to 80 Hz, comfort disturbances due to low-frequency motions such as jerks and jolts! (<0.5 Hz) and discomfort due to prolonged low-frequency linear and angular motions (Urabe et al 1966, Harborough 1986a, b, Forstberg 1994, ISO 1995, CEN 1995, Suzuki
1996).
Comfort disturbances due to low-frequency motions
Comfort disturbances (or comfort experiences) are very complex phenomena. There are two types of reactions to comfort disturbances caused by motion with a low-frequency content. The first is a direct comfort disturbance caused by sudden movements of the vehicle or strong lateral accelerations resulting in discomfort such as difficulties in walking, standing, reading or writing. The other type of discomfort results in dizziness, headache or nausea after a shorter or longer period of travelling. There are different names for this indisposition depending on the provocative environment. Typical names are seasickness, travel sickness, air sickness, etc. Common scientific terms are motion sickness and kinetosis (Reason 1978, Benson 1988, Lawther and Griffin 1987, Griffin 1990, Forstberg et al 1996, Ohno 1996). This paper describes present knowledge regarding motion sickness caused during travelling.
\ Jerk is the rate of change in lateral acceleration. In train environment, jerk is associated with the change of lateral acceleration in transition curves. Jolt is a sudden motion caused by passing a switch or some track alignment fault, causing comfort disturbances to the passengers.
I KTH TRITA-FKT report 1996:39 VTI meddelande 802A
Scales for judging motion sickness severity
Commonly used scales is Vomiting Incidence (VT) or Motion Sickness Incidence (MSI), which corresponds to the percentage of the test population vomiting. A used scale for judging the severity of motion sickness is the Graybiel scale (Graybiel et al 1968), which gives a number of points to different symptoms of motion sickness creating a scale from Slight Malaise (M I) over Moderate Malaise (M IA, M IB) and Severe Malaise (M III) to Frank Sickness (S8). Another way is letting the test subjects to rated their well-being on a scale from I feel all right to I feel absolutely dreadful (Lawther and Griffin 1987, Griffin 1990).
KTH TRITA-FKT report 1996:39 2. VTI Meddelande 802A
2 Background
Motion sickness is a complex psychological and physiological phenomenon and there are no apparent direct relations between motion and degree of motion sickness. For example, a youngster may be thrilled by riding a roller coaster with high levels of lateral and vertical accelerations as well as high levels of angular accelerations. Such a ride does not provoke sickness or discomfort, but on the quiet journey home in a car, he may become carsick. Also situations with no physical input from accelerations but with the visual scene moving in a reliable and foreseeable way, can provoke motion sickness symptoms.
Hippocrates (approx. 400 BC) declared that sailing on the sea shows that motion disorders the body. In other words, he was aware that seasickness is caused by motion. Periodically, this knowledge was then forgotten (quoted from Reason,
1974).
Motion environment
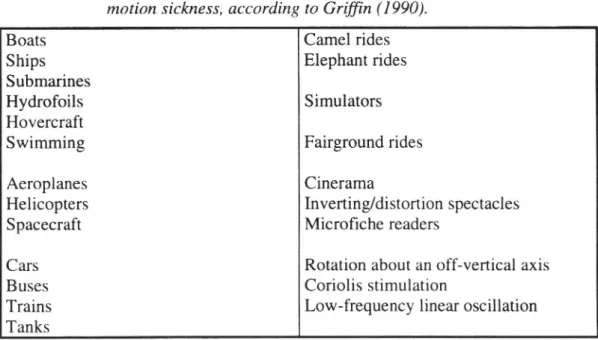
Motion sickness can be evoked in many different types of environments, both with and without motion, but what they have in common is that there is a sensation of motion, sensed through the vestibular system, the eyes or the proprioceptive system*. A list of different environments, activities or devices which can provoke motion sickness is shown in Table 1 below.
Table 1 Examples of environments, activities or devices which can cause motion sickness, according to Griffin (1990).
Boats Camel rides
Ships Elephant rides
Submarines
Hydrofouls Simulators
Hovercraft
Swimming Fairground rides
Aeroplanes Cinerama
Helicopters Inverting/distortion spectacles
Spacecraft Microfiche readers
Cars Rotation about an off-vertical axis
Buses Coriolis stimulation
Trains Low-frequency linear oscillation
Tanks
There are large differences in the percentages of people feeling nausea or motion sickness when comparing different modes of transport, see Table 2, where different findings are put together. Note that the values in Table 2 are given in
° Superficial and deep sensations from the special sensory units located in the skin, muscles, tendons and joints. These sensory units record pressure, tension and muscular contraction caused by e. g. gravity and inertia (Henriksson et al 1972).
3 KTH TRITA-FKT report 1996:39 VTI meddelande 802A
different contexts and shown here for a brief estimation of the variation of motion sickness severity. Different values cannot be simply compared with each other.
Table 2 Findings from different reports concerning symptoms of motion sickness from different modes of transportation are put together. Note that sources differ in definition of categories and subjects. The values are given in different contexts and cannot be simply compared. They are shown here for a brief estimation of the variation of motion sickness severity.
Not feeling Nausea Motion sick" Motion sickness
well experience"" Cars 3-4% 36% Buses: (Britain) 23%" 10% 1%" 19%" (Sweden) 28%C"" Aircraft <1% © <0.59%(:"" 9% <8%(l.iv) Boats 21%" 1%°* 26%" 30% 7%, up to 40%" Trains: Trains (USA) 0.13%" Trains (Britain) 4% Trains (Sweden) 79%" TGV Duplex 4p} _ 2940" JNR type 165 A% o" Tilting trains: JNR type 381 26% 2%" X2000 sensitive subjects 13%" 9% 0%" X2000 modified, sensitive 8%" 6% 0%*
Sources: (1) Money (1970), (2) Turner (1993), (3) Bromberger (1996b), (4) Lawther and Griffin (1988a), (5) Lawther and Griffin (1988b), (6) Bromberger (1996a), (7) Ueno et al (1986), (8) Result of the study reported in this thesis; Report B, (9) Kaplan (1964), Kottenhoff (1994).
Remarks: 1 Definition varies from different authors. In most motion sick is defined as vomiting. ii A motion sickness experience sometime in life in this type of vehicle/vessel. ii1 Average for 1 million airline passengers before high flying aircraft were used. iv Estimate when "motion sickness strikes in any one aeroplane".
TGV: Train a Grande Vitesse. French High speed train. TGV Duplex: two level train JNR: Japanese National Railways
Review papers
Motion sickness has been described by many authors. The lecture series from the Advisory Group for Aerospace Research & Development (AGARD 1991) is one of the latest and has very informative contributions. In that volume, 12 different authors discuss different aspects of motion sickness and possible treatments. Further surveys that can be recommended are: Kennedy and Frank (1986), Oman (1988) and Benson (1988). Money's (1970) classical review has many references. Modern textbooks on vibration, such as Griffin (1990), have an informative chapter about motion sickness. Crampton's (1990) Motion and Space Sickness is another modern textbook. The classical books by Reason (1974) Man in motion: The psychology of travel and Reason and Brand (1975) Motion sickness are well KTH TRITA-FKT report 1996:39 4
Background
worth reading. A very extensive reference list can be found in the above-mentioned lecture series from AGARD (1991). A review in Swedish especially for naval use is Magnusson and Ornhagen (1994), also containing an extensive reference list.
Literature search
A literature search has been performed in the following databases: Biopascal, Biosis, Cisdoc, IRRD, Hseline and Medline. Papers have also been selected for study from the reference lists from different papers, especially AGARD (1991) and Magnusson and Ornhagen (1994).
2.1 A conceptual background
MOTION I Drugs I I Alcohol I I Experience I m I
ENVIRONMENT | ________I ____________I____________ I ____________ I ---1 | Adaptability || |Retentiveness | ' Visual system I I i | Sensory % i
j thresholds I Cognition and memory I (
t .1 I I |___| Yawning
Variations in translational > @-») Awareness *" interpretation i Colour changes or rotational acceleration i & of s of : gregztllar breathing of body or other stimulation [+3 » motion & motion [---I] Oginegi of visual, vestibular and ( Semi-circular I Headaches
somatosensory systems I [--* canals | siness
h A . Drow Nausea 1 ; Vomiting 1 Somatosensory p ? f system |I i t t oms :
$\ I Reflex responses I< - of reflexesication 11
Voluntary I4 1 I
movements c 1
|
T
|
T
31mg; I Posture I Age I I Gender I
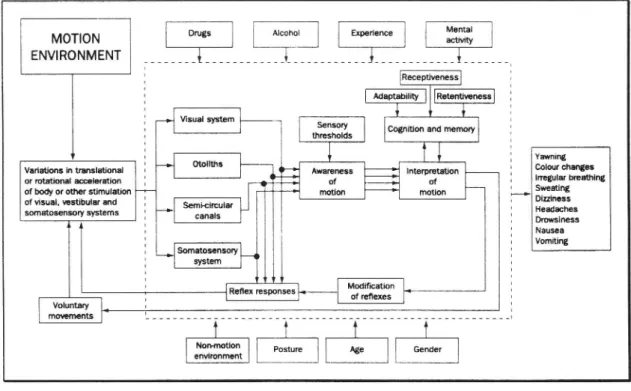
Figure 1 A conceptual model of factors possibly causing motion sickness. From Griffin (1990).
Figure 1 shows a model of factors possibly involved in provoking and modifying motion sickness. Provoking factors are mainly low-frequency linear and angular motions, which are sensed and registered by the vestibular system (semicircular canals and otoliths), vision and the propriocetive (somatosensory) system. The signals are transmitted to the central nervous system (CNS), where they are interpreted as an awareness of motion. Modifying factors are, for example, age, gender, posture, drugs, alcohol, experience and mental activity (Griffin 1990). All sensory information (visual, vestibular and proprioceptive) is co-ordinated, integrated and stored in a data centre (located in the cerebello-brainstem area). This complex system can be affected by psychological factors such as emotion, learning, alertness etc. Movements form patterns, which are continuously compared with previously stored sensory patterns. This comparison at a subconscious level permits triggering of appropriate muscle groups to maintain balance, making it possible to walk, run, cycle or perform other activities. When ia} KTH TRITA-FKT report 1996:39 VTI Meddelande 802A
encountering a new combination of movements, we are immediately aware of this and new patterns can be built up to handle the new information. During this process, the input stimulus provokes autonomic nervous reflexes such as pallor, sweating, nausea and vomiting (Henriksson et al 1972).
2.2 Methods for studies of motion sickness
From a methods point of view, two different approaches for studying motion sickness can be distinguished. One is empirical, 1.e. the number of persons who suffer from motion sickness in different types of motion is measured and the results are then compiled into formulas or models. The other is a more theoretical approach, i.e. trying to explain why motion sickness is provoked. There is no exact delimitation between these two approaches, but a hypothesis must contain both statements and facts that can be verified.
2.3 The empirical approach
The empirical approach is the most common and so far the most successful. A number of subjects are exposed to different types of movements (linear, pendular, rotational or combinations of these) simultaneously with the registration of the subjects' degree of motion sickness (Alexander et al 1947, McCauley et al 1976, Miller and Graybiel 1973, Guignard and McCauley 1982, Lawther and Griffin 1987, Guedry et al 1990). McCauley et al (1976) suggested a mathematical model for predicting the degree of motion sickness from vertical accelerations. This model is explained in Chapter 6.
Different models for predicting motion sickness from a number of measured biophysiological variables such as pulse rate, blood flow through the fingers, skin resistance, etc., have been presented and evaluated (Harm 1990, Kennedy et al
1990, Hartle 1986).
Another alternative is to interview a considerable number of persons or to ask them to fill in a questionnaire concerning motion sickness symptoms. Simultaneously, the motions of the vehicle are registered (Lawther and Griffin 1986, 1988a, 1988b). From their own measurements those of McCauley et al (1976) and Alexander et al (1947), Lawther and Griffin (1987) elaborated a new prediction model for the degree of motion sickness concerning vertical accelerations. This model is much more simple than the corresponding model by McCauley et al (1976) and is based on the concept of motion dose. The motion dose is time integrated vertical acceleration filtered by a filter (a,) with maximum transmission from 0.1 - 0.3 Hz (Griffin 1990). See also Chapter 6 and Appendix C, Figure 34). This work is now accepted as an international standard for predicting motion sickness caused by vertical motion (BSI 6841 1987, ISO Standard 2631 1995).
2.4 The theoretical approach
The theoretical approach of formulating an overall hypothesis has not been particularly successful. No such hypothesis has been able to predict the number of persons who will suffer from motion sickness as a result of a given motion or stimulus. These hypotheses have, however, increased understanding of the
KTH TRITA-FKT report 1996:39 6 VTI Meddelande 802A
Background
underlying causes of motion sickness and offer a possibility of reducing the risk of suffering from motion sickness.
Early hypothesis
Wallaston (1810) suggested that fluid shifts within the body ("blood sloshing in the brain") was the cause of motion sickness. This theory had its successors in space research as it was proved that body fluids are redistributed in the body in a weightless condition (fluid shift theory, Steele 1968, Nicogossian and Parker
1982).
Another hypothesis is that the vestibular organs and above all the otolith organs are overstimulated. This would then result in leakage of signals from the vestibular nuclei to the brainstem and thus provoke motion sickness (de Wit 1953, Jongkees 1967).
Sensory conflict hypothesis
Irwin (1881) and Claremont (1931) were the earliest exponents (according to
Reason 1978) of a hypothesis that would be named the sensory conflict
hypothesis. Reason formulated it more precisely as the sensory rearrangement
hypothesis (Reason 1970, 1978, Reason and Brand 1975). In 1988, Benson
formulated it by the name of the neural mismatch hypothesis as follows:
"In essence, the newral mismatch hypothesis states that in all situations
where motion sickness is induced there is a conflict, not just between the
signals from the eyes, the vestibular apparatus and other receptors stimulated
by the motion, but that these signals are also at variance with those that the
central nervous system expects to receive" (Benson 1988).
The sensory conflict hypothesis and the posture control system have been
formulated in terms of modern control theory by Oman (1982, 1988) and Borah et
al (1979, 1989).
An evolutionary hypothesis
There were objections to the sensory hypothesis from Treisman (1977), Money
and Cheung (1982) and Money (1991). They were of the opinion that the sensory
conflict hypothesis cannot explain why persons with no functional vestibular
organs cannot suffer from motion sickness or why we suffer from motion sickness
instead of, for example, coughing vigorously. Motion sickness has no survival
value, rather the contrary. Treisman is of the opinion that the body maintains three
spatial reference systems based on the signals from the eyes, the vestibular organs
and the proprioceptive system. These are continuously evaluated, compared and
calibrated with one another. Such a delicate interaction between these reference
systems could be an excellent detector for different types of neurotoxins.
Unfortunately, this detector is also provoked by certain types of motion.
"Motion sickness is a poison response provoked by motion. It is a poison
response provoked by motion acting (directly or indirectly) on the vestibular
system"" (Money 1991).
Far from a fair understanding
Kennedy and Frank (1986) point out the fact that we are far from a correct
understanding of the phenomenon of motion sickness. They indicate the need to
7
KTH TRITA-FKT report 1996:39
VTI Meddelande 802A
join the different hypotheses into a uniform one. Their opinion is that a clue to the explanation of the phenomenon of motion sickness is understanding the influence of varied motion stimuli on the receptor level. They think motion sickness is a result of decorrelated sensory canals. This decorrelation could arise when the motion signals are not in phase with what the body is expecting, or because of the way the body is constructed to register and interpret motion.
This survey
This survey reports certain basic facts concerning motion sickness, and different hypotheses regarding the causes of motion sickness. It also points out possible phases in continued research. There is a comprehensive description of the vestibular organs as they are of great importance in the occurrence of motion sickness.
KTH TRITA-FKT report 1996:39 8 VTI Meddelande 802A
3 Description of the vestibular system. How we perceive motion
The Postural System
D Central Con-
Co-Central processing of scious. Postural ordinated <P
information output
pathways
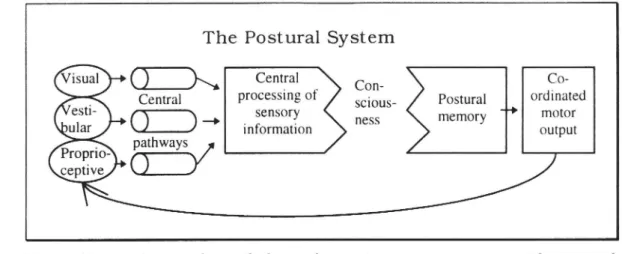
Figure 2 The visual, vestibular and proprioceptive systems provide postural information for central integration. A disturbance of any system at any level may cause imbalance and dizziness. Modified from Henriksson et al (1972) and Henriksson (1974).
Man has the capability to control his posture and motion to his surroundings. This capability is based on by the postural information from:
1. Sensory information from the non-auditory (vestibular) part of the inner ear. 2. Visual information.
3. Proprioceptive information
The messages from all these sensory organs are integrated by a cell network in the cerebello-brainstem area. This central processing unit supplies complete information on position and movement to the individual. Ordinarily, this integration is performed at a subconscious level. However, when a person encounters unusual or difficult circumstances, this process and the interpretation of posture information becomes a conscious phenomenon.
The stimulated receptors activate muscles or groups of muscles for posture and motion. The motor output is in turn controlled by co-ordination centres in the cerebellum and the extrapyramidal system. When we move, new postural information from the vestibular, visual, and proprioceptive systems is continuously gathered and evaluated - the postural system uses a form of feed-back from the motor output to register new signals from the sensory systems, see Figure 2.
The three sensory systems create normally an overflow of postural information (redundant information). If one of the systems has reduced or no capacity, we can usually maintain our balance, but it is only the proprioceptive system that can provide enough information for a human to maintain an upright position by himself.
9 KTH TRITA-FKT report 1996:39 VTI Meddelande 802A
A suggested book for further reading is Handbook of Sensory Physiology, Vol. VI/2. Vestibular system, Part 2, edited by Kornhuber (1974).
The vestibular system
Vestibular Function
Orientation of semicircular canals
[ Plane of ou Ant. Duct Plane of Lat. Duct Plane of x Post Duct -<gm-Semicircular canals .;n, £ -O A 00, Ana. Aovip. 6. Otolith organs Utricle Cochlea
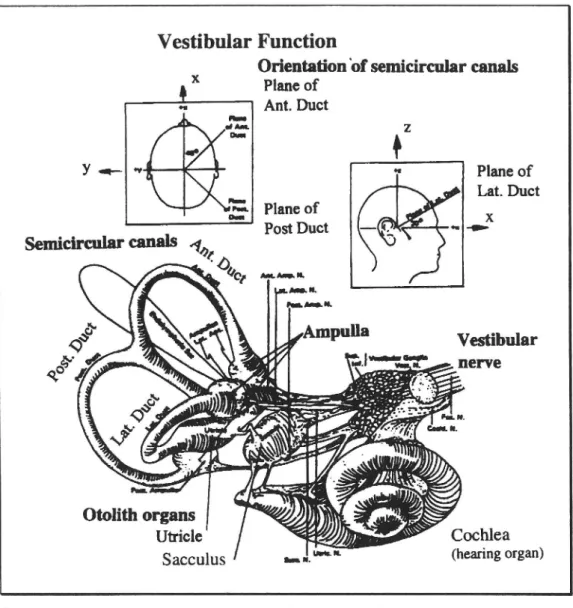
Sacculus (hearing organ) Figure 3 The inner ear, showing the semicircular canals and otolith organs
(utricle and saccule) Inset figures illustrate planes of the semicircular canals and the x, y and z head axes. Modified from Guedry (1991a).
The vestibular system consists of the peripheral and the central vestibular system. The functions of the vestibular system are:
1. To inform the CNS any linear or angular acceleration or deceleration.
2. To aid visual orientation by eye muscle control, the so-called vestibulo-ocular reflex (VOR).
3. To control skeletal muscular tonus for maintenance of adequate posture. (Henriksson et al 1972 and Henriksson 1974).
KTH TRITA-FKT report 1996:39 10 VTI Meddelande 802A
Description of the vestibular system
The peripheral vestibular organs
The vestibular organs consist the semicircular canals and otolithic organs (see Figure 3). They are found in the inner ear together with the auditory part (the cochlea). There are three semicircular canals, which detect angular accelerations of the head and are not affected by linear acceleration or different orientations relative to gravity (Guedry 1991a). They cannot detect static information, which means that a blind folded person after several rotations normally does not know which direction he/she is facing.
The two otolith organs are located in the bag-shaped extensions (utricle and saccule). They are susceptible to linear accelerations and detect both static and dynamic accelerations. Using information on the direction of the earth gravity (g), the central nervous system (CNS) can normally maintain an orientation in relation to the vertical but normally not the absolute position, angle or speed (Guedry 1991a). The vestibular organs are remarkably small. The sensitivity area of the otolith organ is about 2 mm" (Grant and Best 1987) and the radius of the semicircular canals is 3 mm (Young and Oman 1970).
3.1 The semicircular canals
The semicircular canals detect angular acceleration and are not influenced by linear oscillation or by the field of gravitation. They react in the same way to rotation regardless of whether they are at the centre of rotation or at a distance from it. Each semicircular canal records rotations in its plane (rotation vector perpendicular to its plane) and the CNS performs a vector addition of the rotations from all three canals to a total vector of rotation. The semicircular canals are located at an angle of approximately 90 degrees to each other. The plane of the horizontal canal is at an angle of about 30 degrees to the plane of the x-y plane, see Figure 3. The planes of the vertical canals are at angles of about + 45 degrees to the x-z plane.
Each canal is filled with a fluid (endolymph), which through its inertia will generate a flow in the opposite direction to the rotation. The strength of the flow is, at least for frequencies of natural head movements, proportional to the integrated acceleration (Guedry 1974, Young and Oman 1970, see also Figure 4 and Appendix B). The flow will force the active sense organ, the cupula, located in the ampulla, to deflect. The cupula is a gelatinous substance acting as a door measuring the flow of fluid in the canals by its deflection. Sensory cells are located at the base of the cupula and sensory hairs penetrate the cupula, detecting its deflection. Because of this construction, the sensory signal to the CNS corresponds to the angular speed at all normal frequencies, even if it is the angular acceleration that is the primary cause of the flow of fluid (Young and Oman 1970, Guedry 1974, Mayne 1974, Guedry 1991a). The CNS (vestibular nuclei) can then integrate the signal in order to estimate the total rotational angle of the head (Henriksson 1974, Guedry 1991).
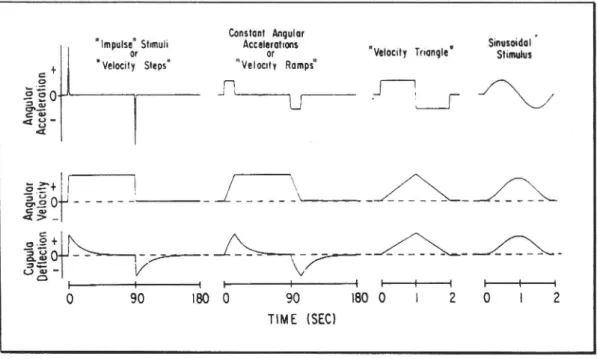
Figure 4 shows the expected cupula deflection for four different types of motion stimuli. The two first stimulus inputs clearly show the effect of adaptation. This means that the deflection of the cupula and therefore also the signal to the CNS return towards zero, mainly because of the internal viscosity of the fluid and damping. A rotation with constant speed cannot be detected by the vestibular
11 KTH TRITA-FKT report 1996:39 VTI Meddelande 802A
system after about 60 seconds. The last two stimuli show that in normal movements of the head, the response of the canals is that of angular velocity because of the integration performed by the sensing mechanism, i.e. the flow of the endolymph (Guedry 1974). A model for canal response to rotation is shown in
Appendix B.
'
a
Impulse Stimuli
a
Constant Angular
Accelerations
Sinusoidal
o p ®
or
or
"Velocity Triangle"
Stimulus
® Velocity Steps"
"Velocity Ramps"
i
U
A r
-p
An
gu
io
r
Acc
ele
rat
ion
' O sEt)______ L _/ 122 NM X Z SeEaso -= - mam- - _ Romer - oak ___A 222-322NQ _L- _L LOS
3% - / V
+ + -- - + J
0 90 180 0 90 180 0 | 2 0 | 2
TIME (SEC)
Figure 4 Angular acceleration, angular velocity and expected deflection of the cupula during four stimulus patterns. Note the different time scales (Guedry 1974).
Transfer function
The transfer function of the semicircular canals has been recorded, for example, by Fernandez and Goldberg (1971) on squirrel monkeys. They have summarised their findings in the following transfer function (from Mayne 1974):
o TLS 1+ T ,s
(1+1,s) (1+1T,s)(1+7T,58) H(s)
where H(s) refers to an angular acceleration as input and a cupula deflection as output.
T., = the adaptation time constant [s]
T. = the leading component time constant [s]
T; = the lower response limit [s]
T» = the upper response limit [s]
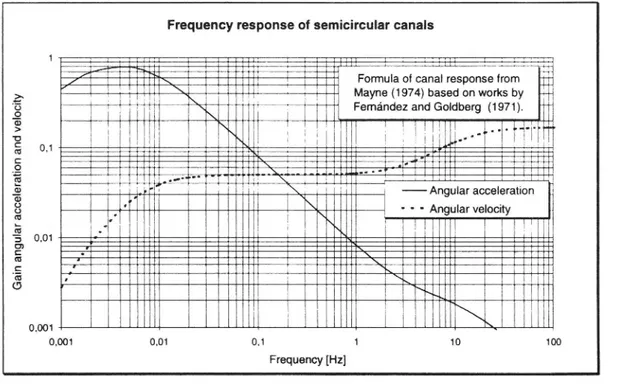
Normal values for man are t, ~ 80 s, t; = 0.045 s, t;=20 s and t» = 0.013 s (Mayne 1974). Figure 5 shows the transfer function of the canals with the above data and formula. The two curves represent angular acceleration and angular velocity as input. The output is the estimated cupula deflection. See also Appendix C.
Other considerations
The upper frequency limit of the system is limited by the number of impulses per second the sensory cells can discharge.
KTH TRITA-FKT report 1996:39 12 VTI Meddelande 802A
Description of the vestibular system
There is also a minimum deflection of the cupula before the firing frequency starts to change. This threshold is estimated to be a step of 2 °/s in angular velocity (Borah et al 1989) or in the range 0.2 - 2.0 °/s5" (Guedry 1974) for rotation about the x-axis and z-axis.
Frequency response of semicircular canals
Formula of canal response from Mayne (1974) based on works by Femandez and Goldberg (1971).
[ol «~ 0,1 --- Angular acceleration - * " Angular velocity 0,01 Ga in an gu la r ac ce le ra ti on an d ve lo ci ty 0,001 0,001 0,01 0,1 1 10 100 Frequency [Hz]
Figure 5 Frequency response of a semicircular canal. From Mayne (1974), based on the model by Fernandez and Goldberg (1971).
The semicircular canals in one ear work in co-operation with the corresponding canals in the other ear. Thus, so a rotation which bends the cupula in one direction in a canal in one ear bends it in the other direction in the corresponding canal. This co-operation extends the linearity of the canals (Henriksson 1974). The transfer function is then changed when considering both the afferent dynamics and the co-operation and interaction of canals in both inner ears (Borah et al 1989).
3.2 The otolith organs
The otolith organs are susceptible to dynamic linear acceleration and static forces. There are two organs in each inner ear. They are oriented vertically and horizontally. The susceptible part of the organ has an area of about 2 mm* and consists of a thin layer (20 - 30 um) of heavy crystals (otoliths) with a density of 2.4 kg/dm3 embedded in a gelatinous substance with a density of 1.0 kg/dm'. The resulting layer has a density of about 2.0 kg/dm'. This layer lies on top of a gelatinous substance with about the same thickness as the otolith layer (Grant and Best 1987), which is penetrated by the hairs of the sensory cells. The sensory cells are divided into two areas (the striolar and the peripheral). The peripheral cells react on the position (x) and the striolar cells on the velocity (x) of the otolith layer (Grant and Best 1987). This means that the organs act as a seismic instrument sensing the inertia of the heavy material (Young and Meiry 1968).
13 KTH TRITA-FKT report 1996:39 VTI Meddelande 802A
The otolith organs cannot discriminate whether a constant horizontal acceleration depends on an actual acceleration or if the body has turned in the field of gravitation. This condition is exploited in various fairground devices. Normally, a dynamic signal is interpreted as an acceleration, while a static acceleration is interpreted as a change in inclination (tilt illusion) (Borah et al 1989). A visual control can provide sufficient information for the CNS to obtain a correct picture of the situation (Guedry 19912).
Model and transfer function
A revised otolith model was presented by Young and Meiry (1968) as shown in Figure 6. The model assumes an absolute threshold of approximately 0.05 m/s, which agrees with a latency time of 5 seconds for an acceleration of 0.01 m/s.
Accel- Mechanical Mechanical Neural
eration model of otolith threshold processing ,
. Perceived stimulus accelerometer
.
acceleration,
d
/
tilt
s=
(s + 0.076)
|_"
"_
(s+0.19)(s+1.5)
Otolith dis-
/
placement (d)
w r t macula
Figure 6
Revised non-linear otolith model after Young and Meiry (1968).
h \c. | i L 1 Po =
Q1] = (1 22
__
SIL
LY I;
Po (I+Ts)(1+T,s)
i} _ _Pey
___
LZ
LY |;
P, (I+Ts8(0+T,s)
response from peripheral cell
response from striolar cell
density of otolith layer (= 2.0)
density of gelatinous layer (= 1.0)
10 s, 7; = 0.0002 s
input acceleration , y = (g, - a,),
where g, and a, are the gravitation
and acceleration input vector
components along the x-axis
relative displacement of otolith
layer
Laplace transform variable.
The model predicts that the otoliths will act as a
velocity transducer over a mid-frequency range
from 0.19 - 1.5 rad/s (0.03 - 0.24 Hz). For a
static acceleration (force) the static sensitivity to
a perceived tilt or acceleration is 0.4 (Young and
Meiry 1968). See also Appendix C for figures on
frequency responses and latency times, i.e. the
time elapsing before a specific force input can
be registered.
Mayne (1974) stated that the frequency
bandwidth for otolith response is surprisingly
narrow. The corresponding time constants of
this system are T; = 10 s and T, = 0.33 s (0.016
-0.5 Hz). The long time constant is considered
correct by most researchers (Grant and Best
1987) because the overall system (otolith organ,
nervous transmission, CNS processing and eye
motion dynamics) can easily follow such a slow
system. However, Grant and Best argued that the
short time constant is much smaller (T), = 0.0002s, 800 Hz). With this time
constant and within small amplitudes, a linear system frequency response system
can be applied. With larger amplitudes, the stiffness of the gelatinous layer is
non-linear. The resulting transfer function for the otolith organ is shown to the left and
in Figure 7. The peripheral cells (P) produce a signal proportional to x (position of
KTH TRITA-FKT report 1996:39
Description of the vestibular system
the otolith layer) and the striolar cells (S) a signal proportional to x (Grant and Best 1987). sb AR _ S 4 d - e a e @
» 204 10- Transferfunctionforotolithorgans
04 i- ._2- 4 0._2- 0-~85. _
F
Y ip] v Is
- 8
0-- 1000--
\
- 1207
- i 40
00 1
01
4
1
10
100
1000
10
a
@ - rad/s
081
201
.i
1
'o
1090
1000
f - Hz
{
s
180-o
|_x..| IAI
o
"
9 O-
\
y lr.] y Is
f
P
o
tie
M
o
C
- 180-"
p. ¥ k 1 I |J # J I 001 .01 c 1 10 180 1000 o' _ u - rad/s J ¥ T J T 001 .01 1 1 10 100 1000 f - HzFigure 7 Bode plot of transfer function for human otolith organs after Grant
and Best (1987). Upper curves show the response from the
peri-pheral sensory cells and lower curves show the response from the striolar cells.
The resulting Bode diagram for the response of the human otolith organ is shown in Figure 7. The broken line represents a 10° increase in the stiffness parameter of the gelatinous layer between the otolith crystals and sensory cells. The curved portion near the lower corner frequency represents a transition between those two
stiffness values. The linear part of the broken line (constant gain) probably
represents more closely the gain in this low-frequency range (Grant and Best
1987).
Upper frequency limit of posture control
The practical upper frequency limit is much lower for posture control and for
balancing than the upper frequency limit of the individual vestibular organs
themselves.
15 KTH TRITA-FKT report 1996:39
An upper limit for the posture system and limb control (sensing organs, transmission signals, CNS handling and muscle control) can be estimated by balancing a stick (pen) on a finger}, see Figure 8. The upper limit seems to be in the area of 5 - 10 Hz. This possible illustrates of one of the difficulties that an infant can experience when
Balancing a stick
v (angle of stick)
V trying to stand alone without Figure 8 Balancing a stick. Input support. The body is too short and is acceleration (u) and the system of posture control has a output is angle (v) of bandwidth which is too low. the stick.
3.3 Co-operation between the vestibular organs
Information from both the semicircular canals and the otolith organs is required in order to enable the body to uphold spatial information. Together with visual impressions and information from the proprioceptive system, a comprehensive picture of the position of the body and its movements is obtained. There must be agreement in the information from all these organs. A rotation of the head by a standing person in the earth horizontal plane (yaw rotation) gives only a response from the semicircular canals while a rotation such as roll or pitch also must produce a change in the otolith signal because of the change in the vertical orientation of the head. A rotation of the body from the hip (e.g. bending forward) gives another combination of signals than the pure pitch of the head, despite the fact that the angular change and possible also the angular speed are the same. This is because of the longer distance of the head from the rotation centre and the
3 Balancing a stick on a finger. Example of control of an instable system (Ljung & Glad 1995). Length of stick = /, Mass of stick = m. Input signal u is the acceleration of the finger and output signal y is the angle of the stick. Consider the movement of the stick along a line in the space. The position of the stick along that line is x.
Then: u=d'x/dt' (acceleration of finger)
The point of mass of the stick has the co-ordinates (x,y): x+ /2 sin(v) and /2 cos(v) By using Newton's second law and eliminating the force F from the equations, we obtain:
é}? - 2 sin(u) = -u cos(u)
For small angles we obtain the transfer function G(s): -2 / I
3 -% [ G(s) =
The positions of the poles of G(s) are +(2g/l)" and the system is unstable. To be able to stabilise the system, the bandwidth has to be sufficiently greater than the instable pole, that is about 2n-(2g/1)V [rad/s]. A good estimation of the upper limit of the eye - hand control is 10 Hz, which corresponds to stick with a length of about 0.20 m. A stick with a length of 1 m, which most people can handle, corresponds to a frequency of (20) ~ 4.5 Hz.
KTH TRITA-FKT report 1996:39 16 VTI Meddelande 802A
Description of the vestibular system
accompanying acceleration, rotation and deceleration of the movement (Guedry
199 1a).
-Normally, head movements in an upright position produce a strong correlation
between information from the signals of the otoliths and the vertical semicircular
canals. A rotation of the head (e.g. yaw rotation for a standing person) usually
gives very small angular changes in relation to the vertical line. Exactly the same
rotation of the head when tilted from the vertical line can, however, produce
considerable changes in the direction of gravity and therefore a variation in the
otolith signal. The CNS is adapted to a strong connection between information
from the vertical semicircular canals and the otoliths. Rotation in other directions
requires an adaptation to a more varied co-operation from the horizontal
semicircular canals than usual. This may explain the differences in observed
incidence of motion sickness for stimulation of the vertical and horizontal
semicircular canals (Guedry et al 1990, Guedry 1991a).
Interaction between information from the semicircular canals and the otoliths may
in most cases be functional, but certain cases, such as cross-coupled angular
motions, may cause sensory conflicts or incorrectly coupled information. If a
person is placed in a centrifuge and is slowly accelerated to 15 turns/minute, he
will sense a normal pitch or roll movement of the head during the acceleration
phase. The information from the semicircular canals is then in accordance with the
otolith signals. However, when the constant angular speed is reached, information
concerning the constant rotation will slowly disappear over a period of 60 s. A
head pitch then results in a mismatch between the information from the
semicircular canals and the otoliths. The semicircular canals signal a roll motion
with the head and the otoliths signal a pitch motion. The result is that the subject
feels confused and disturbed. The corresponding phenomenon occurs for a roll
movement of the head. The otoliths signal a roll and the semicircular canals signal
a pitch movement. This is called cross-coupled coriolis stimulation and usually
gives a strong and rapid reaction of motion sickness very fast (Guedry 1991a).
The interaction between signals from the two different kinds of receptors of the
vestibular organs has an everyday functional value. The function and contribution
of this interaction to the origin of motion sickness is an important area of research.
This applies above all to those who advocate the sensory conflict hypothesis
(Guedry 1991a).
3.4 The optimal estimator model for spatial orientation
In two papers, Borah et al (1989, 1979) have presented an optimal estimator
model for human spatial orientation. The model takes into account vision,
vestibular and proprioceptive information and assumes that the processing of the
spatial information of the CNS can be modelled as an optimal Kalman filter. As
Borah et al describe the spatial system and orientation in terms of control theory
and a state system, a brief introduction is perhaps appropriate.
A description of a state system and an observer model
An optimal estimator model is based on the assumption that all the necessary
information in a system can be described with a state space vector x. The system is
linear and can be described by a set of first-order differential equations. Then
17
KTH TRITA-FKT report 1996:39
VTI Meddelande 802A
x= Ax, where x is an n-dimensional column vector, which represents the state of the system, xis the first derivative of x. A has the dimension (n x n).
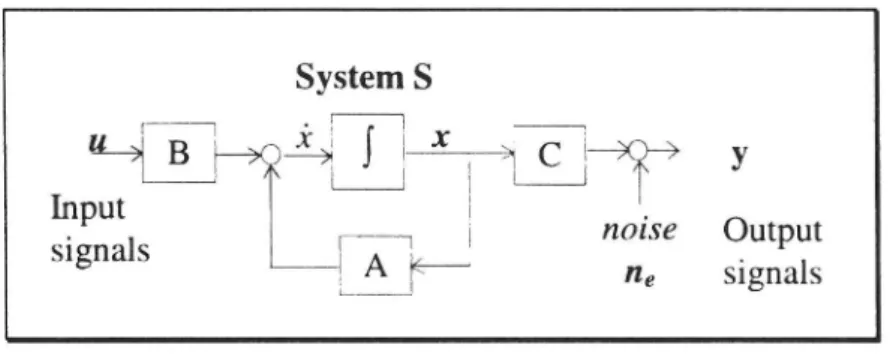
The system S together with an input u which acts on the system through a matrix B, an output signal y from the system through a matrix C and a (random) noise signal n, (adding to the output) can be described as in Figure 9:
System S
e 0 Tre
u-; B C 1-4-- g go> 9
e o |_ L_
imput f noise Output
signals
4' A
l
pO
|
--
Me
signals
Figure 9
Definition of a system S with an input signal u, noise added to the
output n, and an output signal y. After Oman (1982).
This system can also be described by the following equations:
x = Ax + Bu
y = Cx +n,
If the state of the system is inaccessible, it can be reconstructed by a state
estimator K. The estimated state of x is called x . This leads to:
&= Ai + Bu
The error of the system (y -y) can be judged by the difference:
y- Cx , (since if x= x, then y= Cx)
...
: SystemSnotseen
«u -B
F9? *> | k *a C J> b
Input
' ~~~ |:
I
|
signal
0
;
|| Output
|
|
bo
;
\_ signal
reed-back "|___ A"__ [
|
loop
poll
f
A {_j K(y-Cx) ~ ObserverFigure 10 A principle schematic of an observer K, which estimates the state of the system. After Oman (1982).
One way of controlling the error is to feedback the system with the error signal. Then
KTH TRITA-FKT report 1996:39 18 VTI Meddelande 802A
Description of the vestibular system
&= Ai + Bu+ K(y-C%)
where K is a matrix. This is called an observer. The optimal observer or estimator of a system is the Kalman filter, which minimises the error due to noise in the system. For the solution of the Kalman filter and further information on control theory, see textbooks such as Glad and Ljung (1989), Ljung and Glad (1995) and Leigh (1992).
The Borah model
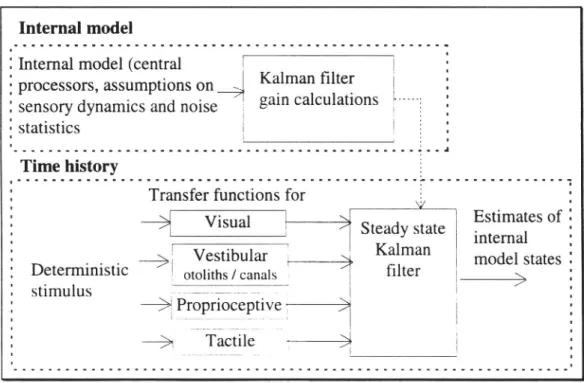
The model of Borah et al (1979, 1989) takes four types of spatial information into account:
1. Vestibular (semicircular canals and otoliths) 2 Visual
3. Proprioceptive (modelled as vertical acceleration from the seat)
4 Proprioceptive (modelled as information from the head-neck muscles for movements of the head in relation to the body), here called tactile.
The CNS is then modelled as a Kalman filter with assumptions on dynamics and transfer functions of the sensors and also on noise statistics, see Figure 11.
Internal model
; Internal model (central
§
processors, assumptions on
. sensory dynamics and noise
_
' statistics
g
l
|
Kalman filter
|
gain calculations }:
Transfer functions for
Visual
H Steady state | Estimates of
,
,
Kal
internal
kok lk
Vestibular _;
|
alman
model states .
Deterministic
\ otoliths / canals -
~
filter
~
h
stimulus
-> Proprioceptive --->
->
- Tactile
---3
Figure 11
Multi-sensory model using a steady state Kalman filter to represent
neural central processing. After Borah et al (1989).
Two outputs of the model are shown in Figures 12 and 13. Figure 12 shows
several model responses to a combined visual field and moving platform yaw
rotation step. When no visual information is present (rotation in the dark), the
model angular velocity estimate shows a decay in perceived angular velocity. This
decay in angular velocity lags behind the semicircular canal response, which is in
accordance with the velocity storage hypothesis. When rotation is in the light and
with a stable visual field (RL) the perceived velocity is fairly accurate. When the
visual surround is fixed to the platform, so that the visual background gives no
indication of rotation, the response (RFF) is similar to rotation in the dark (RD).
When the visual surround alone is rotated without the subject being rotated, a
19
KTH TRITA-FKT report 1996:39
VTI Meddelande 802A
sensation of rotation is induced called circularvection (CV) for about 10 seconds. Normally a decay is observed in humans for this circularvection. Except for onset of decay for the CV, the responses are quite similar to those observed experimentally (Borah et al 1989).
. 30 KAL MAN FILTER MOOEL
RESPONSES TO Yaw VELOCITY "*STEP®
\ _ RL -S TIMULUV S £2
SsSUuB@uECTIVvVE ANGULAR vELOCITY OURING :
(RL) ROT iNLIGA T
(CV} CIRCULAR vECTION
-oNLy visFiELOMOVES
RO (RO)
_
ROT INOARK
(RFFY) ROT wits FIXEO FiELO
CANALAFFERENT RESPONSE A N G U L A R V E L O C I T Y ( { R e a / S e c )
Ao &A A. As the hrc & ca A L L L A a a _<
P e e 0 is
we
g
___
#8
___
TIME (Sec)
ae
-.08
TFigure 12 Model response to rotation of the subject and the visual
background. The model predictions show a build-up of
circular-vection (CV), decay of velocity sensation in the dark (RD) or with a
subject-fixed stationary field (RFF) and maintained motion
perception for rotation in the light with an earth-fixed field (RL). After Borah et al (1989).
Figure 13 shows both the model response and an experimentally determined
subject response (Graybiel 1966) to a prolonged lateral acceleration. A prolonged lateral acceleration is perceived as a tilt. Graybiel's data is taken from centrifuge
runs where the subjects are requested to hold a line parallel to the horizontal
plane. The subjects are seated, so that the centrifugal forces are received as a
lateral force.
Conclusion according to Borah et al (1989)
The model represents a naive human subject such as a passenger in an aircraft
-who has no advance knowledge of the stimulus to be received or of the
characteristics of the vehicle. This model provides a reasonable understanding of spatial orientation and has the following properties:
1. Fairly accurate perception of forward acceleration in the presence of
confirming visual clues.
KTH TRITA-FKT report 1996:39 20
Description of the vestibular system
2. Fairly accurate perception of roll and pitch orientation changes as long as
clues are consistent.
3. Gradual acceptance of visual field linear velocity (linearvection) when there is no platform motion.
4. Static tilt illusion accompanying circular vection about an earth-horizontal ax1s.
24
o -o °
'°---o..-20 _ o ~~ ~O> ~ -O. «_ -Q. .- -O--O-- -o p" m & 2 16 & 3 39
o Q -«-«--- -o Data from Graybie! 3
- 12 Kalman filter model
o u a Lu C 8 114 / a. e 4 |-O l L l 1. l k. 1 . I | l J.. l 1 l 1. A. o 20 40 60 80 100 120 140 160 18o TIME (Sec)
Figure 13 Tilt illusion after onset of 0.34 g (3.3 m/s) lateral acceleration.
The Graybiel (1966) data is taken from the centrifuge experiment
in which subjects were required to maintain a target line in what
they felt to be a horizontal position. After Borah et al (1989).
21 KTH TRITA-FKT report 1996:39
4 Hypotheses concerning causes of motion sickness
Today, there are at least three different hypotheses of the origin of motion sickness, i.e. the hypothesis of overstimulation of the vestibular organs, the sensory conflict hypothesis and the evolutionary hypothesis stating that motion sickness is a toxic reaction provoked by motion. They are briefly described below.
4.1 Overstimulation of the vestibular organs
The overstimulation hypothesis states that motion sickness is an overstimulation of the vestibular organs, primarily the otolith organs. This would then result in a leakage of signals from the vestibular to the vomiting centre in the brainstem and thus provoke motion sickness (de Wit 1956, Jongkees 1967).
Some experimental results concerning vertical motions may support this hypothesis. Greater amplitudes or longer periods give a stronger reaction. One example is the motion dose measure by Griffin (1990). Also tests with rotating people in different directions lead to the conclusion that motion sickness is influenced by the amount of stimulation to the different semicircular canals and otolith organs (Guedry et al 1990)4.
On the other hand, this hypothesis cannot explain the adaptation to a provocative motion environment and the tendency for motion sickness to return when the provocative motions have ceased, as well as the fact that two mild stimuli such as two simultaneous rotations (cross-coupled coriolis) are so provocative. Another example is when sound and visual environment make the body believe it is moving, although the vestibular organs cannot detect any motion (cinerama effect).
4.2 The sensory conflict hypothesis
Reason (1970, 1974) formulated the first modern hypothesis, the so-called sensory conflict hypothesis, which declares that in all situations where motion sickness is provoked, there is a sensory conflict, not only between the signals from the eyes, the vestibular organs and other receptors susceptible to motion but also that these signals are in conflict with what is expected to be received by the CNS (Benson 1988). Oman (1982, 1988) tried to formulate this hypothesis in mathematical terms, see Chapter 4.3.
Today, the neural mismatch hypothesis or the sensory conflict hypothesis is the most established explanation for motion sickness. The sensory conflict hypothesis was first formulated by Irwin (1881) and later by Claremont (1931). In its modern form, it was formulated by Reason (1970, 1974, 1978), Reason and Brand (1975), and Benson (1988) under the names of sensory conflict, sensory rearrangement and neural mismatch models. The version by Reason from 1978 says:
4 Note: These authors Griffin (1990) and Guedry et al (1990) do not support the hypothesis of overstimulation. We do not suggest a "vertical-canal-sickness" interpretation... Our vertical canal stimuli introduced conflict (Guedry et al 1990).
23 KTH TRITA-FKT report 1996:39 VTI Meddelande 802A
"The first premuse is that all situations which provoke motion sickness are characterised by a condition of sensory rearrangement in which the motion signals transmitted by the eyes, the vestibular system and non-vestibular proprioceptors are at variance one with another, and hence with what is expected on the basis of previous transactions with the spatial environment".
"The second premise of this theory is that irrespective of what other spatial senses are part of these conflicts, the vestibular system must be implicated, either directly or indirectly (as in visually-induced sickness), for motion sickness reactions to ensue" (Reason 1978, page 820).
A diagrammatic representation of the sensory conflict hypothesis is in Figure 14.
Stimuli I Receptors Central nervous system Responses
| | | | [o --- | | | Motor
;
|
Volitional
|
control
|
and reflex
l system I | movement
| | CJC Updates |
Active | [ Internal model internal model! |
movement|j Eyes | neural store of (adaptation) |
expected signals |
Motion Semicircular
stimuli canals Leak [
Nezral centres I
Motion
sick-,j LeaRy _ 7
mediating
ness syndrome
| Otoliths
integration
signs &
|
Mismatch
|
symptoms
.
Passive
Sig/Sher
signal
i
of motion
| (Pallor, sweating.
|
|
Threshold
sickness
| nausea, vomiting,
movement
receptors i drowsiness,I
|
| apathy etc.)
Figure 14
Diagrammatic representation of the model of motion control,
motion detection and motion sickness according to the sensory
conflict hypothesis. From Benson (1988).
The central idea of this explanation model is that there is a comparator, which
compares registered motions and accelerations with those that the body expects to
feel. If these signals are not in accordance, the comparator sends out a so-called
mismatch signal. Normally, we use this mismatch signal in order to rapidly correct
our motion or position. However, if this mismatch signal is strong and continuous
(e.g. we are on a boat moving up and down by the waves, while the body still
expects to be on the ground) two things will happen:
1.
The mismatch signal will change the internal model for expected signals (as
we adapt to the floating boat).
2.
The mismatch signal will provoke a number of neural and hormonal answers
which together form the motion sickness syndrome (we suffer from motion
sickness) (Benson 1988).
KTH TRITA-FKT report 1996:39
Hypotheses concering causes of motion sickness
As the body changes (adapts) to the new internal picture of a specific motion pattern, it will be subject to yet another motion sickness disorder when the provocative motion ceases, see Figure 15.
Charateristic of sensory input ---and signal 'expected' by neural store - -
--Magnitude of k
'mismatch' signal |
from the comparator
Typical
A
Atypical
|
Typical
|
1
.
Motion
(familiar) motion
motion
motion
Figure 15
Example of adaptation of a severe change in the motion pattern of
the body. The atypical motion can be a sea voyage. From Benson
(1988).
The magnitude of the mismatch signal and the time with which a person adapts to
a new motion pattern are independent and individual. Consequently, certain
persons suffer easily from motion sickness while others are more resistant. The
adaptation time for the abnormal motion is independent of susceptibility to motion
sickness. Also the return back to normal situations is provocative (mal
débarquement). Normally, adaptation to the normal motion environment is faster
than adaptation to the abnormal motion.
Signals from vision, vestibular organs (semicircular canals and otoliths) or the
proprioceptive system may support the same or different information on the
movement of the body or body posture. If they are in accordance and agree with
the motions expected by the body and the motion patterns already stored, there is
no sensory conflict and we do not suffer from motion sickness. If the information
from the different sensory channels does not agree, there is a potential risk of
motion sickness. The sensory conflicts can be classified depending on the
conflicting organs or information (Benson 1988, Guedry 1991a), see Table 3.
25
KTH TRITA-FKT report 1996:39
VTI Meddelande 802A
Table 3 Classification of sensory conflicts. Adapted from Benson (1988) and Guedry (1991a).
Type Visual (A) / Vestibular Angular acceleration Vestibular (A) / (B) mismatch (semicircular canals) (A) / Proprioceptor
linear oscillation (otoliths) (B) mismatch (B) mismatch
Type 1
(A) and (B) Reading hand-held map Cross-coupled (Coriolis) Phase difference simultaneously or text in turbulent flight stimulation. Head during low contradictory movement during rotation frequency vertical information Inspection through about another axis oscillation
binoculars of ground or
aerial targets from Head movement in After-effect of moving aircraft abnormal force sustained
environment (hypo- or ambulatory turn hyper-gravity or fluctuating
linear oscillations) Type 2a
(A) signal Simulator sickness Space sickness (head Sudden stop test without (fixed seat against visual movement in weightless
expected (B) background) environment) Turning point
signal zone during low
Pressure (alternobaric) frequency high
vertigo peak velocity
angular oscillation Type 2b
(B) signal Looking around inside Low-frequency (<0.5 Hz) without aircraft when exposed to linear oscillation
expected (A) motion
signal Rotation about non-vertical
ax 1s
The conditions that involve only motion, is then the otolith and semicircular canals disagree regarding the motion involved. These stimulations are head motions during rotation about another axis, low frequency (below 0.5 Hz) linear and rotation about a non-vertical axis. All others involve contradictory information from either vision or the proprioceptive system.
KTH TRITA-FKT report 1996:39 26 VTI Meddelande 802A
Hypotheses concering causes of motion sickness
4.3 The Oman control theory approach
An heuristic mathematical model for the dynamics of the sensory conflict and evaluation of motion sickness has been presented in two papers by Oman (1982, 1988). The model is partly based on the optimal estimator model from Borah et al (1979, 1989). Oman makes an analogue to an observer control of vehicle orientation, see Figure 16. The vehicle has to be controlled despite noisy orientation sensors and exogenous forces. A state feedback, with an observer for estimating states which are not measured, is
Disturbing Aciuat Measurement
Forces Orientation Noise
+ Vehicle % &] Orientation
+ | Dynamics Sensors 1
Actual Feedback Meagurements knowledge of control lorces
Estimated +
Orientation
-\ Dynamic Model of y *
4 Thay l Vehicle __
60anCe d*h ° Error inagurerme ® * Control error'
Prediction-Commanded Dynamic Models of
Orientation Sensors Expected Messurements "OBSERVER"
Figure 16 Engineering use of an observer to control vehicle orientation. Solid arrows represent multi-dimensional vector quantities. From Oman (1988).
probably required for controlling the vehicle.
Figure 17 shows a mathematical model for sensory conflict and movement control based on observer theory. The structure resembles and parallels the structure in Figure 16.
The CNS must infer the body's orientation and control the body's movement using a limited set of noisy sensory signals. Incoming sensory inputs are compared with estimated signals and the difference is used for maintaining a correct spatial orientation estimate as shown in Figure 16. The estimated orientation is used for controlling the body and its movements and is detected through the sensory organs and compared once again. The internal CNS dynamic models are the differential equations describing the
Exogenous Riclogicat
Forces
Actual Sensory
4 B Orientation Orientation i Afterence + | Dynamics SO.rgl"£02
& Mechanisms for # Re-identification of CNS Motor Outfiow internal Models
Knovredage of Motor Qutfiow y t
Estimated internal CNS 4 Control drietteto" Dynamic Model of |, ) Strategy AC the Body Sensory
-Conflict Volltional internal CNS
Orientation mic Models of
Commend nsory Organs