PAPER MACHINE ENERGY
FINGER-PRINT
Carl-Fredrik Lindberg
1, Kevin Starr
2,
Robert Horton
2, Naveen Bhuthani
31)
ABB AB, Corporate Research, SE-721 78 Väste-rås, SWEDEN
2)
ABB Process Automation Services, USA 3)
ABB Corporate Research Center, INDIA
ABSTRACT
There is a large value in making the Pulp & Paper mills more energy efficient. ABB has developed an energy assessment service where opportunities to save energy in the paper machine are identified.
The assessment is done by both quantifying energy flows and benchmarking energy users in the paper machine. After the assessment is done an action plan is presented to the mill of what could be done to improve energy efficiency together with a return on investment.
INTRODUCTION
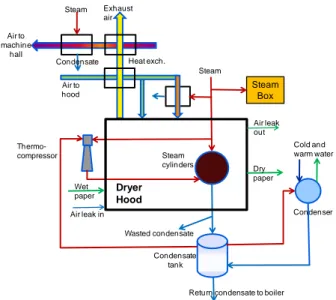
Paper machines consume large amounts of energy and in most cases also large savings can be done. An approximate overview of the energy flows in steam, condensate, air, water and paper in the dryer section of a paper machine is presented in Figure 1. The paper is dried when it is heated on the steam cylinders. The moisture in the paper is ventilated away and heat is recovered by heat exchangers and transferred to the inlet air, which partly is heated further by a steam-air heat exchanger. The air to the machine hall is also heated. Steam is heating the steam cylinders and some flash steam is recovered by thermo-compressors, remaining flash steam goes to the condenser which is water cooled. A steam box may be used to make the pressing more efficient. Condenser Condensate tank Steam cylinders Thermo-compressor Steam Box Wet paper Air leak in
Return condensate to boiler Wasted condensate Cold and warm water Steam Dry paper Air leak out Steam Condensate Air to machine hall Exhaust air Air to hood Dryer Hood Heat exch.
Figure 1 Overview of energy flows in dryer section of paper machine.
The challenge is to find where energy is wasted and savings can be found.
Measuring and improving energy performance is of course not a new idea, in [6] and [4] different ways are presented. Several other authors e.g. [1], [2], [3], [5] and [7] have found that the pocket air ventilation, hood balance and dew point have significantly influence of paper machine efficiency.
Below follows some general examples that influences energy efficiency.
Type of equipment (design efficiency and condition)
Lack of equipment (e.g. no heat exchanger, no steam box)
Plant design (e.g use/waste of flash steam and condensate, heat recovery system)
Control strategy (inefficient strategy causes waste of energy, e.g no dew point control.)
Operation (Manual control, choice of set-points)
Maintenance (of e.g. heat exchangers, steam traps, valves, sensors, insulation, leaks, tuning control loops, etc.)
Sensors (calibration, lack of sensors for monitoring and/or control)
Etc.
To save energy it is important to first identify the saving potential for different actions and its investment cost, and then prioritize.
It is also useful to quantify the energy flows inside the paper machine, both to find the largest flows, where probably the largest savings can be found and to make the mill more aware of their energy consumption in general.
ABB have recently developed a paper machine steam energy fingerprint (audit) where we
Quantify energy flows
Benchmark steam energy efficiency of drying section of paper machine
Suggest to the mill how to improve energy efficiency together with a pay-back calculation. If the mill implements the suggestions, energy will not only be saved, often machine speed & paper quality are improved.
METHODS AND MATERIALS
The presented method is based on measurements and experiments to derive performance indices & calculate energy flows. If measurements are missing, temporary measurements or estimations based on other signals may be used, or in worst case only specifications on current equipment are compared with state of the art
equipment and then performance and saving potential can be estimated.
Energy Benchmarking
Various benchmarks are calculated to determine the energy efficiency of the mill. Below follows some examples:
Ton steam / ton dry paper
Steam energy [J] / evaporated kg water
Electricity kWh / ton paper
Condensate return ratio to power house
Dew point in hood (exhaust air)
Sheet consistency after press section
Availability, uptime / total time
Performance, actual speed / max for that grade
Quality, good tons / total
Overall equipment effectiveness (OEE) These and other performance indices are compared to other paper machines producing same type of paper. When a benchmark is poor we have found an opportunity for energy saving. However, work still remains to identify the cause for inefficiency and actions for improvements.
Energy Quantification
The energy flows inside the paper machine are valuable to know since they help to find the largest waste flows and increase the understanding of the process.
Energy flows are more difficult to measure than liquid and gas flows since more measurements are required. Below are the equations presented on how energy is calculated for steam, condensate and moist air flows.
Steam enthalpy (energy)
The steam enthalpy is determined by: Sensible heat + Latent heat of vaporization + Superheat
)
(
T
T
mc
mq
T
mc
p
ps x
in [kJ/h]where m is mass flow rate of steam [kg/h], T is boiling temperature at given pressure [°C], cp(T,p) is specific
heat capacity [kJ/kg °C] of condensate that is a weak function of temperature T and pressure p, cps(T) is
specific heat capacity [kJ/kg °C] of superheated steam,
q(p) is latent heat of vaporization [kJ/kg], and Tx is
superheated steam temperature.
To measure steam energy flow it is required to measure: steam mass flow, temperature and pressure. If the steam is assumed to be saturated i.e. not superheated a relation between temperature and pressure can be used to calculate one signal based on the other.
Condensate enthalpy (energy)
T
mc
p in [kJ/h]where m in this case is mass flow rate of the condensate [kg/h], cp(T,p) is specific heat capacity of condensate
[kJ/kg °C], and T is condensate temperature [°C]. Moist air enthalpy (energy)
x
H
T
x
c
c
m
(
a
v)
v in [kJ/h]where m is mass flow rate of dry air [kg dry air /h], ca is
specific heat of dry air [kJ/kg of dry air/ °C], cv is
specific heat of moisture [kJ/kg of moisture/ °C], x is kg of moisture / kg of dry air, and Hv(T,p) is heat of
vaporization of moisture [kJ/kg of moisture].
The parameters cp, ca, and cv will be assumed to be
constant since they will not change so much in the normal operating range.
Measurement in a paper machine
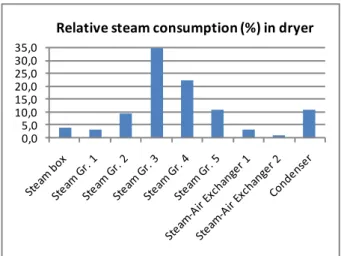
By using previous equations together with measurements, the bar-graph in Figure 2 has been obtained, which shows the relative energy consumption in the dryer section.
0,0 5,0 10,0 15,0 20,0 25,0 30,0 35,0
Relative steam consumption (%) in dryer
Figure 2 Relative steam consumption in the dryer section of a real paper machine.
In this paper machine more than 10% of the total steam energy goes to the condenser, which indicates that it may be possible to improve energy efficiency.
Less than 5% of the steam is used in the steam air heat exchangers, which means that the saving potential by using an optimal dew point in the hood may be smaller than expected. This study has, however, been done in the summer, in the winter the steam consumption and saving potential is larger.
A difficulty in paper mills is that very few of the required measurements for calculating energy are available particularly steam flow sensors are rare. The steam flows to the groups have been estimated by measuring the rise time in the condensate tanks when switching off the effluent flow from the tanks. The steam consumption in steam-air heat exchangers have in this case been estimated based on air flow, humidity and temperature measurements.
Energy saving calculation
There are different ways to determine the potential energy saving depending on how the energy is lost, but in general it may be determined by
experiments
studying specifications
simple modelling
Potential improvements by correcting poor operation and control strategy may be tested by experiments where set-points / actuator positions are changed and energy / steam consumption is logged.
If an old equipment should be replaced or a new previously missing equipment should installed, the energy saving can be calculated based on specifications and typical operating points at the mill.
Simple modelling may be used to determine energy savings due to poor maintenance (e.g. fouling in heat exchangers) or design (e.g. low condensate return rate). The size of heat losses due to leaks and poor insulation may be calculated by simple models if an estimate of the loss flow is available.
Pay-back calculation
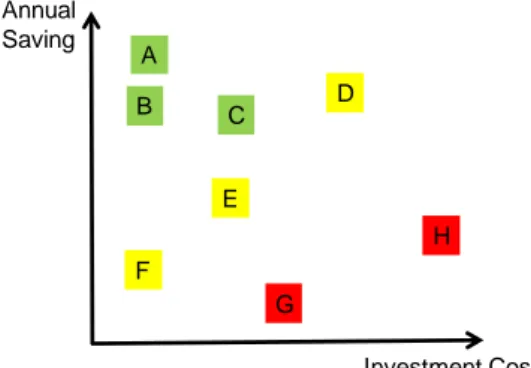
When suggestions for improvements are available and the energy saving are determined a pay-back calculation can be done when the investment price for improvement also is available. To easier prioritize between different energy saving proposals a graph similar to the one in Figure 3 can be made, where it is easier to select between different investments.
Annual Saving Investment Cost B A G H D C E F
Figure 3 Potential annual saving vs. investment cost.
RESULTS
This method of energy fingerprinting and finding potential energy savings is a new service from ABB. We are currently evaluating the method on a paper machine. Below follows some results from the evaluation.
Evaluation of historical data
The histogram in Figure 4 presents the steam consumption / ton produced dry paper for some different basis weights. The steam consumption varies
between 1.8 to 2.4 kg steam / kg dry paper. This indicates that it is possible to produce paper with less steam. If for example 50 % of the production would use 0.1 ton steam / ton paper less, then the steam bill would be reduced by 2.5%. 1.8 1.9 2 2.1 2.2 2.3 0 5 10 15 20 25 30 35 40 45 50
Histogram for ton steam / ton dry paper for different grades during 19 days
ton steam / ton dry paper
%
Lightest Light Heavy Heaviest
Figure 4 Histogram for ton steam consumption / ton dry paper over 19 days for different basis weights.
The basis weight has apparently large impact on the steam efficiency in this paper machine, heavy basis weights consume less steam / kg paper than lighter. By studying differences in operation it may be possible to identify more energy efficient operation of this paper machine.
The main parameter found that influence steam consumption is velocity, the higher velocity the less steam / ton paper is in general required, see Figure 5. For the lightest basis weights, this relation is however weak, maybe due to different refining power, condensate rimming in steam cylinders or something else. Start-ups after stops and grade changes also influence energy efficiency, but these are of course harder to reduce. 450 500 550 600 650 1.8 2 2.2 2.4 Heaviest to n s te a m / t o n d ry p a p e r Velocity [m/min] 450 500 550 600 650 1.8 2 2.2 2.4 Heavy to n s te a m / t o n d ry p a p e r Velocity [m/min] 450 500 550 600 650 1.8 2 2.2 2.4 Light to n s te a m / t o n d ry p a p e r Velocity [m/min] 450 500 550 600 650 1.8 2 2.2 2.4 Lightest to n s te a m / t o n d ry p a p e r Velocity [m/min]
Figure 5 Ton steam consumption / ton dry paper vs. velocity for different basis weights. Higher velocity is in general more energy efficient.
Experiment with steam box
An experiment with a steam box has been done and the result is presented in Figure 6 and Figure 7. First the
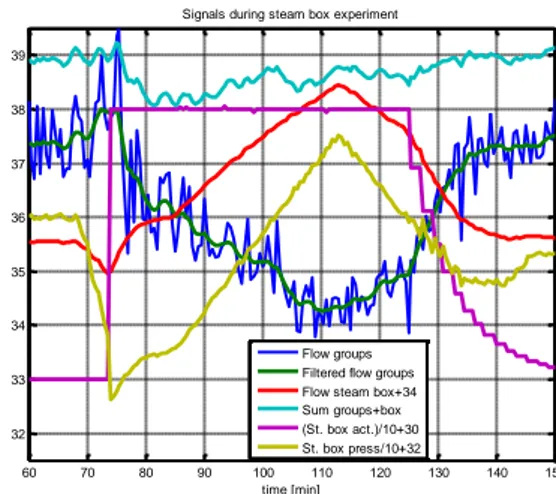
pressure was changed to a low value (yellow line, note scaled signal presented), then all actuators were set to 80% open (purple line, scaled signal) and the steam pressure was ramped up slowly and then down (the ramp down was not complete, we switched back to normal control in advance). The total steam consumption in the paper machine (cyan line) was as most reduced with about one ton / hour (corresponding to 2.5%) at time t = 80 min during the experiment, compared to the consumption before the experiment at normal operation. The steam flow to the steam box is given by the red line (scaled) and the flow to the steam groups is given by the blue line, the green line is low-pass filtered steam flow without phase shift.
60 70 80 90 100 110 120 130 140 150 32 33 34 35 36 37 38 39
Signals during steam box experiment
time [min] Flow groups Filtered flow groups Flow steam box+34 Sum groups+box (St. box act.)/10+30 St. box press/10+32
Figure 6 Experiment with steam box, note lower total steam consumption (cyan) is possible at t=80.
In Figure 7 the steam pressures in the steam groups are presented, note how the pressures are reduced when the flow to the steam box is increased. The reel velocity is constant during the experiment. The basis weight and moisture during are also shown in Figure 7, notice that the total lower steam consumption at t=80 min is not a result due to a higher moisture. The change in basis weight approximately follows the change in moisture.
60 80 100 120 140 100
150 200 250
Steam pressures in groups [kPa]
Gr. 1 Gr. 3 Gr. 2 Gr. 4 Gr. 5 60 80 100 120 140 530 535 540 545 550
Reel velocity [m/min]
60 80 100 120 140 108 109 110 111 112 113 Basis weight [g/m2] time [min] 60 80 100 120 140 5.5 6 6.5 7 7.5 8 8.5 9 Moisture [%] time [min]
Figure 7 Experiment with steam box. Red thick lines are low-pass filtered blue lines without phase shift.
A steam box both reduces total steam consumption by increased dewatering and improves the moisture profile
up to a limit when increased steam box flow saturates and doesn’t improve dewatering anymore. As seen in Figure 6 there is a total minimum steam consumption at t=80, but the minimum steam consumption for the steam groups are at t=110 min, hence if the hood is limiting the production a steam box reduces that limitation.
The moisture profile (not shown) became as expected poor in this case with high moisture at the edges when all steam box actuators were set to a flat opening of 80%.
We have not yet tested if the steam consumption will be reduced when the CD moisture profile control is running, but it is likely to work since the optimal pressure set-point is decreased compared to the current one, and the risk of saturating an actuator is smaller than today. Hence a potential steam saving about 1 ton steam / hour is possible.
Results from infrared thermography
An investigation with thermal imaging of dryer cylinders, hood, steam traps, and other equipment has been done. The goal was to identify problems and heat leaks in the dryer section.
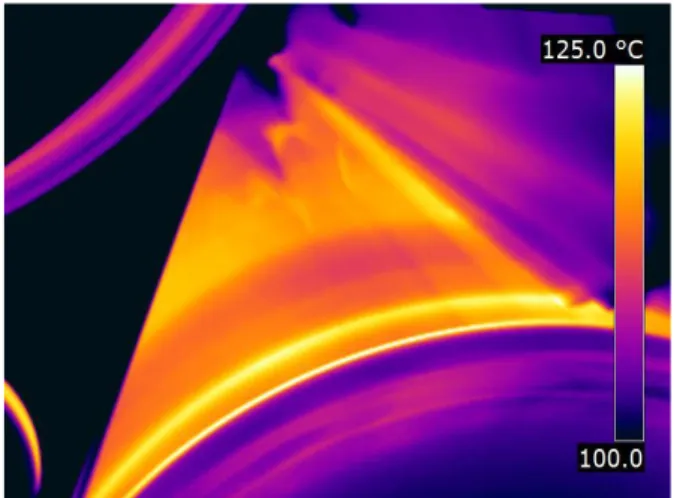
A typical thermogram of dryer cylinders in the end of the paper machine is presented in Figure 8, where the max and min temperatures along the cyan lines also are given in the image. A difficulty is that the dryer cylinders are very shiny and you rather get the temperature of the reflected object than the steam cylinder itself. Another difficulty is that depending on selected emissivity you get different temperatures. The emissivity is a tuning parameter between 0 and 1, which depends on type of material and if it is polished or oxidized.
Figure 8 Thermogram of dryer cylinders in end of the paper machine.
If we accept to not trust the absolute temperature values too much and use the same emissivity in all thermograms, then thermal imaging is a great tool to detect temperature differences between different cylinders, and temperature gradients along a cylinder. In our investigation we found only minor problems. For example one cylinder was cooler in the end, see Figure
9, and another cylinder was dirty which caused stripes in the thermogram of the cylinder.
Figure 9 A dryer cylinder with a cooler region in the end close to the observer.
Malfunctioning steam and condensate traps causes energy losses and problems in the process. Thermal imaging may detect these problems. In Figure 10 an example is presented of a condensate trap that is closed. The temperature is high on the steam side and colder on the other side. If it would have been open the temperature would have been the same in both ends and steam would have been visible at the exhaust. If it would have been flooded with condensate the temperature would have been lower. In our investigation all condensate traps were closed.
At this mill the steam was superheated quite much, 3 bar steam at 160 C. Transmission of wet steam can lead to water hammering by condensate and scale formation in pipes and heat transfer surfaces. On the other hand if the steam is superheated too much the process becomes inefficient since significantly more energy is released when steam converts to condensate compared to when super heated steam cools down.
Figure 10 Valve and condensate trap.
A thermogram and normal photo of a section of the hood is presented in Figure 11, where hot air is leaking above the door, which heats the hood on the outside (only hot air cannot be detected by thermal imaging). Sealing the leak would save energy and reduce the humidity in the machine hall. Another advantage is that the ventilation in the machine hall may be reduced since
less moisture in that air is needed to be removed. This would also save steam for the heating of the machine hall air.
Figure 11 Thermogram and normal photo of hood.
A Thermogram of a thermo-compressor was used to detect inefficiency in a thermo compressor, see Figure 12, where the temperature of the mixed steam pipe is only 2.4 degrees lower than on the motive steam pipe. This is an indication on that very little flash steam is recovered.
Figure 12 Thermogram of a thermo-compressor.
To check if the current thermo-compressor influenced total steam consumption or condenser load, it was switched off. No change was as expected observed on total steam consumption or condenser load. Energy could potentially be saved here by recovering more flash steam and reducing the flow to the condenser.
Experiments in hood heat recovery
A test has also been done where the air flow to and from the hood was reduced and resulting hood humidity and steam consumption was measured.
The inlet air damper opening was reduced from 40 % to 35% and exhaust dampers from 100 to 95%. The relative humidity in the exhaust air from the hood was measured (37%), but no change was observed neither in humidity nor steam consumption. A larger change is required to see a difference, but we didn't want to reduce the damper openings more at this experiment.
Other experiments that may be conducted
The following experiments would also have been interesting to run, but it has not been done yet.
A higher wire tension improves the heat transfer rate and may hence reduce the steam consumption according to the literature.
A reduced superheating of the steam makes the process more energy efficient.
A reduced difference pressure over the steam groups reduces total steam consumption.
CONCLUSIONS
Paper machines consume large amounts of energy and in most cases also large savings can be done. ABB have recently developed a paper machine steam energy fingerprint (audit), which evaluate the steam cycle in the paper machine. By quantifying steam supply and steam use, inefficiency can be measured. If the loss of energy is beyond specifications, then the poor energy users can be identified and target solutions can be applied. In this paper an investigation of the dryer section of a paper machine has been done and the following potential steam savings have been identified:
2.5% steam saving by increased reel velocity
2.5% steam saving by optimization of steam box pressure
2% steam saving by repairing and/or improving operation of thermo-compressors
x % steam saving by increasing hood dew point, increased wire tension, seal leaks from hood and ventilation system, etc.
Hence just by optimizing control set-points more than 5% steam may be saved. With limited investments steam savings around 10% would be possible to obtain.
REFERENCES
[1] Ghosh A. K., “A Systematic Approach to Optimise Dryer Performance and Energy Savings – Case Studies”, Proceedings of PaperCon '09, May 31 - June
3, St. Louis, USA, 2009.
[2] Ghosh A. K., “Optimization of Paper Machine dryer section”, Proceedings of 7th int. conf. on pulp, paper
and conversion industry, PAPEREX 2005, New Delhi,
2005.
[3] Kilponen L. “Improvement of Heat Recovery in Existing Paper Machines”, Lic-thesis, Department of Mechanical Engineering, Espoo, Helsinki University of Technology, 2002.
[4] Kuvalekar D. “Reducing Specific Steam Consumption through Automation in Steam Systems”,
Proceedings of Paperex 2007, New Delhi, India,
December 7-9, 2007.
[5] Lindell K., and Stenström S. “Assessment of Different Paper Drying Processes to Reduce the Total Energy Costs From a Mill Perspective”, Drying 2004 –
Proceedings of the 14th International Drying Symposium, São Paulo, Brazil, 22-25 August 2004, vol.
B, pp. 1233-1240. 2004.
[6] Reese D. “Measuring Paper Machine Energy Performance”, Proceedings of PaperCon '09, May 31 -
June 3, St. Louis, USA. 2009.
[7] Sivill L. and Ahtila P., “Energy efficiency improvement of dryer section heat recovery systems in paper machines – A case study”, Applied Thermal
Engineering Vol 29, pp 3663-3668, Issues 17-18,