EXPLORING THE CLINICAL METRICS TO ASSESS THE HEALTH
COST IMPACT OF TRAFFIC INJURIES
Sara Ferreira
Faculty of Engineering, University of Porto Rua Dr Roberto Frias s/n, Porto, Portugal Phone: + 351 225081968 E-mail: sara@fe.up.pt
Antonio Couto, Faculty of Engineering, University of Porto; Marco Amorim, Faculty of Engineering, University of Porto.
ABSTRACT
Besides fatalities, road traffic crashes also cause a large number of nonfatal injuries with a high impact on economic and human costs to society. In order to allow a deep knowledge of the nonfatal injuries, efforts have been made to improve injury severity classification. Recently, and in line with the OECD working group proposal, the European Commission adopted the maximum abbreviated injury scale (MAIS) classification. This injury severity classification is based on medical diagnosis, which is reported by the international classification of diseases (ICD). Therefore, the adoption of MAIS classification will open the door to a new source of information based on hospital data. Furthermore, the type of medical treatment is commonly described using the international classification named diagnosis-related group (DRG), which is a system codification usually used as a reimbursement mechanism as well as to perform comparisons across hospitals. Tools and methods to easily use this clinical metrics to traffic injury analysis are critical to advance safety knowledge. In this study, we seek to explore the most used clinical metrics that are ICD and DRG to describe the diagnosis and the medical treatment, respectively. The ICD is converted to abbreviated injury scale (AIS), which in time provides the MAIS, i.e., the severity of the injury but also the anatomical description such as the type of body region and anatomical structure. On the other hand, DRG is used to estimate the health care costs (HCC) applying a national standard methodology. Together with the length of hospital stay (LHS), statistical analyses are applied using generalized linear models (GLM) selected depending on the type of response variable, i.e. discrete or continuous. Due to an evident correlation between body region and MAIS, we firstly analyse the relationship between both variables. Also, the combination of body region and type of anatomical structure is set as other alternative variable. The ordinal logit model is applied, showing that for instance, head is the region of the body associated with high severity, particularly regarding loss of consciousness. Secondly, the relationship between HCC and MAIS, and HCC and body region were analysed separately by using a log link and gamma distribution GLM. The results clearly show that increasing severity, the HCC increase with an evident leap between score 2 to 3 and between score 4 to 5. The head is the body region associated to higher medical treatment costs. Because LHS is still widely used has a measure of injury severity, we apply the same model to the LHS as response variable. Despite the type of relationship was found to be more or less the same, differences were found between LHS model and HCC model. Finally, a discussion is presented with reference to the long term costs estimated by disability-adjusted life-year (DALY), identifying the future needs to a huge implementation of this metric to traffic injuries.
1.
INTRODUCTION
As cited by the World Health Organization (WHO) “Road traffic injuries cause considerable economic losses to victims, their families, and to nations as a whole”. Despite the inaccuracy of the global estimations, studies illustrate that road traffic crashes cost countries between 1% – 3% of their gross national product, according to the WHO (World Health Organization 2013). On the other hand, the health care costs incurred by the victims represent an important proportion of the true cost of traffic accidents.
Recently the European Commission, similar to the United States of America (USA) practice, has adopted the maximum abbreviated injury scale (MAIS) as the common severity scale to report the traffic injuries. MAIS is a medical scale that can be identified by trained staff of trauma services or derived from the commonly used codes of the international classification of diseases (ICD), which is the typically situation at least in Europe. Therefore, the future commonly use of this medical severity scale will open the door to a new source of information based on hospital data for traffic injury studies. . Tools and methods to easily use this new source of traffic injury data are critical to advance safety knowledge.
The most commonly medical codification used worldwide to describe injuries are ICD and diagnosis-related group (DRG). The ICD is used for coding all inpatient hospital data and therefore not exclusively used for coding injury/trauma. The ICD has been used at an international level since 1893 and is now under the responsibility of the WHO. Further revisions were undertaken and the most recent revision is the ICD10 (the 10th revision). According to IRTAD (International Traffic safety Data and Analysis Group 2012), in most countries, hospitals use the ICD (ICD9 or ICD10), which is derived from the medical diagnosis to describe the injuries. This classification of diagnosis for all health conditions includes diagnostic codes for both, nature of injury and external causes of injury. Note that ICD code does not incorporate an explicit severity dimension. The ICD is widely used to classify health conditions in the clinical, administrative, public health promotion and research settings. In order to analyse specifically injuries resulting from traffic crashes, the Association for the Advancement of Automotive Medicine (AAAM) introduce in 1971 the abbreviated injury scale (AIS). The AIS is a specialized trauma classification of injuries based mainly on anatomical descriptors of the tissue damage caused by the injury. The score describes three aspects of the injury using 7 numbers written as 12(34)(56).7: type, location and severity. Code number 1 describes body region; number 2 the type of anatomical structure; numbers 3 and 4 the specific anatomical structure; numbers 5 and 6 the level; number 7 the severity of score. The severity of an injury based on “threat to life” on a 6-point scale range from minor to untreatable injuries. The severity score ranges from 1 (relatively minor) to 6 (currently untreatable), and is assigned to each injury descriptor. Injuries should be coded to the AIS by trained staff of trauma services or by specialists in injury data collection. Assigning AIS scores based on medical records is time consuming; it is not routinely done outside of trauma centers. Therefore, tools were developed to easily convert ICD to AIS such as ICDMAP (MacKenzie EJ, et al. 1989).
The AIS forms the basis of some severity scores such as the MAIS and injury severity score (ISS). The MAIS is the maximum AIS severity score of a casualty with several injuries. As mentioned before, MAIS is an internationally accepted summary measure of injury severity, and was recently assumed as the common international definition in EU. In fact, studies such as (Carter, et al. 2014,
Ferreira, et al. 2015a, Forman, et al. 2012, Tarko and Azam 2011) already used this scale to analyze factors affecting injury severities.
Note that the length of hospital stay (LHS) is the most popular clinical metric that has been used for classified the severity of the injuries. For instance, in Portugal as in many European countries, if a victim stays in hospital for more than 24 hours, the casualty is classified has serious injury. A previous study was conducted by Ferreira et al. (2015a) to analyze the relationship between the LHS and MAIS. In this paper a comparison analysis was undertaken between Portugal study by Ferreira et al. (2015a) and USA study by Blincoe, et al. (2002). Thus, comparing both, great differences can be found on the relationship between MAIS level of severity and the number of days that the victims stay in hospital. For instance, according to Blincoe et al. (2002), the LHS for MAIS equal or greater to 3 is more than 8 days, and 17 days in the case of Ferreira et al. (2015a).
Moreover, and besides ICD, hospitals usually report the DRG code because since the 1990s, in most high-income countries, payments based on DRGs have gradually become the principal means of reimbursing hospitals for acute inpatient care (Mathauer and Wittenbecher 2013). As pointed out by Mathauer and Wittenbecher (2013), although DRG-based payment systems are now mainly understood as a reimbursement mechanism, their original purpose was to enable performance comparisons across hospitals. By definition, DRGs classify cases according to the following variables: principal and secondary diagnoses, patient age and sex, the presence of co-morbidities and complications and the procedures performed. Cases classified as belonging to a particular DRG are characterized by a homogenous resource consumption pattern and, at the same time, DRGs are clinically meaningful. Thus, cases within the same DRG are economically and medically similar. This standard and international system codification has been rarely used at least regarding road safety analysis. Therefore, in our opinion, DRG can be an important source of information to assess health care costs regarding traffic victims providing an accurate comparison, supporting a benchmarking analysis. Based on DRG translating costs and AIS information, it is possible to develop novel methodologies and studies.
2.
BACKGROUND
Casualty costs arise from, among others, lost output, medical and ambulance costs and human costs. Each of these items is difficult to estimate with accuracy considering the subjectivity and/or lack of data. Nevertheless, studies have been developed trying to overcome these issues. Most of them have been conducted in health context such as traumatology in which traffic victims are usually included. The sources of data and estimations costs have however been very distinct. Polinder et al (2005) compared health care costs in 10 European countries using admitted injury patients. Costs were estimated according to a model developing under EUROCOST project. In this model, the hospital cost of impatient is the sum of the number of emergency department visits multiplied by the costs per emergency department visit and the number of hospital admissions multiplied by length of hospital stay (LHS) and unit costs per inpatient day. Information about unit costs was gathered from the countries by a questionnaire. Results showed large international differences in injury incidence and associated costs. Nevertheless, the patterns of costs by age, gender, injury type and external cause were found quite similar between countries.
Chen et al. (2012) also used Australian Refined-DRG to estimate car crash-related hospitalization costs amongst young adults in New South Wales, Australia. The study aimed to examine factors associated with variation in crash-related hospitalization costs with particularly focus on types of vehicle occupant, rurality of residence and socioeconomic status.
Bambach and Mitchell (2015) developed an estimation technique of the human recovery costs of (non-fatal) seriously injured road accident casualties. To do so, the authors used a linked data between personal injury insurance claims with admitted patient data. Human recovery costs includes all of the costs to the person directly related to their recovery from their injuries including: ambulance, hospital treatment, rehabilitation, follow-up medical consultations/treatments, medications, psychological treatment, litigation, economic loss (i.e. loss of income), ongoing care and support services and general damages (i.e. pain and suffering, loss of amenities of life and loss of enjoyment of life). Inpatient hospital costs were estimated using the Australian Refined-DRG codes recorded in the admitted patient data.
Liu et al. (2009) developed an integrated methodology to obtain costs that links car occupant injury risk functions, estimated in laboratory, with real world medical treatment by using AIS. The authors claim that by using the developed model the expected medical treatment costs for crash injuries to various body regions and of different severities can be investigated. One of the goals was to supplement insufficient real crash data from police crash reports.
Costs have been also used an indicator to analyze the impact of specific factors on traffic injury severity. Shen and Neyens (2015) examined the relationships between drivers’ age, gender, and the accident types as well as other accident characteristics on the accident related health care costs. Older and male drivers, single vehicle collision were found to have higher health care costs. In general, not wearing seatbelt, airbag deployment and speeding were also found to be associated with higher health care costs. The study used the South Carolina Crash Outcome Data Evaluation System created by police reports with the medical and financial outcome data from hospitals.
Gomez-Restrepo et al. (2014) identified the alcohol consumption as a possible factor associated with the increased use of direct health care resources in Colombia. Data was collected by a survey conducted by trained nurse auxiliaries and the hospital provided bill information for cost analysis. Scholten et al. (2015) analyzed the incidence and costs of the bicycle-related traumatic brain injuries in the Netherlands. Direct costs (e.g. healthcare costs) and indirect costs (e.g. productivity loss) were calculated with use of the incidence-based Dutch Burden of Injury Model. Direct health care costs were calculated by multiplying incidence by healthcare volumes (e.g. LHS), transition probabilities (e.g. probability of hospital admission), and unit costs (e.g. costs per day in hospital). The authors observed that the traumatic brain injuries strongly increased despite the incidence of all bicycle-related injuries remained stable. This type of injury accounted for 18% of the total costs due to all bicycle-related injuries.
As can be concluded, despite there are several traffic victims’ studies using health care costs, there is not a current practice of using clinical metrics such as DRG to easily study traffic injuries’ incidences. Uncertainties are usually associated in the calculation of medical costs, resulting in different limitations and issues in the application of the methods to traffic accidents. Also, the AIS, which allows to get the new EU scale MAIS, has potential to be explore and related to health care costs. In this context, the present study explores the use of the clinical metrics ICD and DRG as well as the LHS, age and sex of the victims as reported by hospitals to assess the impact of traffic injuries. Using these metrics, health care costs are obtained and its relationships with MAIS, injury description (e.g. body region) and demographic characteristics are analysed by statistical models. The objective is to understand the potential of these metrics to infer about the consequences of the crash mainly through the costs and severity to develop robust costing models to easily and routinely estimate the impact of the injuries supported by DRG and ICD data. The clinical metrics have the main potential of allowing
benchmarking analysis since these clinical metrics are supported on international standard codifications.
3.
HOSPITAL DATA AND CLINICAL METRICS
3.1. Data and clinical metrics description
To develop the present study, traffic victim records were gathered from the three hospitals located at Porto region, Portugal, during the time period 2006-2012. Because ICD and DRG codes are only reported for inpatient, emergency department (ED) patients were excluded for this study. Note however, that it was possible to calculate the costs associated to traffic injuries for this period using the unit cost of 112.07 € for the Polyvalent Emergency Unit as officially published in Portugal. For instance, considering that 21,950 emergency episodes were reported in the ED during this period, emergency medical costs are estimated as 409,989.42 €. Since these victims were not admitted as patient or transfer to other hospital, we can classify them as slight injuries according to the police authority classification (< 24 hours). Readmissions and fatalities were excluded from the analysis. The former in order to avoid double counting of the same victim and the latter because of the large number of fatalities that occur at the crash scene or at the emergency department, and thus, not reported in the admission data set. At the end, the data used in this study includes 3,801 observations.
ICD, DRG, LHS, age, and gender were selected from the inpatients database. In our analysis, only injury principal diagnosis, which is associated to the more serious injury, was included because one of the hospitals had only reported this ICD diagnosis description. Nevertheless, only including injury principal diagnosis will result in a slight underestimation of the injury incidence of admitted patients as pointed out by Polinder et al. (2005), and as also proved by the analysis described in Couto et al. (2015) of the data of the one of the hospital which provided all injury diagnosis. In this latter, in around 90% of the records the principal diagnosis corresponds to the highest AIS severity code. A selection of external causes of the ICD 9th revision was used to select traffic injuries (E810 to E819).
Each one of the three hospitals haves different internal data systems, which led to different data treatments (Couto, et al. 2015).
Taking full advantage of the hospital data set, the DRG was used to estimate health care costs associated to the medical treatment of the accident victims. Note that DRG is commonly used as a standard practice for establishing reimbursements to social insurance programs or to state hospital financing in Portugal as in many world countries. In this study, the DRG of the principal diagnosis for each inpatient was collected. It should be stressed that the DRG is reported by a medical codification expert, describing the type of medical treatment according to the associated diagnosis, which in time is described by ICD. These two medical codes describe to different perspectives, i.e. diagnosis and type of medical treatment, and are reported independently.
3.2. Estimating AIS and healthcare costs
In order to obtain AIS information, the ICDMAP tool was used to convert ICD to AIS. For the purpose of this study the AIS code was used to describe three aspects of the injury beside the severity score: the body region, the type of anatomical structure and the specific anatomical structure. The specific anatomical structure is a specific description of the anatomic structure, which in turn is associated to the body region. Considering this clearly dependency between anatomical structure and body region, a new variable was set based on both information named BRAS. Also, considering the few cases reported for each type of specific anatomical structure, this was excluded from the analysis.
The health care costs were determined by assigning national costing based on DRG, which are reported in Portuguese legislation by the Decree number 20/2014 from 29 de January 2014. This cost estimation is based on the information of the type of medical treatment, i.e. DRG, and its associated costs (covering hospital stay costs). The medical treatment is associated to a standard cost limited to a LHS number of days. If an inpatient case shows to be different from the LHS standard or medical complication is reported, extra costs are inputted according to the same national table. Figure 1 describes the framework of the medical codification use in this study.
Figure 1: Description of the framework of the clinical metrics
3.3. Variables description
A statistical description of the variables included in the study was conducted as shown in Table 1. In this table, patients’ characteristics are shown based on their age and gender. Note that both variables were not included in the modeling process (see next section) because these variables are input information to DRG codification and thus health care costs. Nevertheless, it is clear the higher percentage of male patients (72%) compared with female patients. In fact, a previous study (Ferreira, et al. 2015a) found that male victim is a risk factor of being seriously injured. Also, the same study pointed out that elder victims have a higher probability of being seriously injured. Table 1 also shows that 18% are elder patients. An analysis of these elder patients distribution by MAIS score showed that 36% and 37% are classified as scores 2 and 3, respectively. Also Ferreira et al. (2015a) found that elder victims have a high probability of being seriously injured.
The two continuous variables, i.e. health care costs (HCC) and LHS, are described in the last lines of Table 1. The mean HCC per patient is 6,675.10 €. For the LHS variable two descriptions are shown, one includes the cases in which 0 days were reported, and the other excluding these cases. This latter was used to modeling the LHS as dependent variable as it will be shown in the next section. The mean of the number of the days that a patient stays in the hospital is around 14.5. Comparing this mean value with the other mean values of several countries as published in Polinder et al. (2005), we can
Diagnosis Phase Principal
diagnosis
ICD code AIS
Severity Score - MAIS
Body Region Anatomical structure
Specific Anatomical
structure
Medical Treatment Phase
Medical Treatment DRG code + LHS + complication
Healthcare Cost
conclude that this value is very high. For instance, Austria and Netherlands, which have the highest cost per patient values of the list illustrated in Polinder et al. (2005), show 3,342 € and 2,954 € per patient, respectively. Also, regarding LHS the same conclusion can be provided since for the same countries the mean values are 6.9 days and 8.4 days, respectively. Note that the data source of the mentioned study includes also ED sample, which corresponds to account for 0 days, in contrast to the current study.
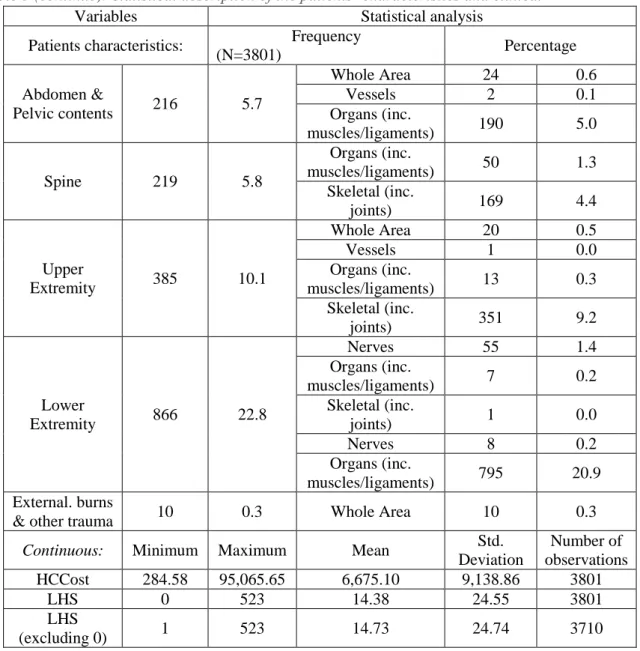
Table 2: Statistical description of the patients’ characteristics and clinical metrics
Variables Statistical analysis
Patients characteristics: Frequency
(N=3801) Percentage Gender Female 1061 27.9 Male 2740 72.1 Age 0 -17 616 16.2 18 - 34 1115 29.3 35- 64 1380 36.3 +65 690 18.2 Clinical metrics: Categorical: Frequency (N=3801) Percentage MAIS 1 Minor 358 9.4 2 Moderate 1449 38.1 3 Serious 1287 33.9 4 Severe 284 7.5 5 Critical 423 11.1
Body Region Frequency
(N=3801) Percentage Type of Anatomical Structure Frequency (N=3785) Percentage Neck 6 0.2 - - - Head 1392 36.6 Whole Area 1 0.3 Organs (inc. muscles/ligaments) 611 16.1 Skeletal (inc. joints) 294 7.7 Loss of Consciousness (head only) 474 12.5 Face 368 9.7 Whole Area 51 1.3 Organs (inc. muscles/ligaments) 19 0.5 Skeletal (inc. joints) 298 7.8 Thorax 339 8.9 Whole Area 6 0.2 Vessels 11 0.3 Organs (inc. muscles/ligaments) 183 4.8 Skeletal (inc. joints) 139 3.7
Table 3 (continue): Statistical description of the patients’ characteristics and clinical
Variables Statistical analysis
Patients characteristics: Frequency
(N=3801) Percentage Abdomen & Pelvic contents 216 5.7 Whole Area 24 0.6 Vessels 2 0.1 Organs (inc. muscles/ligaments) 190 5.0 Spine 219 5.8 Organs (inc. muscles/ligaments) 50 1.3 Skeletal (inc. joints) 169 4.4 Upper Extremity 385 10.1 Whole Area 20 0.5 Vessels 1 0.0 Organs (inc. muscles/ligaments) 13 0.3 Skeletal (inc. joints) 351 9.2 Lower Extremity 866 22.8 Nerves 55 1.4 Organs (inc. muscles/ligaments) 7 0.2 Skeletal (inc. joints) 1 0.0 Nerves 8 0.2 Organs (inc. muscles/ligaments) 795 20.9 External. burns
& other trauma 10 0.3 Whole Area 10 0.3
Continuous: Minimum Maximum Mean Std. Deviation Number of observations HCCost 284.58 95,065.65 6,675.10 9,138.86 3801 LHS 0 523 14.38 24.55 3801 LHS (excluding 0) 1 523 14.73 24.74 3710
Regarding MAIS, Table 1 shows that the higher percentage (38%) of the patients is set as MAIS equal to 2. Note that if we group the casualties according to the adopted severity classification by EC, we can conclude that 47.5% are classified has slight injuries (MAIS <3) and 52.5% are set as serious injuries (MAIS+3), i.e. 47.5% of the victims that were classified as serious injury according the police classification (LHS > 24 hours) despite they are classified as slight injury according to MAIS (this difference is named misclassification). However, even this later classification is controversial because it is not agreed upon which MAIS level should be used to define serious injury. The OECD working group on injury data, IRTAD, proposed to define serious injury according to MAIS+3, and the EC recently adopted the same strategy. In contrast, in the Dutch road safety policy a serious injury is defined according to MAIS+2 (Polinder, et al. 2015). If we apply this later to the present data, 91% of the patients are classified as serious injury, which is more close to the actual classification of the police authorities (LHS > 24 hours).
The body region and anatomical structure of the principal diagnosis were obtained by AIS for each patient. Table 1 shows that 36.6% of the injuries were located in the head in which 16.1% were related to organs and 12.5% were associated to loss of consciousness. Also, 22.8% of the injuries were located in the lower extremity in which 20.9% were related to skeletal. These both type of body regions are the most frequent reported observations. The specific anatomical analysis was not included due to the lack of space.
4.
EXPLORING CLINICAL METRICS
4.1. Statistical analysis
The methodology adopts to explore these clinical metrics and its relationships was the Generalized Linear Model (GLM) with a log link and gamma distribution for the continuous variables , i.e. cost per patient (HCC) and LHS, as suggested by Manning and Mullahy (2001). These response variables were modeling with MAIS scores and type of body region separately, model 1 and model 2, respectively. Despite body region information is obtained independently of the MAIS score, both may be highly correlated as advocated by some researchers and medical experts. The assumption is that the severity of the injury is related with the region of the body where the injury was inflicted. This assumption lead to other injury severity classification named injury severity score (ISS). The ISS can be obtained by the highest AIS severity code in each of the three most severely injured body regions are selected, being A, B and C; then ISS = A2 + B2 + C2. In order to explore the relevance of this alternative
assumption or equivalent, the relationship between MAIS and type of body region and/or anatomical structure was analyzed assuming the ordinal logistic model in which MAIS is the response categorical variable. All statistics were computed using IBM SPSS Statistics 21.
Therefore, firstly the impact of the type of body region injured on MAIS is inferred by the results of the ordinal logit model as shown in Table 2. As can be observed all estimated parameters, i.e. β, are statistical significant at 95% level of confidence. External, burns and other trauma as well as neck were excluded from the model because of the few reported observations. The head is the body region assumed as the reference category. Therefore, all other body regions show to have an effect on severity distinct from head. Because all estimated parameters are negative, we can conclude that head is the body region with a higher impact on injury severity classified by MAIS. In other words, if the injury is located at head, the probability of being more seriously is higher. Also, despite estimated parameters of thorax and lower extremity categories are negative, both values are lower than the others categories with negative values for the estimated parameters and thus, more close to the effect of head on severity.
Additionally, we can point out that each type of body region has a different impact on each MAIS score as may be concluded by the statistical significance of all estimated parameters for the thresholds. In sum, the type of body region is highly related to the injury severity as classified by MAIS and with different impacts on the severity levels. In other words, the region of the body where the injury was inflicted shows to have impact on the level of severity.
Table 2: Results of the MAIS ordinal logistic model
Parameter β Std. Error Sig. Exp(β)
Head 0a) - - - Face -5.800 0.1532 0.000 0.03 Thorax -1.856 0.1211 0.000 0.156 Abdomen & Pelvic contents -3.103 0.1775 0.000 0.045 Spine -3.166 0.1572 0.000 0.042 Upper Extremity -4.144 0.1391 0.000 0.016 Lower Extremity -2.849 0.1000 0.000 0.058
Threshold B Std. Error Sig.
[MAIS=1] -5.729 0.1185 0.000 -
[MAIS=2] -2.325 0.0778 0.000 -
[MAIS=3] 0.233 0.0529 0.000 -
[MAIS=4] 0.978 0.0587 0.000 -
Deviance (value/df) 531.84; Log Likelihood = -320.295; AIC = 660.591 a) Set to 0 because this parameter is redudant
The type of anatomical structure was also analysed by developing a model using the BRAS variable however due to the lack of space results were not included. Nevertheless, fourteen categories were found statistically significant (level of confidence 95%), when compared with the reference category lower extremity×skeletal, with all threshold based on MAIS level also significant revelling that those injuries have distinct levels of impact on each severity score. From these fourteen categories, half were found to have positive estimated parameters values, showing in this case that they produce an higher impact on severity when compared to the reference category. That was the case of all head categories for example.
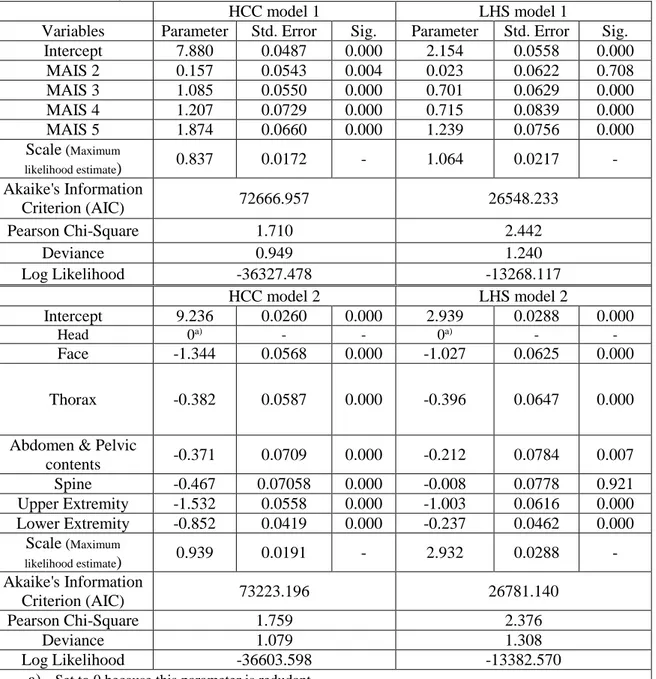
Secondly, HCC and LHS were modelled separately for MAIS and body region variables. Table 3 shows the results of the four models, i.e. HCC model 1 and model 2, LHS model 1 and model 2. Maximum likelihood estimate method was used for this GLM. All variables of the two HCC models show to be statistically significant. From the estimated parameters of MAIS categories, we can conclude that HCC increase with MAIS. The negative values of the estimated parameters of the body region categories indicate that the head is the most expensive body region in terms of medical treatments of injuries. This body region is also associated to a high probability of being a serious injury as shown by the MAIS model. Thorax, and abdomen and pelvic contents are also associated to high HCC and injuries on upper extremity are related to low HCC.
The type of anatomical structure was also included in the model using the BRAS variable, with several estimated parameters with statistical significance (95% level of confidence). Using the lower extremity×skeletal category as reference, only 5 categories in a total of 24 categories were not found significant, revealing that each BRAS category represents different medical treatment costs. The most expensive medical treatment is associated to injury on head with loss of consciousness and the lowest expensive are both injuries in whole area one on the abdomen and pelvic contents, and the other on the head.
Table 3: Results of the Generalized Linear Models – HCC and LHS models
HCC model 1 LHS model 1
Variables Parameter Std. Error Sig. Parameter Std. Error Sig.
Intercept 7.880 0.0487 0.000 2.154 0.0558 0.000 MAIS 2 0.157 0.0543 0.004 0.023 0.0622 0.708 MAIS 3 1.085 0.0550 0.000 0.701 0.0629 0.000 MAIS 4 1.207 0.0729 0.000 0.715 0.0839 0.000 MAIS 5 1.874 0.0660 0.000 1.239 0.0756 0.000 Scale (Maximum likelihood estimate) 0.837 0.0172 - 1.064 0.0217 - Akaike's Information Criterion (AIC) 72666.957 26548.233 Pearson Chi-Square 1.710 2.442 Deviance 0.949 1.240 Log Likelihood -36327.478 -13268.117 HCC model 2 LHS model 2 Intercept 9.236 0.0260 0.000 2.939 0.0288 0.000 Head 0a) - - 0a) - - Face -1.344 0.0568 0.000 -1.027 0.0625 0.000 Thorax -0.382 0.0587 0.000 -0.396 0.0647 0.000
Abdomen & Pelvic
contents -0.371 0.0709 0.000 -0.212 0.0784 0.007 Spine -0.467 0.07058 0.000 -0.008 0.0778 0.921 Upper Extremity -1.532 0.0558 0.000 -1.003 0.0616 0.000 Lower Extremity -0.852 0.0419 0.000 -0.237 0.0462 0.000 Scale (Maximum likelihood estimate) 0.939 0.0191 - 2.932 0.0288 - Akaike's Information Criterion (AIC) 73223.196 26781.140 Pearson Chi-Square 1.759 2.376 Deviance 1.079 1.308 Log Likelihood -36603.598 -13382.570
a) Set to 0 because this parameter is redudant
The results of the LHS model 1 show that there is not a statistical significant difference between score 1 and 2 of MAIS scale. In this case, we may conclude that slight injury can include MAIS 1 and MAIS 2 if classified according to LHS. Also, the estimated parameters of MAIS 3 and MAIS 4 categories are very similar, showing that there is not a large difference in terms of LHS between both categories. Regarding LHS model 2, the estimated parameter of the spine category does not show to be statistically significant. The estimated parameters of the other categories show the same kind of relative impact on type of body region of the estimated parameters obtained by HCC model 2 however, in general, with lower values than those obtained by the HCC model 2 for the same categories. In sum, we can argue that LHS does not represent clearly the type of medical treatment as HCC response variable, at least in terms of injury severity and type of body region.
5.
DISCUSSION
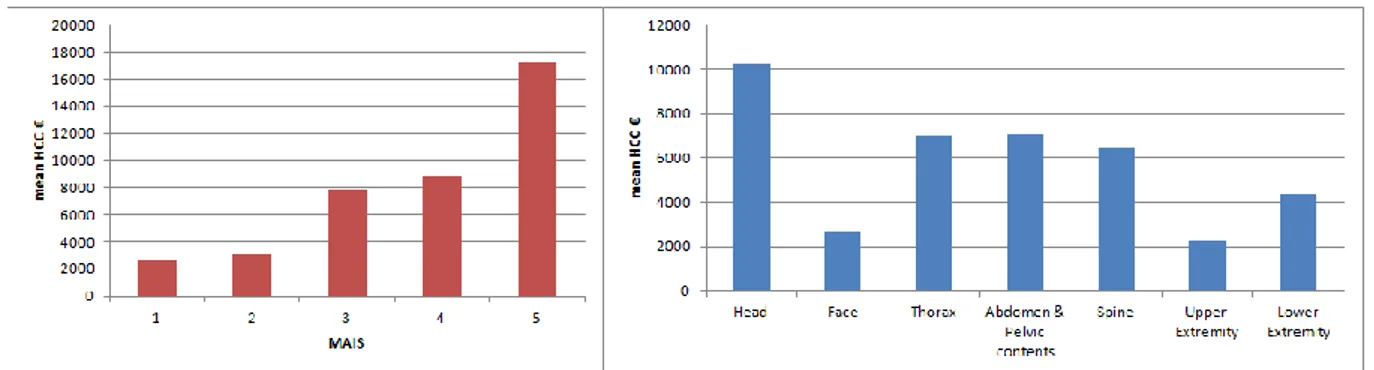
Several models have been examined in this study providing the analysis of the variables obtained by clinical metrics usually reported on hospital admission department. Firstly, the ordinal logistic model revealed the impact of the type of body region injured on the severity according to MAIS scores. Therefore, a correlation between both variables was identified as expected. Secondly, two type of response variables were analysed namely HCC and LHS. The LHS is also an input to estimate medical costs has explained before, and it has been widely used to as the official classification system of traffic injury severity. However, studies showed large discrepancies between this type of classification and the MAIS classification (Ferreira, et al. 2015b) leading to biased injury severity interpretation, e.g., if a patient stays longer in the hospital due to other reasons besides the accident injuries, or because of administrative reasons that lead to a delay on the discharge. Nevertheless, the LHS model can be use for comparison purpose. In fact, differences were found between HCC model and LHS model in terms of MAIS and body region analysis. For instance, and despite both model results pointed out that increasing MAIS scores the costs as well as the number of days in the hospital increase, in the case of LHS no difference was found between MAIS score 1 and score 2. This result is in line with the cut-off point assumed by EC and OECD, i.e. MAIS+3 since no difference between scores 1 and 2 exists. On the contrary, the HCC model results reflect each score severity level although, it is evident the highest leap between score 2 to 3 and between score 4 to 5, as can been observed in Figure 2.
Figure 2 shows the HCC obtained per each MAIS score and type of body region. Score 5, which correspond to the highest level found in this data set, has the highest mean cost that is 17,223 € with a large difference from score 4 (8,840 €). Note that the HCC cost per patient is 6,675 € as shown in Table 1. Also, Figure 2 shows the difference found in terms of HCC between types of body region injured. An injury on head may costs around 10,256 € in contrast to an injury on upper extremity, which may cost 2,217 €.
Figure 2: HCC per MAIS score and per type of body region
From this overview, we may conclude that disability weights should be considered to develop a robust tool to estimate medical costs.
To a complete figure of health care costs associated to traffic injury, a measure of long term costs should be also included. Burden-of-disease using disability-adjusted life-year (DALY) approach has been highly applied and it has promoted by WHO. This approach, which combines premature years of life lost (YLL) with years lived with disability (YLD), has been applied in general injuries population in different countries (Polinder, et al. 2015) and has been adapted to the needs and availability of data on the temporary and permanent consequences of non-fatal injuries as in Haagsma et al. (2012). Also,
studies compared the burden of traffic injuries , showing that low severity injuries (MAIS 1 or MAIS 2) suffers from permanent consequences (Polinder, et al. 2015).
To link injury incidence data to disability information, an anatomical classification system is needed to link each injury group to a disability weight and to distinguish the nature and localization of the injury. The global burden disease (GBD) study group developed a set of 33 disability weights for injuries (Polinder, et al. 2015). Data on the incidence of injuries described by ICD have to be collapsed before they can be linked to these 33 groups. After that, it is possible to use the information of disability weights, the duration of injury-related disability and son on using GBD published tables or equivalent such as Haagsma et al. (2012). The challenge is to convert AIS codes already used for MAIS and body region purpose to the functional diseases classification groups. To do that, medical expertise is required to develop a validation process and then eventually, new disability weights are needed to be estimated.
REFERENCES
Bambach, M. R. and Mitchell, R. J. (2015). Estimating the human recovery costs of seriously injured road crash casualties. Accident Analysis & Prevention 85, 177-185.
Blincoe, L., Seay, A., Zalosshnja, E., Miller, T., Romano, E., Luschter, S. and Spicer, R. (2002). The
economic impact of motor vehicle crashes 2000. N. H. T. S. A. U.S. Department of Transportation
Technical Report Report No DOT HS 809 446.
Carter, P. M., Flannagan, C. A. C., Reed, M. P., Cunningham, R. M. and Rupp, J. D. (2014). Comparing the effects of age, BMI and gender on severe injury (AIS 3+) in motor-vehicle crashes.
Accident Analysis & Prevention 72 (0), 146-160.
Chen, H. Y., Jan, S., Boufous, S., Martiniuk, A. L. C., Ivers, R., Senserrick, T., Norton, R. and Muscatello, D. (2012). Variations in car crash-related hospitalization costs amongst young adults in New South Wales, Australia. Injury 43 (9), 1593-1599.
Couto, A., Rodrigues, C., Tavares, J. P., Amorim, M. and Ferreira, S. (2015). D2 - Final Deliverable. Ferreira, S., Couto, A. and Amorim, M. (2015a). Factors affeting the injury severity according to MAIS classification. In Proceedings of the Road Safety & Simulation International Conference 2015 (pp. 11), Orlando, Florida USA.
Ferreira, S., Falcão, L., Couto, A. and Amorim, M. (2015b). The quality of the injury severity classification by the police: An important step for a reliable assessment. Safety Science 79, 88-93. Forman, J. L., Lopez-Valdes, F. J., Pollack, K., Heredero-Ordoyo, R., Molinero, A., Mansilla, A., Fildes, B. and Segui-Gomez, M. (2012). Injuries among powered two-wheeler users in eight European countries: A descriptive analysis of hospital discharge data. Accident Analysis & Prevention 49
(0), 229-236.
Gómez-Restrepo, C., Gómez-García, M. J., Naranjo, S., Rondón, M. A. and Acosta-Hernández, A. L. (2014). Alcohol consumption as an incremental factor in health care costs for traffic accident victims: Evidence in a medium sized Colombian city. Accident Analysis & Prevention 73 (0), 269-273.
Haagsma, H. A., Polinder, S., Lyons, R. A., Lund, J., Ditsuwan, V., Prinsloo, M., Veerman, J. L. and Beeck, E. F. v. (2012). Improved and standardized method for assessing years lived with disability after injury. Bulletin of the World Health Organization 90, 513-521.
International Traffic safety Data and Analysis Group. (2012). Reporting on Serious Road Traffic
Casualties. Combining and using different data sources to improve understanding of non-fatal road traffic crashes.
Liu, W.-C., Doong, J.-L., Tsai, S.-L., Lai, C.-H. and Jeng, M.-C. (2009). Integrated model of simulated occupant injury risk and real medical costs. Journal of Safety Research 40 (6), 461-468. MacKenzie EJ, Steinwachs DM and Shankar B. (1989). Classifying trauma severity based on hospital discharge diagnoses. Validation of an ICD-9CM to AIS-85 conversion table. Med Care 27 (4), 412-422.
Manning, W. G. and Mullahy, J. (2001). Estimating log models: to transform or not to transform?
Journal of Health Economics 20 (4), 461-494.
Mathauer, I. and Wittenbecher, F. (2013). Hospital payment systems based on diagmosis-related groups: experineces in low- and midle-income countries. Bulletin of the World Health Organization
91, 746-756A.
Polinder, S., Haagsma, J., Bos, N., Panneman, M., Wolt, K. K., Brugmans, M., Weijermars, W. and van Beeck, E. (2015). Burden of road traffic injuries: Disability-adjusted life years in relation to hospitalization and the maximum abbreviated injury scale. Accident Analysis & Prevention 80 (0), 193-200.
Polinder, S., Meerding, W. J., van Baar, M. E., Toet, H., Mulder, S., van Beeck, E. F. and group, t. E. r. (2005). Cost Estimation of Injury-Related Hospital Admissions in 10 European Countries. Journal
of Trauma and Acute Care Surgery 59 (6), 1283-1291.
Scholten, A. C., Polinder, S., Panneman, M. J. M., van Beeck, E. F. and Haagsma, J. A. (2015). Incidence and costs of bicycle-related traumatic brain injuries in the Netherlands. Accident Analysis &
Prevention 81, 51-60.
Shen, S. and Neyens, D. M. (2015). The effects of age, gender, and crash types on drivers’ injury-related health care costs. Accident Analysis & Prevention 77 (0), 82-90.
Tarko, A. and Azam, M. S. (2011). Pedestrian injury analysis with consideration of the selectivity bias in linked police-hospital data. Accident Analysis & Prevention 43 (5), 1689-1695.
World Health Organization. (2013). Global Status Report on Road Safety 2013: Supporting a Decade