Teknik och samhälle datavetenskap
Bachelor’s thesis 15 credits, ground level
Detecting the presence of people in a room using motion
detection
Detektera människors närvaro i ett rum med hjälp av rörelsedetektering
Linus Granath
Andreas Strid
Exam: Bachelor’s degree Area: Computer Science Program: Data & Mobil IT Date for examination: 2016-05-30
Supervisor: Dimitris Paraschakis Examinator: Radu-Casian Mihailescu
Abstract
Companies face a problem where employees reserve rooms and do not show up, which leads to money and resources loss for the companies. An application capable of detecting the presence of people in a room could solve this problem.
This thesis details the process of building an Android application capable of detecting the presence of people in a static room using motion detection. The application was developed through a five-staged process and evaluated by performing experiments which measured the accuracy of the application.
The finished application is installed on a Sony Xperia M4 Aqua device which is mounted high up on a wall in a conference room where the application takes images of the room. The application is connected to a Google Drive account where the application uploads acquired images with an appropriate label. The application achieved an accuracy of 94.18% in an experiment where 550 images where taken automatically by the application in different conference rooms with and without people inside them.
Keywords: Android application, image processing, cloud storage, motion detection, people detection, computer vision, pixel
Acknowledgements
First of all we would like to thank our supervisor Dimitris Paraschakis for guiding us throughout the thesis where he was very helpful. We would also like to thank Mag-nus Krampell for his advice and comments on the thesis. We would like to thank Alex Rodzevski who brought us the the project from Sony Mobile Communications to Malmö högskola. Lastly we would like to thank Jim Rasmusson who was our industry super-visor from Sony Mobile Communications, he gave us the resources needed to finish the application and helped us during the development.
Table of contents
1 Introduction 1 1.1 Background . . . 1 1.2 Research aim . . . 1 1.3 Limitations . . . 2 2 Theoretical background 3 2.1 Cloud Storage . . . 3 2.2 Digital imaging . . . 3 2.3 Computer vision . . . 3 2.4 Motion detection . . . 4 2.5 Android . . . 4 2.6 API . . . 4 3 Related Work 6 3.1 Cloud Storage . . . 6 3.2 Computer vision . . . 6 3.3 Motion detection . . . 6 4 Methodology 8 4.1 Construct a conceptual framework . . . 84.2 Develop a systems architecture . . . 9
4.3 Analyze and design the system . . . 9
4.4 Building the system . . . 9
4.5 Observe and evaluate the system . . . 9
4.5.1 Initial parameter experiment . . . 10
4.5.2 Tuning experiment . . . 10
4.5.3 Accuracy experiment . . . 10
5 Result 11 5.1 Construct a conceptual framework . . . 11
5.1.1 Cloud storage selection . . . 11
5.1.2 Computer vision selection . . . 11
5.1.3 Problem tree . . . 12
5.1.4 OpenCV . . . 13
5.1.5 Cloud storage . . . 13
5.1.6 Android . . . 13
5.2 Develop a systems architecture . . . 13
5.2.1 OpenCV . . . 14
5.2.2 Android . . . 14
5.2.3 Google Drive . . . 14
5.3 Analyze and design the system . . . 14
5.3.2 Sequence diagram . . . 17
5.3.3 Test cases . . . 18
5.4 Building the system . . . 19
5.4.1 Settings . . . 20 5.4.2 Average buffer . . . 21 5.4.3 Absdiff . . . 22 5.4.4 Binary image . . . 23 5.4.5 Movement threshold . . . 23 5.4.6 Cloud storage . . . 24
5.5 Observe and evaluate the system . . . 25
5.5.1 Initial binary threshold . . . 25
5.5.2 Initial buffer size . . . 25
5.5.3 Initial movement threshold . . . 25
5.5.4 Tuning experiment . . . 27
5.5.5 Accuracy experiment . . . 28
6 Discussion 30 6.1 Motion detection . . . 30
6.1.1 Selection of motion detection . . . 30
6.1.2 Motion detection method evaluation . . . 30
6.2 The parameters evaluation . . . 31
6.2.1 Buffer size . . . 31
6.2.2 Binary Threshold . . . 32
6.2.3 Movement Threshold . . . 32
6.3 Does the prototype meet the requirement specifications? . . . 33
6.4 Comparison with related work . . . 33
6.4.1 Counting people using video cameras . . . 33
6.4.2 A Foreground-background Segmentation Algorithm for Video Se-quences . . . 34
7 Conclusion 35 7.1 Contribution for this thesis . . . 35
List of Figures
1 The processes of Nunamaker’s methodology . . . 8
2 The problem tree. . . 12
3 System view of the application, OpenCV and Google Drive. . . 14
4 Class diagram of system. . . 15
5 MainFragment Gui. . . 16
6 OptionsFragment GUI . . . 17
7 Sequence diagram of the system . . . 18
8 8.1 current image, Figure 8.2 average image, Figure 8.3 binary image . . . . 20
9 9.1 current image, Figure 9.2 average image, Figure 9.3 binary image . . . . 20
10 Illustration of a new element entering the circular buffer. . . 21
11 Graph of processing time for 10 images of various sizes . . . 22
12 Illustrate an example of the movement_image passing through the binary-Threshold to become the binary image. . . 23
13 13.1, empty room, Figure 13.2, people in room, Figure 13.3 light being turned on/off . . . 24
14 Stored images on Google Drive . . . 25
15 Measured ratio values when there are people in the room . . . 26
16 Measured ratio values when there is no one in the room . . . 27
17 Measured ratio values when lighting in the room was switched on/off . . . . 27
List of Tables
1 Cloud storage services upload time . . . 112 Test cases. . . 19
3 The results of the tuning experiment . . . 28
4 Confusion Matrices showing the classified data from the experiments . . . . 29
1
Introduction
This section contains the background of why the product is made and the research goal of the thesis.
1.1 Background
Many companies face the problem where employees reserve rooms and do not show up, which lead to money and resources loss for the companies. Another problem that exists in the image recognition field is having a big database containing diverse images of certain objects/areas. A database like that is wanted because the images can be used as training data to train programs to recognize specific types of images. When training the programs images that does not contain the object needs to be used too so the program learns to tell the difference between the specific object and something else. Sony have employees researching in the image recognition field where the employees currently take images for their database and categorizes them manually. Looking through thousands of thousands images manually and labeling(changing the filename) them correctly consumes a lot of time which could have been used elsewhere.
Sony brought us these problems and they also brought us a requirement specification that our solution would need to fulfill, which can be seen in Apendix A. An important requirement was that the solution should be an Android application using Sony’s smart phone Sony Xperia M4 Aqua front camera. The reason of using the smart phone was that its front camera has a 5MP, 720p resolution, which is a high enough resolution to see people clearly in images but low enough to not see the content of computer screens. The images should not reveal important/personal data on peoples computers, the images should only be used for research purposes. The solution we propose to solve Sony’s problems is an Android application that should work as follows: After acquiring an image the application has to decide if the image contains people or not, then the images containing people will be labeled with “people in room” and uploaded to a cloud storage service. If the image does not contain people it will be labeled as “empty room” and uploaded to a cloud storage service. The complete solution will be the application installed on an Sony Xperia M4 Aqua device that will be mounted to a wall/roof in a conference room and take images automatically within a certain time interval.
1.2 Research aim
The research aim of this thesis is how to create a camera application capable of detecting the presence of humans inside a room and organize acquired images in an online storage service. The following research questions will be answered.
• How can a computer system be designed with the capability of recognizing the pres-ence of people in images acquired from a camera in a conferpres-ence room?
1.3 Limitations
This section lists the limitations of the application.
• The first limitation is that the application will constantly take pictures of a company’s employees. This can be a problem because many people want privacy and not to be under surveillance all the time. Which means that our application can only be applied where the company and the employees have an agreement on surveillance policy. • The second limitation is that the application will only work properly if it is in a
position which gives the application’s camera a field of vision of the entire room. If the application’s camera can not see the entire room, it can never be sure if there are people inside the room or not.
• The third limitation of the application is that it is based solely on motion detection, it will not be able to tell the difference between moving objects, for example, a fan’s movement and a human’s movement. This could lead to problems in a room which is not static.
• The application only works on Android devices and the parameters are tuned for a Sony Xperia M4 Aqua device.
2
Theoretical background
This section aims to describe different notions used throughout the thesis and to give the reader the background information needed to fully understand the thesis.
2.1 Cloud Storage
Cloud storage has its roots in the 1990s when a group of engineers developed software capable of storing backup files in a server on a Local Area Network(LAN). There were several different companies which focused on backup management but NetBackup is one of the few who is still on the market. NetBackup was bought by Veritas[1] on May 7th 1997.
Today personal cloud storage services allows users to store files on servers dedicated to cloud storage. Since the files are stored on servers the files can be accessed remotely, which facilitates collaboration in team projects[2]. One of the benefits with cloud storage is that it is hard to loose uploaded data due to the files being stored on multiple servers, which means if a server crashes the files are still secure on other servers.
There are several providers of cloud storage among which the three biggest are OneDrive by Microsoft, Google Drive by Google and Dropbox by Dropbox. The services typically offer free storage space up to a limit of 5 to 10 GB and the user can pay a certain fee to increase the storage size. Some cloud storage services offer version control, which allows the users to revert back to earlier versions of their files.
2.2 Digital imaging
A digital image consist of small elements called pixels [3]. A pixel consists of tree smaller sub pixels, each sub pixel is used to represent a single color red, green and blue (RGB). Each sub pixel can give its color a different brightness by changing its digital value between 0-255. This means that each pixel can give a color combination of 256 x 256 x 256 which is over 16.7 million different colors. A High Definition(HD) image consist of 1920 pixels horizontally and 1080 pixels vertically which give the image over 2 million pixels. Image processing can be used on digital images to change their appearances by changing the image data, which means the pixel data changes. For example image processing algorithms can be used to turn a colored image into a grey scaled image. A grey scaled image does not use RGB values in the sub pixels, instead it only uses one data value which defines the intensity of white light, the range of the value is between 0-255 where 0 is black and 255 is white.
2.3 Computer vision
Computer vision (CV) is an area of computer science which focuses on making computers capable of interpreting images. Computer vision started off in the early 70s/late 60s when Martin Minsky asked his undergraduate Gerald Jay Sussman to link a computer to a
The 90s/00s was considered the golden era of computer vision[5], it was during this time that modern computer vision became a reality. Algorithms for feature extraction and object recognition were developed and tools for computer vision were created, such as OpenCV.1
Today computer vision is commonly used together with machine learning algorithms, which can be trained to detect certain features or objects, for example counting the amount of people in images[6]. Computer vision can be applied in many areas such as in medicine, where a computer can be used to detect tumors by analyzing images of patients[7]. It is also used in smart cars to detect people and obstacles on a road in order to avoid collision, such as Mobileye[8].
2.4 Motion detection
Motion detection can be used for the purpose of automatically executing a task when motion occurs. For example motion detection can be used to light a room when people enter the room or be applied to security systems that detects criminal activity. There are multiple tools to detect motion, some are hardware tools such as infrared sensors (IR sensors)[9] and some are software tools such as image processing techniques. A IR sensor detects infrared radiation which human bodies produce when they generate warmth through the body.
Detecting motion through image processing can be done by comparing two images with each other. This is done by comparing the pixels at the same positions between the two images. If the images are the same it means that each difference between two pixels are 0. But if the images are different the pixel difference between some pixels will be above 0. For example comparing an image of an empty room with an image of the same room but with people inside it would yield differences in the pixels where the persons are in the image.
2.5 Android
Android is an Operating System(OS) created by Google, it is used for devices such as tablets, mobile phones and netbooks. HTC Dream was the first phone on the market which used Android and it was released on the 22th October 2008[10]. Android is designed primarily for devices with touchscreens and uses gestures to navigate, such as swiping, tapping and pinching. Android was released as open source by Google and companies like Sony and Samsung can use Android on their devices, which lead to Android being used on many different kinds of devices unlike IOS which is only used by Apple’s devices. Android has gained a significant market share, as of 2015 Q2 Android have 82.8% of the market share on smart phones[11].
2.6 API
An API(Application Program Interface) is a set of routines and protocols which is com-monly used for interaction between different kinds of applications. An API usually has a
way of accepting and sending back messages, which allows different applications to com-municate. API:s can be web services which facilitates retrieval of information[12]. For example if an application wants to retrieve the current weather it could go to weather.com and scan through the page in order to find the desired weather. This would be extremely inefficient and if the page went through changes the application might not be able to scan the page properly anymore. Instead an API could be used where the application sends a message to the server with information about city and day, then the API sends a mes-sage back containing weather information. In the application an API is used in order to establish a connection between the Android application and a cloud storage service.
3
Related Work
In this section a list of papers which are related to this thesis is reviewed. The papers where found by searching for words such as "motion detection", "opencv android" and "cloud storage evaluation" on IEEE2
3.1 Cloud Storage
In [2]the authors evaluate different cloud storage services, such as OneDrive, Dropbox, Google Drive and Cloud Drive. They evaluate the cloud storage services by measuring and comparing compression, deduplication(server checks for duplicates), delta encoding and bundling. They reach the conclusion that Dropbox offers the most capabilities of the analyzed cloud storage services.
In [13] Abhishek and Megha compare and evaluate different cloud storage services. The evaluated cloud storage services are Amazon cloud storage, DropBox, Google Drive and MiMedia. They compare how long it takes to upload or download a 1,5 and 10MB file at different times of a day on the different cloud services. They reach the conclusion that Google Drive excels in upload time, any time of the day closely followed by Dropbox and Amazon cloud storage.
The papers above helped in deciding which cloud storage service to use in the applica-tion.
3.2 Computer vision
In[14] Tahkker and Kapadia implemented OpenCV on Android. Their goal was to give the readers an idea on what is required for using OpenCV with Android. The authors displayed the results of applying certain filters to an image, such as color conversion, gray scale and a dialation. The authors also tested the features on three different devices to evaluate the time taken for the algorithms to finish.
In[15] the authors made an instruction guide with theory behind it on how to utilize OpenCV with the purpose of image recognition. The article covered image handling and different machine learning algorithms that OpenCV contains. The first part of the paper explained how to handle images in the form of filtering, object recognition and image segmentation. The second segment explained how different machine learning algorithms worked such as decision trees, k-mean clustering and neural networks. This article helped in understanding how to use and utilize OpenCV in order to create an application capable of detecting the presence of people.
3.3 Motion detection
In[6] Roquiero and Petrushin create a system capable of counting the amount of people in an environment with the help of a camera. They accomplish this by processing acquired images and extracting certain features with the help of motion detection. This was done by using a median filter which captured several images over a period of time and calculated the
2
median value of each pixel. Then the median image is subtracted pixel by pixel from the latest image, if the difference is above a certain threshold they are marked as foreground. The foreground pixels are the area that have moved during the period of time. They later apply a machine learning model trained to count humans in images onto the foreground pixels. By following those steps they reach an accuracy of 98.64% in detecting if there is more than one person in the view. They reach an accuracy of 86.9% in counting the exact amount of people in images using the 1-nearest neighbour algorithm. The processing and foreground extraction algorithms that was used in this paper were used in our application. In[16] the authors try to create a good system for motion detection for sensitive areas such as banks and business enterprises. They use a similar method as mentioned in[6]. First of all they take sample images from a web cam recording images, they then store those images in buffer which they use in order to calculate the difference between the sampled images. Each time they recognize movement a counter is increased and if it goes above a certain threshold they send a message to a mobile phone that movement have occurred and turn on a buzzer. This paper brings up certain image processing methods that we chose to implement into our solution.
In [17] Wei, Li, Yue present a foreground-background algorithm used for motion detec-tion in the purpose to track moving objects from a video camera. The authors accomplished this by basing their solution on Gaussian Mixture Model (GMM), which is a probability density function. The authors modified the traditional GMM algorithm by adjusting the Gausian parameters and number of components, the authors did this to reduce computing time. The authors used their GMM algorithm on each pixel in each frame in order to make a foreground-background segmentation. When the foreground and background have been defined the authors make the frame binary, where the foreground becomes white (moving objects) and the background becomes black (none moving objects). Then the authors take the binary images through filters to remove noise such as wind, light and shadows. The authors compared their GMM algorithm with a traditional GMM algorithm through an experiment where a video camera tracks moving object in traffic and in a campus. The result is that the traditional GMM had an precision of 58% while their GMM algorithm had an precision of 77% tracking moving objects in trafic. The solution used in this paper was considered as a choice for the motion detection method.
4
Methodology
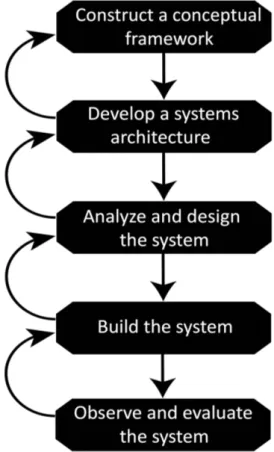
Nunamaker’s method[18] is a design science method used for developing a software artifact. It was chosen as the methodology for the application because of its clear development pro-cess and also because the method consists of prototype phases which suit the development of the application. Figure 1 describes the steps in the development process to create the application. In the following sections the steps taken in the development are described in detail.
Figure 1: The processes of Nunamaker’s methodology
4.1 Construct a conceptual framework
The first step in the development process was to get a clear understanding of which ques-tions needed to be answered and what problems needed to be solved. Information needed to be gathered in order to understand and solve the problems that the requirements(see Appendix A) would bring. The two main areas that needed to be studied more deeply in order to build the application were computer vision(mainly motion detection) and cloud storage. A literature review was performed to gain knowledge of these areas. The goal of the literature review was to see if the requirements of the application were possible to
fulfill and also to select the cloud storage service and computer vision tool for the appli-cation. The selection of the cloud storage service and computer vision tool was based on the knowledge gained from the literature, which brought up the strengths and weaknesses of the different services/tools. The service and tool with most promising result from the review was selected for the application. When the selection of the cloud service and com-puter vision tool was completed a problem tree(see Figure 2) was created. It listed all the problems needed to be solved in order to have a working application that also fulfill the requirements.
4.2 Develop a systems architecture
The next step of the process was to create an architectural view over the systems. The systems involved in the application was a computer vision tool, a cloud storage service and the Android system. The architectural view was a systems view created with the purpose of detailing the roles and the steps taken in each system(see Figure 3).
4.3 Analyze and design the system
The next step of the process was to design test cases and the architecture for the appli-cation. The architecture consisted of a class diagram and a sequence diagram. The class diagram that was created contained all the classes needed to create a working application, the class diagram was designed in a way so that each class had a clear role in the system. The sequence diagram was created with the purpose of detailing the process of how the acquired images would be manipulated, processed and analyzed. A set of test cases were built with the purpose of being able to validate the application when it was completed. The test cases were built from the requirement specification(see Appendix A) so that if the application passed all of the test cases it would meet the requirements.
4.4 Building the system
The next step of the process was the building of the system for the application. The system was divided into two main sub-systems, the cloud/GUI functions(Android) and the processing/analyzing of images functions(OpenCV). Each problem listed in the problem tree was solved separately and tested thoroughly with the relevant test cases before being integrated into the system.
4.5 Observe and evaluate the system
The last step was to evaluate the built application. This was done by measuring the accuracy of the application to verify that the accuracy was high enough to be considered functional. To get the best accuracy experiments were conducted to determine the best motion detection parameters for the application. The performed experiments are listed in more detail below.
4.5.1 Initial parameter experiment
This experiment was conducted with the goal of finding optimal initial parameters for the application.
The experiment took place in a conference room where the application installed on a smart phone was mounted at the height of 3 meters on a wall.
The experiment consisted of three smaller experiments where the first experiment took 20 pictures without people in a room the second experiment took 20 images with people inside the room and the third experiment took 20 images of a room where the lights where switched on and off. The ratio between movement and no movement in each image was measured. From the gathered data starting values could be set for the parameters3.
4.5.2 Tuning experiment
This experiment was conducted with the goal to find values for the parameters which gave good accuracy. The experiment was performed in the same settings as described in section 4.5.1. The experiment was to take 10 images of an empty room, 10 images with one person in the room and 10 images with two persons in the room. The experiment result was a measurement of how many of the 30 images were labeled right with either the label “empty room” or “people in room”. This was done by manually checking if the image content matched the labels. In each experiments the parameter had different values and the parameters corresponding to the most accurate labels were used in the next experiment.
4.5.3 Accuracy experiment
This experiment was conducted with the goal to verify that the best parameters were accurate enough to detect the presence of people reliably. The three parameters which yielded the best result from the previous experiment were chosen to be put through a longer more thorough experiment in order to establish which one of them that was the most accurate. The experiment was performed in the same settings as described in 4.5.1. During the experiment 550 images would be taken with a two minute interval. The images were acquired from four different rooms where people entered and leaved as they pleased. All of the images for each test would later be analyzed manually in order check that the image content matched the labels. The best performing parameters were used in the finished prototype application.
3The parameters are movement threshold, binary threshold and buffer size. See section 5.4 for more
5
Result
This section describes the result from each of the steps described in section 4 and shows how the application was designed.
5.1 Construct a conceptual framework
This section shows the choice of cloud storage service, computer vision tool and the con-structed problem tree. The results were derived from the literature review.
5.1.1 Cloud storage selection
The chosen cloud storage was Google Drive which is a free cloud storage service and it was chosen for the following reasons:
Upload time
Table 1 below shows the upload time for different cloud storage services during different time of day. The table is created from the results gained in[13], where they compare the upload time between four different cloud services during different times of the day. Google Drive was the best performing service, as can be seen in Table 1 below. The files which were uploaded where 1MB files which are close to the images acquired from the application.
Table 1: Cloud storage services upload time
Android Support
The cloud storage service which was chosen needed to have support for Android applica-tions. The following cloud storage services offered an Android API, which allows files to be uploaded from an Android device: Google Drive[19], OneDrive[20] and Dropbox[21]. Google Drive was created by the same company as Android, which leads to them having good support for interoperability. Dropbox had a couple features such as deduplication and p2p sync which Google Drive did not, however those features where deemed not important for our application.
5.1.2 Computer vision selection
The chosen computer vision tool that would be used for handling and processing the acquired images was OpenCV. OpenCV was released by Intel in 1996[22]. OpenCV is
to advance the research in computer vision by creating a library with optimized algorithms and functions that could be used for free. Over the years OpenCV have grown to contain over 2500 optimized algorithms, related to computer vision and machine learning. OpenCV was originally used in C/C++ programming languages, but have since then developed to support both Java and Python.
OpenCV was chosen because it supports all the major platforms, such as Windows, Ios, Linux, Android and BlackBerry[24], and their license allows OpenCV to be used in our application. OpenCv also have a lot of documentation on their algorithms.
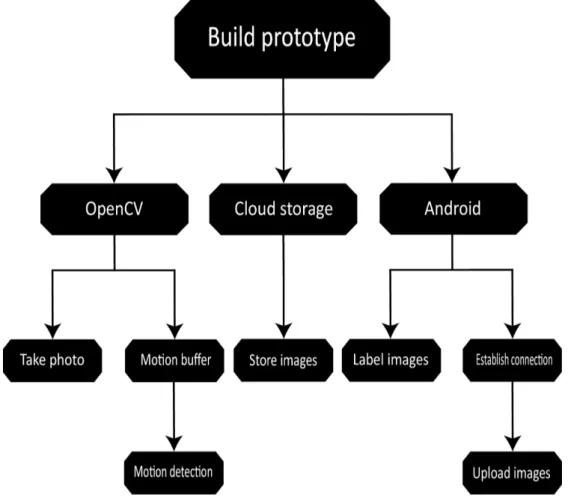
5.1.3 Problem tree
The problem tree was created to get a clear overview of problems that needed to be solved in order to create a functioning application that also satisfied the requirements (see appendix A). The problem tree consisted of the three main areas OpenCV, Cloud storage and Android, the areas were broken down into smaller problems. The final problem tree can be seen in Figure 2 below.
5.1.4 OpenCV
The OpenCV branch represented the problems needed to be solved in order to take a photo and decide if movement have occurred in it.
• Take photo: Initialize OpenCV on the android application and use its library in order to take and handle images.
• Motion buffer: A buffer that will store an amount of images with the purpose of creating an average image, that will represent the movements in a room over a period of time.
• Motion detection: A method that will decide if movements have occurred by comparing each pixel between the current image and the image from the motion buffer.
5.1.5 Cloud storage
The Cloud storage branch represents the problem needed to be solved in order to store the images that would be uploaded from the application.
• Store images: Organize the cloud storage in a way that the images would be organized by their labels.
5.1.6 Android
The Android branch represents the problems needed to be solved in order to label an image and upload it to Google Drive.
• Establish connection: Execute the Google Drive libraries on the application in order to establish a connection that can send pictures to a Google Drive account. • Label images: Execute the code that will label images with time, dates and the
content of the pictures, either “empty room” or “people in room”.
• Upload images: Initiate the code that will upload images to a Google Drive account
5.2 Develop a systems architecture
The architecture of the system was designed as a system view, detailing each crucial part of the systems. The architecture shows what the different systems OpenCV, Android and Google Drive are responsible for and what their roles are. The system view can be seen in Figure 3 below and each step in the process is explained in the following sections.
Figure 3: System view of the application, OpenCV and Google Drive.
5.2.1 OpenCV
OpenCV was a subsystem of the Android application used for taking images, processing them and analyzing them. In step 1 an image was taken automatically with the use of the device’s camera, the image was then processed in step 2 using various algorithms as can be seen in section 5.4, in the step 3 the images were analyzed and checked if they contained people or not.
5.2.2 Android
Android was the system used for handling the communication between Android and Google Drive, its main purpose was to display relevant data on the Android device and upload images to Google Drive. Step 4 was divided into two cases, if the image was deemed to contain people the image was labeled as "People in a room" and if the image did not contain people it was labeled as "empty room".
5.2.3 Google Drive
The role of Google Drive was to store all of the acquired images in relevant folders auto-matically.
5.3 Analyze and design the system
This section shows the class diagram, sequence diagram and test cases created for the application.
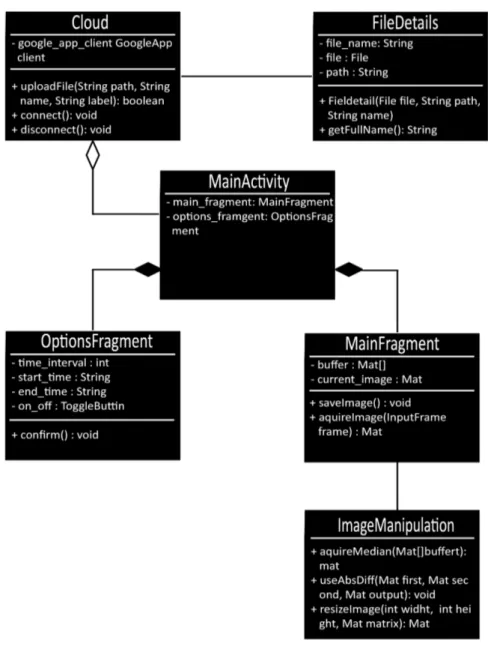
5.3.1 Class diagram
The class diagram was based on the problem tree so that the application that uses it would be able to solve the problems and fulfill the requirements. The class diagram can be seen in Figure 4 below.
Figure 4: Class diagram of system.
Cloud
The responsibility of the Cloud class is to handle all of the communication and interaction with Google Drive. It contained functions to initialize the API for Google Drive, as well as connect to the cloud storage. UploadFile was an important function used to upload a labeled image in the right category to the Google Drive account.
FileDetails
The FileDetails class is used for describing files being uploaded to the cloud storage. A FileDetails object contains the variables: name, the file itself, the label and the path to store it in.
ImageManipulation
ImageManipulation was used to handle images by analyzing and manipulate them. It contained the essential functions such as absdiff, aquireMedian and resizeImage, Which are further explained in section 5.5
MainFragment
The Mainfragment class contained the GUI for the main menu and consisted of a button that leads to the OptionsFragment menu, an on/off display that would show if the appli-cation is currently active and taking pictures and a display that showed what the camera saw. An image of the MainFragment screen can be seen in Figure 5 below.
Figure 5: MainFragment Gui.
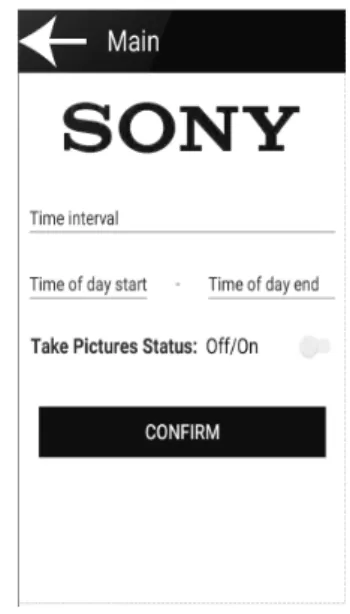
OptionsFragment
The OptionsFragment class contained a GUI that would set the trigger options for the application. The first option was the "time interval" option where the application would take pictures periodically depending on the applied interval. The second option was the “time of day” option where the application would only take pictures between a chosen start and end time of a day. The third option was a simple toggle where the user could turn the camera on/off. Then a confirm button would need to be pressed in order for all the settings
to be applied. It also contained a menu button that would lead to the MainFragment menu. An image of the OptionsFragment can be seen in Figure 6 below.
Figure 6: OptionsFragment GUI
5.3.2 Sequence diagram
The sequence diagram was designed to show the steps taken when an image is acquired, resized, processed and uploaded to Google Drive. It shows the roles of the three different classes MainFragment, ImageManipulation and Cloud. The functions called are the ones shown in the class diagram (Figure 4). The sequence diagram can be seen in Figure 7 below.
Figure 7: Sequence diagram of the system
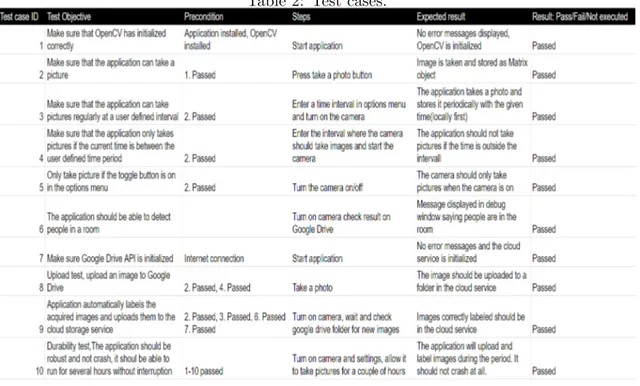
5.3.3 Test cases
Test cases were built to make sure that if the application passed the tests it would fulfill all of the requirements that were set by Sony. The test cases can be seen in Table 2 below, which details the objective of the tests, the preconditions(what needed to be done prior to performing the test case), steps taken during the test and the expected result. The finished application passed all of the test listed. Two test cases from Table 2 were described more detailed in the text below.
Table 2: Test cases.
Upload test ID 8
The test case objective was to have images being uploaded to the right folder in the Google Drive account, depending on their label. The test consisted of 10 images where five were labeled “empty room” and the other five “people in room”. The images were passed one by one through the upload method that would upload the images to the Google Drive account. The application successfully stored all the labeled images in their correct location.
Durability test ID 10
The test case objective was to see if the application could function properly without crash-ing durcrash-ing a long time period. The application was installed on a smart phone and the phone was connected to a charger. The test would last 72 hours and the "time interval" setting was set to one hour and the "time of day" setting was set to 08:00-24:00
The application did not crash during the 72 hours the durability test was performed and it also managed to take and upload the 48 images, the application therefore passed the test.
5.4 Building the system
In order for the application to detect the presence of people certain steps were taken to manipulate the images and extract features. The steps taken are described in the following
Figure 8: 8.1 current image, Figure 8.2 average image, Figure 8.3 binary image
Figure 9: 9.1 current image, Figure 9.2 average image, Figure 9.3 binary image
5.4.1 Settings
Before starting the application the parameters “time interval” and “time of day” had to be set. The number set to “time interval” would represent the amount of seconds the time period would be for taking an image, by setting “time interval” to 120 an image would be taken each 120 seconds. The numbers set to “time of day” would represent the time the application would be allowed to take images, by setting “time of day” to 16:00 - 21:00
images would only be taken during that time.
5.4.2 Average buffer
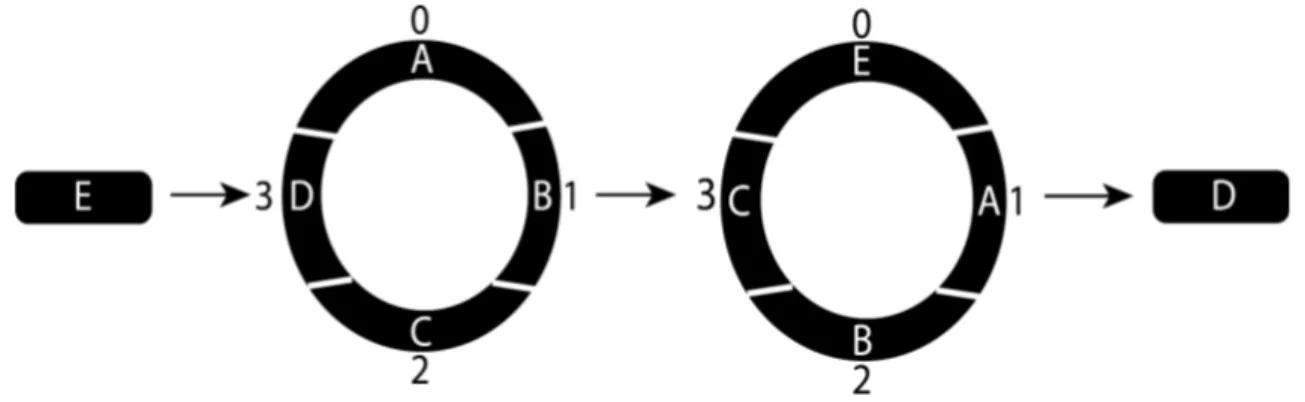
A circular image buffer named “average buffer” was used in the application. A circular buffer is a way to store a set amount of data. The data is stored in a way so that if new data is added the data will be stored in the first position of the buffer. The rest of the data in the buffer will be moved one step and the element at the end of the buffer will be removed. An illustration on how the buffer works can be seen in Figure 10 below.
Figure 10: Illustration of a new element entering the circular buffer.
The buffer had the dynamic size of 25% (see result in section 5.5.5) of the “time interval" variable, which means if the "time interval" is set to 100 seconds the buffer would take an image each fourth second until it reached 25 images which is its buffer size. It took approximately 1,5 seconds to process one image in the buffer, which leads to around 45 seconds of processing time if the original image was processed. This took way too long so it was decided to scale down the image two times(both width/height) before processing it. Which decreased the time taken to process one image to 0,3 seconds, which can be seen in Figure 11 below. The processed images were also changed to gray scaled images in order to further improve processing time.
Figure 11: Graph of processing time for 10 images of various sizes
The buffer was used to create an average image of the room by calculating the individual sum of each pixel position in the buffer and dividing by the size of the buffer in order to create an average pixel value. All the average pixel values were put inside a new image that became the average image of the room. The "average image" would represent the movements in the room over a period of time. The pseudo code for creating the average image can seen in Algorithm 1 below and an average image can be seen in Figure 8.2 and 9.2.
Data: image buffer
Result: calculate average image while i < max_rows do
while j < max_columns do sum ← 0
while k < amount_of _images do
sum ← sum + image_in_buf f er[i][j][k] end
average_pixel[i][j] ← sum end
end
Algorithm 1: Calculation of the average image
5.4.3 Absdiff
Absdiff was a function created in order to detect if movement had occurred inside a room. The function calculated the absolute value difference of each matching pixel between two images and created a new image with the absolute value difference in each pixel, the image was called “movement image”. If the difference value between two pixel is zero it means
that nothing have moved in that area, meanwhile if the difference value is greater than zero something have moved in that pixel area. The images that were compared to create the "movement image" where the "average image" and the image acquired when "time interval" expires. The pseudo code for the absdiff function is seen in Algorithm 2 below.
Data: image1, image2 Result: absdiff image while i < max_rows do
while j < max_columns do
dif f _value[i][j] ← |image1[i][j] − image2[i][j]| end
end
Algorithm 2: Calculation of the absdiff image
5.4.4 Binary image
A threshold called “binary threshold” was applied in order to only mark big movement changes in the images and to reduce noise. A threshold is something which can give different output if the input is between a set range of values. The “binary threshold” was set to the value 40 (see result in 5.5.5) and would only recognize an value higher or equal to 40 as movement. In order to see the movement in the image every pixel that was over the “binary threshold” got the value 255, which is the color white and everything below the threshold got the value 0 which is the color black. The “movement image” was passed through the "binary threshold" in order to get a clear view of the movement in the image by seeing all movements as the color white. The "binary image" can be seen in Figure 8.3 and 9.3. An illustration of how the "binary threshold" works can be seen in Figure 12 below, where each box represents a pixel and its value.
Figure 12: Illustrate an example of the movement_image passing through the binary-Threshold to become the binary image.
5.4.5 Movement threshold
“binary image”. Big differences could be from light changes in the room, which is not human movement but greatly changes the values of the pixels in the “movement image”. The “movement threshold” checked the ratio between white colored pixels and the total amount of pixels in an image. The condition to count as human movement in a image had to be higher than noise and lower than light changes. This resulted that the “movement threshold” got two conditions. If an image had an ratio which was below the lower threshold 0,1% the image would be labeled as “empty room”, if the ratio was above the higher threshold 15%(see section 5.5.3) the image would be discarded, because the application could not be sure if there are people in the room or not. If the ratio was between those values it was assumed that people were in the room and the image was labeled “people in room”. Figure 13.1 below shows a binary image which was created when no one was in the room, Figure 13.2 shows a created binary image when one person was in the room and Figure 13.3 shows the created binary image when the light in the room was turned on and off.
Figure 13: 13.1, empty room, Figure 13.2, people in room, Figure 13.3 light being turned on/off
5.4.6 Cloud storage
After the image had been labeled through the "movement threshold” process the image would be uploaded to a Google Drive account. The selection of the Google Drive account for the application happens when the application is used for the first time. When the application starts a window pops up that prompts the user to login to their gmail account in order to access Google Drive. When the account is set the verified labeled image will then be uploaded to this Google account in either the folder “people in room” or the folder “empty room”, depending on the label of the image. If the two folders does not exist on the account the application will create them on the account, so the images will be organized. The folders and images can be seen in Figure 14 below, where some images have been dragged out of the folders to give a better view.
Figure 14: Stored images on Google Drive
5.5 Observe and evaluate the system
When the application had been built it needed to be tested and evaluated. Good parame-ters for the motion detection needed to be found in order to achieve a good accuracy, this was done by performing the experiments below
5.5.1 Initial binary threshold
The start value for the "binary threshold" was selected through looking at other peo-ple’s solutions online[25], their values ranged from 10 to 25. It was decided to check the performance of the value 20 first.
5.5.2 Initial buffer size
The initial value for the buffer size was set to two because it is the smallest buffer size and before tuning the buffer size the tuning of the "binary threshold" and "movement threshold" would be performed first.
5.5.3 Initial movement threshold
The experiment was conducted by setting up the camera in an room. The application took 20 images of an empty room and 20 images with two persons in the room and 20 images of a room with light changes and people. The white pixel ratio was calculated
the values gathered when people were in the room, Figure 16 shows the values gathered in an empty room and Figure 17 shows the values from switching the lights on/off. The results shows that the lowest ratio achieved when people were in the room was 0,50% and the highest ratio achieved in an empty room was 0,04%. It was decided that the value of "movement threshold" would be 0,1% which allowed the application to be able to detect smaller motions from people, than the ones achieved in the experiment. Since the threshold was set to be 2,5 times higher than the highest ratio achieved in an empty room it was robust against noise. The lowest ratio achieved when the lights in the room was switched on/off was 19% it was decided that the light threshold would be set to 15%. This meant that an image containing a white pixel ratio lower than 0,1% was considered as an “empty room”, higher than 0,1% and lower than 15% considered “people in room” and higher than 15% considered as light changes and discarded. The reason for choosing only 20 images was that this was just an initial experiment conducted in order to get an idea of which parameters should be used.
Figure 16: Measured ratio values when there is no one in the room
Figure 17: Measured ratio values when lighting in the room was switched on/off
5.5.4 Tuning experiment
As can be seen in Table 3 below the parameters which had the most impact on the accuracy was the "movement threshold" and the "binary threshold". All of the tests where the
person in it and 10 images of two persons in the room. It was thus decided that the accuracy test would be performed with those parameters and only the buffer size would be changed.
Table 3: The results of the tuning experiment
5.5.5 Accuracy experiment
The parameters from the tuning experiment that yielded the best result was a movement threshold of 0,1% and a binary threshold of 40. Those parameters where used in this experiment which involved acquiring 550 images of difference conference room over a time, where people left and entered the rooms as they pleased.
To get a clearer view on how accurate the program was on labeling the images in the accuracy experiments a confusion matrix was applied (see table 4). A confusion matrix consist of rows and columns where the rows represent actual class (what the class really is) and the columns represent prediction (what the program think the class is). For example if an image actual class is "people in room" and the prediction of this image is "people in room" then the image is a true positive (the image got correctly identified). If the image actual class is "people in room" and the prediction for the image is "empty room" then the image is false positive (the image did not get correctly identified). The same logic goes for the empty room images as well. The confusion matrices for the accuracy experiments can be seen in Table 5 below.
Table 4: Confusion Matrices showing the classified data from the experiments
The experiments showed that experiment B had the greatest overall accuracy, a deeper insight on the parameter and accuracy of the experiments can be seen in table 5. As can be seen in Table 5 the highest overall accuracy achieved was 94.18% with a buffer size of 30, which is 25% of the value of the "time interval" variable.
Table 5: Accuracy measured from the different parameters
The end result was that the best values for the parameters for labeling the images correctly with the labels "people in room" and "empty room" in our application was:
• Movement Threshold = 0.10%. • Binary Threshold = 40.
6
Discussion
In this section the result that the application produced will be discussed, the research questions will be answered and limitations of the application will be discussed.
6.1 Motion detection
The highest accuracy achieved of the application’s motion detection was 94.18% based on 550 images taken, as can be seen in section 5.5.5. This result answers the research question “How accurate is motion detection for the detecting the presence of people in a room?”. Further discussion on how and why this accuracy was achieved and not a higher one will be discussed in the following sub sections below.
6.1.1 Selection of motion detection
The motion detection we used is based on image processing were image pixels are compared with each other in order to detect movements. Another solution could have been to use an IR sensor. The reason we did not use a IR solution was that as mentioned in the requirements specification(Appendix A) Sony wanted a solution using their phones that would not rely on external devices.
The other reason is that Sony is researching in the image recognition area and they wanted us to use a image processing solution that they could use and improve if the solution was done well enough.
6.1.2 Motion detection method evaluation
The application’s motion detection is capable of detecting very small movements a person makes in a room, which lead to the achieved accuracy of 94.18%.
The reason the application did not achieve a better accuracy was the problem that occurred when a transition from entering the camera’s view and then leaving the camera view happened. We called this the "transition problem". If "timer interval" was set to 60 seconds it meant that 15 images would be stored in the buffer.
If people would be visible on 14 of the 15 images of the buffer, the average image created would represent those people’s motions in the room. The problem occurs when the camera takes the final image, which is the image when the "time interval" has expired. If people leave the camera view when that image is taken it would mean that the image would be of an empty room. Then when the final image (which is empty room) was compared to the "average image" (which consisted of 14 images of people in room) the result would be that motion had occurred in the room, which would label the final image with "people in room", even though the image represent an empty room. This can be seen by looking at Table 5 where expirement B had an accuracy of 99.16% on images labeled with "people in room" and 80.21% of images labeled with "empty room" where the transition problem occurred.
A solution to this problem can be to use an reference image of a static room. This would work by first storing a static image of the empty room in which the mobile phone will be
mounted. Then the static image would be used for calculating the movement by comparing the static image to the last image taken. However this would lead to several problems and limitations for the application. First of all the lighting is different during different times of the day, so several static images would have to be taken. Also if something in the room had changed position since the static image was taken it would always consider it as movement unless the static image was updated regularly. Lastly, we want the application to be as automated as possible, so we do not want the user to have to take an image of the room before using the application.
A code solution that could have minimized the "transition problem" is to make the application only upload an image if the last image had the same label as the current one. This would probably reduce the "transition problem" because there would need to be two "transition problem" occurrences in a row for it to fail. The downside to this is that some images would not get uploaded, but it is preferable to achieve an higher accuracy than upload every image.
6.2 The parameters evaluation
The parameters binary threshold, movement threshold and buffer size from the experiment A (see Table 5) yielded the best result for our application. These parameters are adapted to the Sony Xperia M4 Aqua camera with a 5 MP 720p camera resolution. If the application would be installed on a smart phone with higher or lower MP on the camera, two choices could be made to make the motion detection as accurate as possible.
The first option is to find optimal parameters for the new phone by performing the experiments in 5.5.3, 5.5.4 and 5.5.5, in the purpose to adapt the parameters to the new smart phone camera. The other option is that the acquired images could be resized to the resolution found on an M4 Aqua, which is 720x480 pixels. Because the parameters are heavily defined by the resolution of the image it would be suitable if the images were scaled to the same size as the M4 Aqua.
6.2.1 Buffer size
As seen from the tuning experiment at section 5.5.4 the size of the buffer did not change the accuracy at all in those cases. The reason for that is that all the images taken at the tuning experiments were not taking in a real situation(i.e we did not move in or out of the camera view during the experiment). The 10 images of the empty room were taken without any people entering or leaving the cameras view. When there was time to take 10 images with one person we skipped the first photo where the person walked into the camera view in order to only have a buffer with one person in the room, the same for the two person in room images.
When deciding the buffer sizes for the accuracy experiment we had to think about how the size of the buffer matters. For instance the higher the buffer size is the more movement can be gathered over a period of time, but as the size increases each independent movement counts less and gets blurred out because of the average calculation. The lower the buffer
is the longer the calculation time for the average image will take, where one image takes 0.3 seconds to calculate.
The buffer needed to be dynamic in order to adapt to the "time interval" value. If the size was fixed the buffer would be updated less frequently the bigger the "time interval" is. For example, if the "time interval" is set to 120 and buffer size is 30 it will update the buffer every 4 seconds. However if the "time interval" is set to 240 and the buffer size is 30 it will only update the buffer once every 8 seconds. Because the application needs to capture as much movement as possible it needed to be dynamic.
We thought a dynamic size either 25% or 50% of the "timer_interval" would be a suitable size for the buffer. If the 50% buffer would yield a better result than the 25% buffer we would see if a 75% or a 100% would yield a better result. The buffer of 2 (which is 1.66% ) was also in the accuracy test to make sure that our theory that a average buffer was needed in order to have a more accurate motion detection. The test with 50% buffer size almost had the same accuracy as the one with 25%, the only difference was 1.63% (see Table 5). The reason for that small difference is that the biggest problem is the "transition problem" mentioned in section 6.1.2 and not the buffer size. The 1.66% buffer only had a total accuracy of 83%, this shows that the buffer size had some impact on the accuracy which means that our theory of a motion buffer is proven to yield a higher accuracy.
We choose the 25% buffer for the final prototype because it had the best accuracy (see Table 5) and handle the "transition problem" the best with 85% accuracy on empty rooms.
6.2.2 Binary Threshold
As seen from the tuning experiment at section 5.5.4 the value of 40 was the best value for the "binary threshold". We started at the value of 20 as suggested from a online solution [25]. That value of 20 did not work well for our motion detection compared to what the value of 40 did, as can be seen at Table 3. If the "binary threshold" is to low it will recognize noise in empty rooms as movements. This can be seen in our expirement B at Table 3, where the value 20 only got 70% of the images of an empty room labeled as "empty room".
A too high value would reduce noise from the empty room but it would also reduce human movements. This can be seen in our test ID 15 at Table 3, where the value 60 only got 60% of the images with one person labeled as "people in room". Through testing different values for the "binary threshold" we found that the value 40 brought the highest accuracy of all the tests in the tuning experiments, which can be seen in Table 3.
6.2.3 Movement Threshold
As seen from the tuning experiment in section 5.5.4 the value of 0.1% was the best value for the "movement threshold". The other value we tried for the "movement threshold" was 1%, which did not yield a good result as seen in Table 3 ID 5, where the the total accuracy was 60%. We already knew that 0.1% was better than 1% because of the earlier experiment 5.5.3 where we measured the noise levels and how much human motion was captured on an image. The highest noise found in an empty room was 0.04% and the lowest motion a person produced was 0.5%. The decision to put the "movement threshold" to 0.1% instead
of 0.04% was made for safety reasons. To have the threshold at 0.04% would mean that some images that are empty could be considered as people in room if the noise level would slightly go above 0.04% on some images of empty rooms. By having 0.1% which is 2.5 times higher than 0.04% we considered the chance of having noise count as human motion would be minimal.
6.3 Does the prototype meet the requirement specifications?
In section 5 we explained how we designed and created an application that is capable of detecting the presence of people in images. The proof that the application can detect the presence of people is that the application labels images with people in it as "people in room" and labels images of empty rooms as "empty room" with an accuracy of 94.18%. We believe that section 5 answers our research question "How can a computer system be designed with capability of detecting the presence of people in images acquired from a camera in a conference room?" Below is a discussion on if the application fulfilled the requirements.
• The application is created for Android OS.
• The hardware used was a Sony Xperia M4 Aqua with a 5 MP 720p camera resolution. • The application is capable of detecting people inside the room, with an accuracy of
94.18%. Therefore we consider this requirement to be fulfilled.
• The user can specify how often the application should take images through the "time interval" option.
• All of the acquired images that are below light threshold are uploaded to Google Drive.
• Since the application passed the durability test we consider the application to be robust enough.
6.4 Comparison with related work
In this section we compare and evaluate articles that use similar solutions that we used.
6.4.1 Counting people using video cameras
Roquiero and Petrushikn developed a system which was capable of counting the number of people in a dynamic environment. They used a combination of motion detection and machine learning in order to reach accuracy of 98.64% in detecting at least one human in the view. We reach an accuracy of 94.18% in over all accuracy and 99.16% on images containing people (Se table 5) in our prototype. Roquiero and Petrushkin’s experiments were been done in a dynamic environment and it is unclear if their work would perform
6.4.2 A Foreground-background Segmentation Algorithm for Video Sequences Wei, Li and Yue used a more advanced motion detection technique than we used. They used GMM algorithm that they modified in order to reduce computing time. The authors mentioned in their article that GMM is a very popular background modeling technique but they also acknowledge that GMM require a lot of computing time. The hardware the authors used was: DELL (Pentium (R) Dual-Core CPU, 3GHz, 2GB memory. By modifying the GMM algorithm the authors were able to reduce the down compute time enough to match their hardware and have a well functioning program. The hardware power of our Sony Xperia Aqua M4 is: Quad-core 1.5 GHz Cortex-A53 quad-core 1.0 GHz Cortex-A53.
One reason that we did not use a GMM solution was that the computing time would probably be to big for our application, due tho our hardware. Another reason is that we do not need to track moving objects through video frames, our application only need to detect the presence of human motion. For example a video filming one frame per second for a minute includes 60 frames, while our app takes frames/photos equal to 25% of the time interval variable. In this example the time interval is 60, which means that 15 frames per minute will be taken by our application instead of 60 frames. Our solution performed an accuracy of 94.18%, which we feel is a high enough accuracy to count as a viable solution for detecting the presence of humans in a room. We feel that our motion detection solution fits the static environment of a conference room, where people do not move as fast as they would in a open environment such as traffic or on the streets, we also made a solution that fitted our hardware well. If our application would be used in outside environments where people moves fast, a GMM solution might be more optimal than ours.
7
Conclusion
The application presented in this thesis is a proof of concept on how to create an application that can detect human motion in a room, which also uploads labeled images to a cloud storage service. The created application is adapted to a smart phone with a 5 mega pixel camera to yield optimal functionality. The application also needs an internet connection and a Google Drive account in order to upload images to the cloud service. The created application yields a good detection result with 94.18% accuracy on labeling the acquired images with a correct label(filename), i.e labeling the image if it contains people or not. The application is suitable in an environment which is static and the movement that occurs is caused by human movement, for example a conference room. The application’s motion detection has its limits, for example the application can not tell the difference between moving objects and human movement.
7.1 Contribution for this thesis
Our contribution with this thesis is a working Android application which can be used for detecting the presence of people in static rooms and also gather labeled images of conference rooms for research purposes, which are automatically stored on a Google Drive account. Most of the code for the application have been created by us. OpenCV is only responsible of acquiring the images, converting to grayscale and resize the images. The application is com-pletely open source and can be retrieved from www.github.com/lglinus/smartCamera.git
7.2 Future work
In order to make the application work better in rooms with various sizes it might be a good idea to make the binary/movement thresholds dynamic and dependant on the average distance in the room. Because if a human moves far away from the camera the difference in the image will not be as big as it would if the human was closer to the camera. In order to allow the application to cover bigger rooms an architecture could be setup that would allow multiple devices in the same room to communicate. If one of the devices register movement the device could upload the image with a human and label it, and after that tell the other devices to not upload their empty images. This would allow the prototype to cover most types of the room as long as enough devices can be provided.
The application could also implement classifiers created from machine learning algo-rithms which are capable of distinguishing between humans and objects. Machine learning is a way to teach programs to recognize certain features/patterns by training the programs beforehand with a lot of data. This would allow the application to be mounted in less static environments because it will no longer depend on motion instead the shapes of the objects in the images.
The machine learning could also label the acquired images in more detail, by for example counting the amount of people in the images, or even identifying who the people are and put that in the label as well.
References
[1] Veritas, Netbackup [Internet], 2016 [updated 03/05-2016, cited 03/05-2016]. Available at: https://www.veritas.com/product/backup-and-recovery/netbackup
[2] Bocchi, Drago, Mellia. Personal Cloud Storage Benchmarks and Comparison in Cloud Computing, IEEE Transactions, pp. 2015, vol.PP, no.99,
[3] Dictionary. Pixel: Define pixel [Internet]. 2016 [updated 2016, cited 12/05-2016]. Available at: http://www.dictionary.com/browse/pixel.
[4] Papert, The summer vision project, Massachusetts Institute of technology, 1996 [5] Efstration Graves, A brief history of computer vision [Internet]. 2016 [updated
05/05-2016, cited 05/05-2016]. Available at: http://www.egavves.com/a-brief-history-of-computer-vision/#sthash.b1miJmj3.dpbs
[6] Roqueiro, Petrushin, Counting people using video cameras, Department of Computer Science, University of Illinois at Chicago, Chicago, IL 60607, USA, 2006
[7] Havaei1, Jodoin1, Efficient interactive brain tumor segmentation as within-brain kNN classification. University Sherbrooke, Canada. 2014
[8] Mobileye, Mobileye - Our Vision. 2016 [updated 04/25-2016, cited 25/04-2016]. Avail-able at: http://www.mobileye.com/
[9] Addafruit. How PIRs works. 2016 [updated 19/11-2015, cited 12/05-2016] Available at: https://learn.adafruit.com/pir-passive-infrared-proximity-motion-sensor/how-pirs-work.
[10] Shanker, Lai, Android porting concepts, Electronics Computer Technology (ICECT), 2011 3rd International Conference on, Kanyakumari, 2011, pp. 129-133.
[11] IDC, IDC: Smartphone OS Market Share 2015,2014,2013 and 2012. 2016 [updated 02/05-2016, cited 02/05-2016]. Available at: http://www.idc.com/prodserv/smartphone-os-market-share.jsp
[12] Webopedia, What is API, 2016 [updated 11/05-2016, cited 11/05-2016]. Available at: http://www.webopedia.com/TERM/A/API.html
[13] Abhishek, Megha, Cloud Storage and Retrieval - A User Perspective, Computing and Communication Technologies (WCCCT), 2014 World Congress on, Trichirappalli, 2014, pp. 84-87
[14] Thakker and Kapadia, Image processing on embedded platform Android, Computer, Communication and Control (IC4), 2015 International Conference on, Indore, 2015, pp. 1-6.
[15] Marengoni and Stringhini. High Level Computer Vision using OpenCV. 2011. Uni-versidade Presbiteriana Mackenzie.
[16] Thomas, Ashraf, Lal, Mathew,Jayashree, Security enhancement using motion detec-tion, Signal Processing, Communicadetec-tion, Computing and Networking Technologies (ICSCCN), 2011 International Conference on, Thuckafay, 2011, pp. 552-557.
[17] Wei, Li, Yue. A Foreground-background Segmentation Algorithm for Video Se-quences. Jiangnan University, China. 2015
[18] Nunamaker, Chen, Systems development in information systems research, in Sys-tem Sciences, 1990., Proceedings of the Twenty-Third Annual Hawaii International Conference on , vol.iii, no., pp.631-640 vol.3, 2-5 Jan 1990
[19] Developers.google.com, Drive API for Android. 2016 [updated 16/11-2015, cited 03/03-2016]. Available at: https://developers.google.com/drive/android/
[20] MSDN.Microsoft, Android apps. 2015 [updated 04/03-2015, cited 03/03-2016]. Avail-able at: https://msdn.microsoft.com/en-us/library/office/dn631814.as
[21] Dropbox, Android Core API - Dropbox. 2016 [updated 03/03-2016, cited 03/03-2016 ]. Available at: https://www.dropbox.com/developers-v1/core/start/android. [22] Culjak,Abram, Pribanic, Dzapo,Cifrek, A brief introduction to OpenCV, in MIPRO,
2012 Proceedings of the 35th International Convention , vol., no., pp.1725-1730, 21-25 May 2012
[23] Linfo, BSD license definition, 2005 [updated 22/04-2005, cited 12/05-2016]. Available at: http://www.linfo.org/bsdlicense.html
[24] OpenCV, OpenCV, 2016 [updated 13/05-2016, cited 13/05-2016]. Available at: http://www.opencv.org [Accessed 2016-05-13]
[25] Adrians Rosebreck, Basic motion detection and tracking with Python and OpenCV, 2015 [updated 25/05-2015, cited 13/05-2016]. Available at: http://www.pyimagesearch.com/2015/05/25/basic-motion-detection-and-tracking-with-python-and-opencv/.
[26] Power, Schoonees. Understanding background mixture models for foreground seg-mentation. In Proceedings Image and Vision Computing New Zealand, pages 267–271, 2002.
Appendix A
This appendix shows the requirements that needed to be fulfilled for the application. • The application must be created for Android OS
• The hardware used to detect the presence of people must be a Sony Xperia M4 Aqua with a 5 Mega pixels (MP) 720p camera resolution.
• The application should be able to decide if there are people in the room or not • The application should take images at a given interval
• The acquired images should be uploaded to a cloud storage service and labeled with a relevant tag that describes the image content.