Southern Swedish Forest Research Centre
Investigation of constitutive phloem phenolics
in European ash (Fraxinus excelsior) with
different phenotypic susceptibility to ash
dieback.
Undersökning av konstitutiva fenoler i floem från ask (Fraxinus
excelsior) med olika mottaglighet för askskottsjuka
Hjalmar Holm
Master thesis • 30 credits
JägmästarprogrammetMaster Thesis no. 311 Alnarp 2019
Investigation of constitutive phloem phenolics in European ash
(Fraxinus excelsior) with different phenotypic susceptibility to ash
dieback.
Undersökning av konstitutiva fenoler i floem från ask (Fraxinus excelsior) med olika mottaglighet för askskottsjuka
Hjalmar Holm
Supervisor: Michelle Cleary, SLU, Southern Swedish Forest Research Centre
Assistant supervisor: Mohammed Elsafy, SLU, Southern Swedish Forest Research Centre
Examiner: Per Christer Oden, SLU, Southern Swedish Forest Research Centre
Credits: 30 credits
Level: Second cycle, A2E
Course title: Master thesis in Forest Science
Course code: EX0929
Programme/education: Jägmästarprogrammet
Course coordinating department: Southern Swedish Forest Research Centre
Place of publication: Alnarp
Year of publication: 2019
Cover picture: Hjalmar Holm
Online publication: https://stud.epsilon.slu.se
Keywords: ash, Fraxinus excelsior, dieback, Hymenoscyphus fraxineus,
phenolics, secondary metabolites
Swedish University of Agricultural Sciences Faculty of Forest Sciences
3
Abstract
European Ash (Fraxinus excelsior) is an important species for biodiversity through-out Europe. The species is critically threatened due to an alien invasive fungus, Hymenoscyphus fraxineus. Some individual F. excelsior trees however show better resistance to H. fraxineus giving hope that the population can be saved. The under-lying mechanisms associated with this resistance however are still not clear. In ear-lier work, chemotypes could be clearly distinguished between susceptible and re-sistant ash trees.
The aim of this thesis is to investigate the quantitative and qualitative differences in ash constitutive phenolics that may in part explain the observed resistance in some ash trees. Ash trees of known susceptibility to H. fraxineus from five different European countries were sampled for stem phloem tissue and phenolics were ex-tracted in a butylated hydroxyanisole methanol solution. Chemical analysis using Time-of-Flight Mass spectrometry reveals significant differences in levels of several phenolic compounds, foremost the coumarin fraxin and the secoiridoid ligustroside, which is more prevalent in trees resistant to H. fraxineus than in susceptible ones. Fraxin is also more abundant in the resistant natural host of H. fraxineus, F. mands-hurica, than in susceptible species, such as F. excelsior. This study may help in advancing breeding efforts by identifying potential biomarkers that are associated with resistance.
Keywords: ash, Fraxinus excelsior, dieback, Hymenoscyphus fraxineus, phenolics, secondary metabolites
4
Asken (Fraxinus excelsior) är ett viktigt träd för biodiversitet inom stora delar av Europa. Arten är nu hotad av en invasiv sjukdomsbringande svamp, Hymenoscyp-hus fraxineus. Vissa askträdsindivider visar på en bättre resistens mot H. fraxineus, vilket inger hopp för att kunna rädda arten. De underliggande mekanismerna för denna resistans är emellertid inte fullt ut förstådd än, men i tidigare arbeten har man kunnat särskilja kemotyper mellan mottagliga och resistanta askar.
Syftet med denna studie är att undersöka de kvantitativa och kvalitativa skillna-derna i sammansättningen av askens konstitutiva fenoler, vilka till dels förmodas kunna förklara den observerade resistansen hos vissa askträd. Floemprover togs från kvistar på askar av känd känslighetsgrad till H. Fraxineus från fem europeiska länder och fenoler extraherades i en butylerad hydroxyanosol-metanol-lösning. Ke-misk analys med hjälp av tidsflykts-masspektrometer (en. Time-of-Flight) visade på signifikanta skillnader i nivåer av flertalet fenoler, företrädesvis kumarinen fraxin och secoiridoiden ligustrosid, som finns i betydligt större mängd i askar resistenta mot H. Fraxineus än i mer mottagliga artfränder. Fraxin förekommer också i högre nivåer i patogenen H. Fraxineus’ naturliga, och resistanta, värdart, manchurisk ask, F. mandshurica, än i mottaglia arter, såsom F. excelsior. I och med denna upptäckt ter sig försöken att genom förädlingsarbete för resistans rädda asken som ekologiskt och ekonomiskt funktionell art som mer hoppfulla.
Nyckelord: ask, Fraxinus excelsior, askskottsjuka, Hymenoscyphus fraxineus, feno-ler, försvarsämnen
5
Abbreviations 7
1 Introduction 9
Ash as an important species for biodiversity, culture and economy 9
Invasion history 12
Biology of Hymenoscyphus fraxineus 13
Disease control 16
Resistance as a genotypical trait 17
True resistance, or disease escape? 18
Constitutive phenolic compounds as a possible trait of resistance 19
2 Aim 22
3 Materials and Methods 23
Plant Material 23
On the choices of stem phloem over leaf material 24
Phenolics extraction 24
Chemical analysis 25
3.4.1 Metabolomics on phenolic compounds in ash tree phloem extracts by
LC-MS/Q-TOF 25 Statistical analysis 26 4 Result 27 5 Discussion 39 On the findings 39 5.1.1 Compounds found 39
5.1.2 Principal components analysis 41
Parallels and comparisons with earlier studies etc. 41
Limitations 44
6
Considering future research 45
Conclusions 46
References 47
Acknowledgements 59
7
ADB Ash dieback
DNA deoxyribonucleic acid EAB Emerald Ash Borer: FT-IR Fourier transform infrared
HPLC High Pressure Liquid Chromatography m/z Mass per charge ratio
OTU Operational taxonomic unit (e.g. species) SIMCA Soft Independent Modelling of Class Analogies
9
Ash as an important species for biodiversity, culture
and economy
European ash, also known as Common Ash (Fraxinus excelsior), is se-verely declining throughout most of its European range (figure 1); from France and Britain (Webber and Hendry, 2012; Husson et al., 2011) in the west to Romania, Belarus and western Russia (Chira et al., 2017; Musolin
et al., 2017) in the east, and from Norway (Timmermann et al., 2017) in the
north to central Italy in the south (Luchi et al., 2016). The epidemic, known as ash dieback (ADB), is thought to have started around the early 1990’s and was first observed in Poland (Kowalski, 2006) but is now affecting most European countries. There is concern about the very survival of the ash as such, and hence European Ash is updated as Near Threatened (NT) on the IUCN Red List (Khela and Oldfield, 2018) and as Endangered (EN) on the Swedish national red list (Artdatabanken, 2015). The mortality is high, for example Vacek et al. (2015) described a mortality of 2,7 % per year in trials in the Czech Republic, while Lõhmus and Runnel (2014) observed a close to 15 % mortality per year in a case study in Estonia. An average annual mortality of around 9 % is observed in Lithuania (Pliūra et al., 2017), and 7 % in Sweden (Stener, 2018). The natural regeneration is also severely threatened; ash is being replaced by other species, such as birch (Betula
spp.) and grey alder (Alnus incana) after clear cuts of previous ash stands
due to extraordinary poor performance of ash seedlings under infection pressure of H. fraxineus (Lygis et al., 2014).
10
Figure 1. The distribution of Fraxinus excelsior, EUFORGEN 2009, www.euforgen.org.
Ash is considered a keystone species, i.e. it is important to many other species, and has a proportionately high importance for biodiversity (Pau-tasso et al., 2013a) even in countries where it is rare, such as Sweden (Skogsdata, 2017), where 483 species were found to be associated with ash, and of them 112 had ash as preferred host and 52 were entirely de-pendent upon ash. In all at least 115 species are at high risk of co-extinc-tion in Sweden, if ash funcco-extinc-tionally disappears, and addico-extinc-tionally 111 species are at an intermediate extinction risk (Hultberg et al., 2019). Corresponding data for the UK is at least 955 species associated with ash (Mitchell et al., 2017). These figures are likely to be gross underestimates, as for example microfungi are comparatively little studied and poorly understood. In a study of the mycobiome of ash in Sweden (Agostinelli, 2018), the micro-fungi composition was qualitatively partly different between highly suscepti-ble and more resistant trees, suggesting that breeding towards resistance to H. fraxineus will likely disfavour microfungi associated with susceptible trees. Susceptible trees also typically had fewer symbiotroph and relatively more patho- and saprotroph OTUs (operational taxonomic units, that is presumably species) than intermediate and resistant trees. However, only 40 % of the OTUs were assigned a trophic level (1660 of these exclusive to ash); a clear indication of our poor knowledge in that field (Agostinelli, 2018).
11 Figure 2. A healthy, resistant ash surrounded by many susceptible ash trees at the Snoge-holm seed orchard. Photo: Hjalmar Holm.
Many species of epiphytic lichens that are specialized on old trees rely on F. excelsior as their preferred substrate (Marmor et al., 2017), and are already under threat due to habitat fragmentation and loss, and over all low population sizes. The rapid loss of host trees may well contribute to regional extinction , due to their inherent slow recolonization rates (Lõhmus and Run-nel, 2014). In an Estonian study, F. excelsior was found to be the tree spe-cies with most red-listed epiphytic lichens, and even though most of them could live on other species (Quercus robur, Acer platanoides, Ulmus glabra,
12
and potentially Populus tremula) these are regionally not common enough to fully compensate as habitat (Marmor et al., 2017). This is in line with Hult-berg et al.(2019), who found the main alternative host for ash-associated to be Ulmus spp, but since that tree is rare due to Dutch elm disease, conser-vation plans cannot depend upon it. Quercus spp., Fagus sylvativa, Populus
tremula and Acer spp. are capable of supporting > 95 % of the
ash-associ-ated species in Sweden; however, they are all quite rare, (together < 4 % of standing timber volume in Sweden)(Skogsdata, 2017).
There has been doubt whether the ash dieback is a net threat to biodi-versity, as there can be positive effects as well, especially if management is influenced by conservational goals rather than mainstream forestry goals. This includes a rapid increase of much needed dead wood and open glades in European forests (Heilmann-Clausen,Bruun and Ejrnæs, 2013). How-ever, as Pautasso et al. (2013b) point out, these effects will be only temporal (as ash recruitment is affected) and Europe has already few tree species compared to Asia and North America, F. excelsior mainly occurs shattered in the landscape and glades will shortly be filled by other tree species, which typically form a denser canopy, yielding a darker understory. In all, the ash dieback epidemic is likely to result in less diverse forests (Pautasso et al., 2013b), agricultural margins and urban nature (Pautasso et al., 2013a).
Ash is an important species even outside forests, especially in margins in the agricultural landscape (Orłowski and Nowak, 2007). Pollarding of ash trees was once a widespread practice in Europe (Petit and Watkins, 2003) and pollarded ashes are important for epiphyte richness in western Norway (Moe and Botnen, 1997). Predominantly old pollarded ash trees are still pre-sent in several countries, being features of past agricultural practices and considered important bearers of culture and biodiversity (Anon, 2007; Jans-son et al., 2017; Sebek et al., 2013).
Invasion history
The overshadowing cause of this widespread population decline is
Hy-menoscyphus fraxineus (formerly Hymenoscyphus pseudoalbidus
(Baral,Queloz and Hosoya, 2014)), also called Chalara fraxinea primarily for its asexual anamorphic stage (Kowalski, 2006; Kowalski and Holdenrieder, 2009; Queloz et al., 2011). The fungus originates from Eastern Asia, where it behaves primarily as an endophyte and saprophyte of leaves of East Asian
13
species of the Fraxinus genus, such as Manchurian Ash (F. mandshurica) and Chinese Ash (Fraxinus chinensis) (Gross and Han, 2015). Thus, it is not pathogenic to native Fraxinus species within its native range (Zhao et al., 2012; Cleary et al., 2016). In Europe. H. fraxineus is severely pathogenic on at least Fraxinus excelsior and F. angustifolia (Kádasi-Horáková et al., 2017), with which it lacks co-evolutionary history, which is thought to be true also for F. ornus, on which H. fraxineus can complete its life cycle, but only seem to cause relatively mild symptoms (Kirisits, 2017). Its infectious capac-ity and rapid spread have now made it quite famous in terms of invasive alien species worldwide. At the moment it is confined to Europe and Asia but poses a risk to other ash around the world especially in North America if it were to ever establish there. The natural range of the native Fraxinus host (and presumptively the fungus itself) is between E100º and E146º, and be-tween N30º and N53º, encompassing Russian Far East, northern Japan, northern Korea, and most of China (Yihong, 1995).
Biology of Hymenoscyphus fraxineus
In its native range H. fraxineus has a similar ecological role as H. albidus, a closely related species native to Europe which also grows in Fraxinus spe-cies but is not pathogenic to F. excelsior (Baral and Bemmann, 2014; Kow-alski,Bilański and Holdenrieder, 2015; Husson et al., 2011). These days, H.
albidus has been mainly replaced by H. fraxineus (McKinney et al., 2012a),
because they occupy the same ecological niche and because H. fraxineus is more competitive than H. albidus (Kirisits,Dämple and Kräutler, 2013; Hi-etala et al., 2018). Morphologically they are so similar that one needs mi-croscopy to discern the one from the other (Baral and Bemmann, 2014). The life cycle of both H. species is centred around the decomposition of se-nesced leaves, i.e. leaf litter on the forest floor.
Hymenoscyphus fraxineus infects ash leaves via ascospores during the summer and decomposes leaves after they have fallen in the autumn (Baral and Bemmann, 2014), taking advantage of being already established in the leaf before senescence. During the following growth season, the fungus forms a black pseudosclerotial plate (see figure 5.) on the leaf rachis, by which time the leaf blades are disjoint, and white apothecia are formed in
14
mid-summer which produce and disperse ascospores (Kowalski and Hold-enrieder, 2009; Baral and Bemmann, 2014).
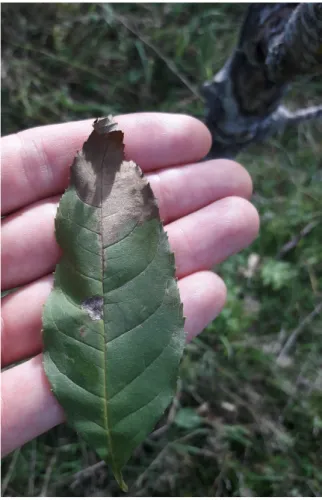
Figure 3. A newly infected leaflet. Notice the partial discoloration. Photo: Hjalmar Holm.
The ascospores adhere to the surface of ash leaves, which they are able to penetrate after germination by forming an appressorium at the tip of their germination tube, possibly supported by improving its adherence to the leaf surface by extracellular mucilage (Cleary,Daniel and Stenlid, 2013b). Given the observed sporulation peak in mid to late summer (Hietala et al., 2018), it is speculated that H. fraxineus in its natural range (and natural hosts) has an endophytic or dormant stage until leaf senescence (Cleary et al., 2016), but on susceptible species such as F. excelsior, H. fraxineus grows directly (Hietala et al., 2013), and causes necrosis in the leaf (figure 3) and thereby acting as a pathogen. It is also capable of spreading down the rachises to
15
the stem phloem and xylem (Schumacher,Kehr and Leonhard, 2009), caus-ing necrosis, cankers (figure 4), and on small to medium sized stems and branches girdling, causing eventual wilting of shoots and dieback of the crown (Kowalski and Holdenrieder, 2009; Cleary,Daniel and Stenlid, 2013b; Bakys et al., 2009). The fungus even infects the seeds to a certain extent (Cleary et al., 2013a), and the base of the trees causing basal lesions, in a French study 33 % of inspected trees were affected this way (Husson et al., 2012). The basal lesions are visually similar to Phytophtora-caused lesions, but Husson et al. (2012) found no Phytophtora on such lesions. Armillaria was however common in that same study, but only in combination with H.
fraxineus, leading the authors to the conclusion that Armillaria plays a minor
role in the dieback and attacks mainly trees already weakened by H.
ineus (Husson et al., 2012). The significance of basal lesions for the H. frax-ineus pathology is a topic of ongoing research (Marçais et al., 2017).
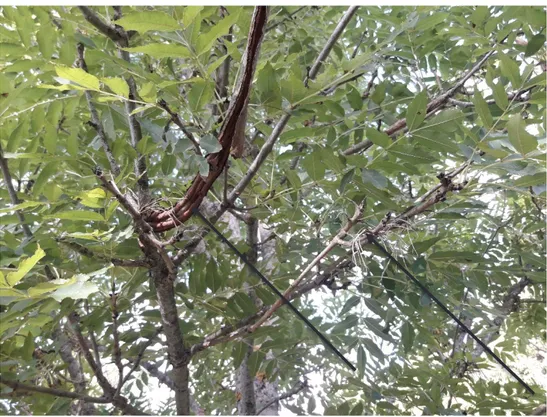
Figure 4. Stem lesions, dead twigs and dead rachises on a resistant tree. Indicated by arrows. All F. excelsior trees can get infected by H. fraxineus, but some, like this one, can successfully resist the pathogen and compensate for the loss. Photo: Hjalmar Holm
16
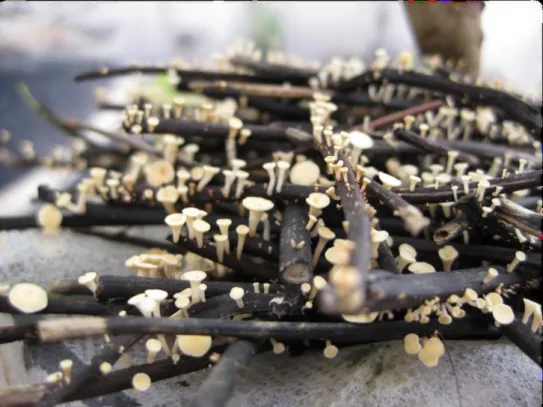
Figure 5. Fruiting bodies of Hymenoscyphus fraxineus on last-year ash leaf rachises (with the leaflets detached) with the typical black pseudosclerotial plate produced by H. fraxineus. Photo: M. Cleary, Hietala & Solheim 2011, EPPO Bulletin.
Disease control
There has been quite varied opinion and research on how to control the disease. This has included assessments of the possible prolonging individ-ual tree lifespans by pruning (Marciulyniene et al., 2017). In that study, the spread of the fungus in infected trees can be pathologically pruned away by cutting the branches at least 30 cm from visible edge of the stem lesion. The effect of pollarding has also been assessed (Bengtsson,Stenström and Finnsberg, 2013), but the effect of continuing pollard practices has not shown to alter infection rates or disease severity (Bengtsson, 2016). The possibility to heat treat seedlings is promising (Hauptman et al., 2013), as
H. fraxineus has optimal growth between c. 15° to 25 C° and temperatures of 36° C and higher are lethal for the pathogen. This may well limit the dis-ease severity in the warmest regions of ash distribution (Grosdidier,Ioos and Marçais, 2018). Chemical treatment has also been tried and potassium phosphite appeared to limit the growth of H. fraxineus, at least in vitro
17
(Tkaczyk et al., 2017). While some of these findings may be feasible in urban locations, special protected sites and nurseries, it is doubtful that any of them provide a long-term sustainable solution for ash as a forest tree in most of its distribution range. More promising in this regard is the discovery of ge-netic resistance against the pathogen (Lobo et al., 2014; Stener, 2018).
Resistance as a genotypical trait
There is high genotypic variation in disease susceptibility to H. fraxineus, and one can often find relatively healthy trees growing next to severely dis-eased trees, see for example Stener (2018). This variation in susceptibility is to a significant degree genetically correlated. While virtually no genotypes are completely resistant (all of them are affected to some degree), a small portion of the genotypes remain relatively healthy even when exposed to high infection pressure. In clonal seed orchards and progeny trials, this is demonstrated to be an inheritable trait (Pliūra et al., 2011; McKinney et al., 2011; Lobo et al., 2014; Stener, 2018, 2013), but a recent (Wohlmuth,Heinze and Essl, 2018) study found no correlation between damage severity of parent trees and that of their offspring in naturally regenerated stands, sug-gesting that there is currently no significant in situ natural selection for highly resistant ash trees, at least not in those stands. However, this can in part be due to absence of trees with sufficiently high resistance in those sites, and to the low detection rate of parent trees of saplings, making heredity difficult to assess. While Pliūra et al. (2011) also found significant variation in sus-ceptibility between provenances, the Lithuanian trees generally had higher vitality after exposure to H. fraxineus than ash trees originating from other European countries. Other studies that confirm genotypic resistance on an individual level, have found weak or no difference in resistance between stands (Stener, 2018; Wohlmuth,Heinze and Essl, 2018). There is no evi-dence that the variation in provenance resistance mentioned above stems from a decreased virulence of H. fraxineus in its older populations in Europe, as the virulence is found to be virtually the same in Lithuania (among the first countries where pathogen outbreak occurred) and Switzerland (a more recently established population) (Lygis et al., 2017); a finding that is rein-forced by a genetic study of the pathogen in those same countries two years prior (Burokiene et al., 2015). The genetic variation in both sub-populations and the metapopulation is relatively high, albeit with few alleles, and similar in the two distant parts of the range of the pathogen, which can be explained
18
by natural wind dispersal of the genetic variation present in the early inva-sion stages in Poland and Lithuania and sexual rather than clonal reproduc-tion (Burokiene et al., 2015). This largely confirms an earlier study with iso-lates from Finland, Estonia and Latvia, which revealed a surprisingly large genetic variation (e.g. with 14 haplotypes out of 32 isolates) compared to other alien invasive pathogens (Rytkönen et al., 2011). According to theories of co-evolution, there is a pressure towards optimal virulence (Dybdahl and Storfer, 2003), so that trait doesn’t affect the overall fitness of the parasite too negatively; obviously it does not promote pathogen fitness to drive the host extinct, and a lowered virulence would be beneficial for the pathogen in this case. However, no such trend can be seen for H. fraxineus in Europe as of this date. F. excelsior is wind pollinated and has a complicated gender system, with individual flowers, inflorescences and trees on a continuum from male to female. In practice, F. excelsior trees tend to lean heavily to-wards either male or female gender, and even though there is a significant proportion of true hermaphrodite trees, pollen from male flowers is more vital than pollen from hermaphrodite ditto and combined with the potential for sexual competition to the ovary, which reinforces the dioecious tendency (Tal, 2006; Wallander, 2001), probably limiting self-pollination and increas-ing genetic recombination. Even in relatively isolated stands the proportion of saplings with parent trees from outside the stands can be high, suggesting a range of at least a few hundred meters of pollen and seed dispersal (Wohlmuth,Heinze and Essl, 2018; Beatty et al., 2015). This is hopeful for potential ash recolonization in the future.
True resistance, or disease escape?
The resistance to ash dieback seems to be partly phenologically induced; Nielsen et al. (2017) found that seedlings which had begun flushing when inoculated with H. fraxineus developed less severe symptoms than seed-lings which had not begun flushing when inoculated. This adds to the obser-vations from the trials described by McKinney et al. (2011), who like Stener (2018) also found a correlation between early leaf senescence and dieback resistance. It has therefore been speculated that the lower susceptibility might be due to disease escape (McKinney et al., 2011), but this is contra-dicted by both a Norwegian (Hietala et al., 2013) study of H. fraxineus spor-ulation in an infected ash stand, where both spore spread in the stand and
19
ash leaves reached a high plateau well before leaf senescence, and a Dan-ish study (McKinney et al., 2012b), where resistant genotypes developed shorter lesions after H. fraxineus inoculation than did susceptible genotypes; an indication that an active defence is limiting the growth of the pathogen. Additionally, resistant genotypes show higher tolerance to viridiol (Cleary et
al., 2014), a long known fungal phytotoxin (Jones,Lanini and Hancock,
1988), proven to be produced also by H. fraxineus and causing discolouring and necrosis on ash leaves (Andersson et al., 2010). Still, the mechanisms behind phenological and genotypical resistance remain largely unknown.
Constitutive phenolic compounds as a possible trait of
resistance
Phenolics are long-known to be part of tree defence against pathogen fungi (Kemp and Burden, 1986), and Fraxinus species, such as F. excelsior, have a wide range of bioactive phenolic compounds (Kostova and Iossifova, 2007). Defence chemicals, such as antifungal phytochemicals, can be pro-duced both constitutively, that is, prior to infection, and inpro-duced in response to damage to the tissue either by mechanical (abiotic) means or by a biotic agent. Some responses therefore may be entirely non-specific but in some cases, defences can be pathogen specific (Nicholson and Wood, 2001; Lat-tanzio,Lattanzio and Cardinali, 2006). Furthermore, defences are present in different parts of the tree: leaf and phloem are probably the most relevant parts concerning H. fraxineus, as these are the tissues primarily affected by this fungus (Cleary,Daniel and Stenlid, 2013b). Phloem, and to some extent xylem, defence chemistry in Fraxinus species is subject to much research in response to Emerald Ash Borer (EAB, Agrilus planipennis), an invasive pest on Fraxinus species in North America (Eyles et al., 2007; Villari et al., 2016). The native range and hosts of EAB are similar to H. fraxineus, namely East Asia and F. mandshurica and F. chinensis (Liu et al., 2003), in its native range in east Asia which make them particularly interesting to study. Thus, research on defensive phytochemicals and their roles in F. mandshurica can be of value in search of understanding resistance to H. fraxineus in Euro-pean Fraxinus species as well.
20
Figure 6. The chemical structure of the phenol, the simplest of the phenolics. A phenolic is a compound with a hydroxyl group bonded directly to an aromatic hydrocarbon group. Source: NEUROtiker [Public domain], Wikimedia Commons, 2007.
In a recent study, Villari et al. (2018) successfully demonstrated that of using a chemical finger-printing technique involving Fourier transform infrared (FT-IR) spectroscopy could identify resistant phenotypes. In that study, spectro-scopic analysis of phenolic extracts from phloem samples of uninfected trees representing different disease phenotypes (i.e. highly susceptible and highly resistant to H. fraxineus) across Europe, combined with chemometric statistics (employing soft independent modelling of class analogy; SIMCA) on chemical fingerprints (spectra of all metabolites), they were able to accu-rately discriminate between resistant and susceptible genotypes, see figure 6.
21 Figure 7. SIMCA Coomans plot of the samples used to verify the 3-factor model used in Villari et al. (2018). The distance between the sample is relative and dimension free. Notice how the resistant trees (red dots) are separated from the susceptible trees (blue dots) by the the critical sample residual thresholds,indicated by dashed lines. The green dots indicate inter-mediate trees, which were not used in this study. Figure replicated by kind permission of the authors (Villari et al. 2018).
This result strongly supports the idea that resistance is linked to constitutive phenolic composition (Villari et al., 2018). While the FT-IR phenotyping technique has shown large promise to be able to identify resistant trees in the field based on their known chemical spectra associated to that pheno-type, it is still unclear what the chemicals are that are contributing to their resistance. Thus, knowing how individual constitutive phenolics differ quali-tatively and quantiquali-tatively between susceptible and resistant phenotypes used in that study, would provide a deep insight to the mechanisms of de-fence leading to increased resistance to this deadly pathogen and would help to advance efforts towards breeding for resistance (e.g. through marker assisted selection) to prevent European ash from becoming functionally ex-tinct (Gross et al., 2014; Stener, 2018; Pautasso et al., 2013a).
22
The aim of this study is to investigate the qualitative and quantitative differ-ences in constitutive phenolics between genotypes which are resistant and susceptible to H. fraxineus.
3.1.1 Hypotheses
I have two hypotheses: Between the resistant and susceptible phenotypes: 1. there is no qualitative difference in secondary metabolites, and 2. there are quantitative differences in secondary metabolites.
Figure 8. Ash trees displaying different level of damage. The more resistant ones have grown considerably higher since the outbreak of dieback than have the more susceptible ones. Orig-inally trees were standing much denser, but many trees have died and has since been re-moved. Photo: Hjalmar Holm.
23
Plant Material
The material used in this study was based on earlier work that used ad-vanced phenotyping through a chemical fingerprinting technique to discrim-inate between susceptible and resistant phenotypes.
Based on the earlier work from Villari et al. (2018), stem phloem and leaf tissue were collected from trees having known susceptibility towards H.
frax-ineus from genetic trials that had been periodically assessed during several
years in six different countries: Sweden, Denmark, Lithuania, Germany, France and Austria. The locations (field trials) were originally established to test ash provenance (Enderle et al., 2013) or progeny (Muñoz et al., 2016; Pliūra et al., 2011, 2014; Pliūra and Baliuckas, 2007) or established as clonal seed orchards (Kirisits and Freinschlag, 2012; McKinney et al., 2011; Stener, 2013; Heinze et al., 2017), see Table 1. The assessments and sub-sequent collection of genotypes to be included in the advanced phenotyping study were based on previous assessments of disease severity as the extent of crown damage. In total, 76 genotypes were selected representing families with high or low susceptibility. All tissue samples collected were frozen on site and kept at a temperature below -20 C˚ until processing. For further details on the collection process and the processing of the original samples, see Villari et al. (2018). There remained some sample material unused from the study by Villari et al. (2018). Of those, 20 were classified as highly re-sistant and 13 as susceptible, and this subset of samples from Villari et al. (2018) was used for further chemical analysis described below.
24
Table 1. Samples from Villari et al. 2018 used in this study. Country Location Type of trial Sampling
date Resistant genotypes used in this study and in Villari et al. (2018), in pa-renthesis. Susceptible genotypes used in this study and in Villari et al. (2018), in pa-renthesis. Austria Feldkirchen an der Donau Clonal seed orchard 9th of June 6 (7) 7 (7) Denmark Tuse næs Clonal seed
orchard
2nd and 4th of June
1 (3) 2 (3)
France Devecey Provenance
and progeny trial
18th of June 3 (7) 4 (7)
Germany Weisweil Provenance
trial
19th of May 0 (5) 0 (5) Lithuania Sasnava Clonal
collec-tion
2nd of June 3 (5) 0 (4) Sweden Snogeholm Clonal seed
orchard
28th of May 7 (7) 0 (4)
Total number of genotypes 20 (34) 13 (30)
On the choices of stem phloem over leaf material
I had the option of using either stem phloem or leaf samples in my study, but since leaf chemotype has been shown to be heavily affected by geogra-phy (Villari et al., 2018), I opted at using phloem tissue for extracting phe-nolics.
Phenolics extraction
The 33 phloem tissue samples were ground to powder with a mortar and pestle, constantly kept frozen with liquid nitrogen to avoid warming and oxi-dation that would follow with higher temperatures, that could result in the breakdown of the chemical components. Ground phloem tissue was weighed to approximately 100 mg in cold eppendorf tubes. Thereafter the protocol 1. was followed: Butylated hydroxyanisole (BHA) was added to high
25
performance liquid chromatography (HPLC) grade methanol to a concentra-tion of 0.5mg/mL. The extraction was made by adding 500 μL of BHA-HPLC-methanol solution in each sample, after which the tubes were stored at 4 °C in the dark for 48 hours, and then centrifuged at 12,000×g for 5 minutes, separating the solids from the rest of the material to the resulting pellet. The supernatant was transferred to microcentrifuge tubes. This process, from the addition of the BHA to and including transferring the supernatant to micro-centrifuge tubes, was done twice and the supernatants for each sample were pooled and stored in - 20 °C until further analysis. This protocol is sim-ilar to the methods in Villari et al. (2018) and Cipollini et al. (2011). Approxi-mately 500 μL per tube of solvent phloem sample was sent for further anal-ysis.
Chemical analysis
Chemical analysis of samples was done at The Faculty of Science, of Co-penhagen University, using a Liquid Chromatography-Mass -Time-of-Flight spectrometer (LC-MS/Q-TOF), which enables compound identification and quantification. Identification was based on detected fragmentation patterns and mass per charge (m/z) for each individual compound and lists of known compounds.
4.4.1 Metabolomics on phenolic compounds in ash tree phloem extracts by LC-MS/Q-TOF
Samples were diluted 10-fold with milliQ grade water prior to analysis by LC-MS. In order to identify potential differences and products in the plant extracts they were subjected to metabolomics analysis by LC-MS/Q-TOF. Chromatography was performed on a Dionex UltiMate® 3000 Quaternary Rapid Separation UHPLC+ focused system (Thermo Fisher Scientific, Ger-mering, Germany). Separation was achieved on a Kinetex 1.7u XB-C18 col-umn (100 x 2.1 mm, 1.7 µm, 100 Å, Phenomenex, Torrance, CA, USA). For-mic acid in water (0.05%, v/v) and acetonitrile (with 0.05% forFor-mic acid, v/v) were employed as mobile phases A and B, respectively. Gradient condi-tions: 0.0-2.0 min, 2% B; 2.0.-35.0 min, 2-30% B; 35.0-40.0 min 30-40% B, 40.0-47.0 min 40-60% B, 47.0-50.0 min 60-100% B, 50.0-54.0 min 100%
26
B, 54.0-55.0 min 100-2% B and 55.0-60.0 2% B. The mobile phase flow rate was 300 µl min-1. The column temperature was maintained at 30°C. Four wavelengths (250 nm, 260 nm, 275 nm and 290 nm) were monitored by a UV-VIS detector. The liquid chromatography was coupled to a Compact mi-crOTOF-Q mass spectrometer (Bruker, Bremen, Germany) equipped with an electrospray ion source (ESI) operated in positive ionization mode. The ion spray voltage was maintained at -3900 V. Dry temperature was set to 250°C and dry gas flow was set to 8 L min-1. Nebulizing gas was set to 2.5 bar and collision energy to 15 eV. Nitrogen was used as dry gas, nebulizing gas and collision gas. Mass spectra were acquired in the range from 50-1000 m/z for MS and 200-800 m/z for MS/MS. Na+-formate clusters were used as calibrant and injected at the beginning of each run. All files were automatically calibrated based on the compound spectra collected from the Na+-formate clusters. Quality control samples (QC) consisting of a mix of equal aliquots of each individual sample were used to monitor technical var-iation throughout the run sequence. OC samples were injected 5x at the beginning of the sequence to prime the system and after every sixth sample throughout the run sequence. Data acquired from QC samples was used for data normalization.
Detected compounds not identified as previously known were assigned provisional names based on the ordinal of their retention times and the des-ignation NI (Not Identified). Thus, the first detected unknown compound was named NI 01, the second NI 02, etc.
Statistical analysis
Data obtained for phenolics were tested for normality of distribution. Data with normal distribution was tested with Student’s t-test. Data not found to be normally distributed were instead subjected to a non-parametric test; Mann-Whitney’s U-test. Table 3 displays which test was used for which data. The data processing was made in Minitab 18 (Minitab, LLC).
To further investigate how different resistant and susceptible phenotypes were from each other, I conducted a principal components analysis (PCA), which reduces the dimensions in the data set to the two dimensions (in a two-dimensional PCA, which was used in this study) that explains the ob-served variation in the data the most. My assumption was that the analysis would differentiate between susceptible and resistant phenotypes.
27
Chemical analysis of all samples revealed a total of 51 methanol soluble compounds (putatively phenolics), of which 16 were identified. The relations between detected compounds, retention time and ion intensity at each m/z (mass per charge ratio) spectrum were visualized in chromatograms for in-dividual samples, see figure 9 for an example. The ion intensity at each m/z spectrum reflects the amount of each compound, which could be compared between compounds by comparing the peak areas of the peaks in the chro-matograms. The dominant compounds thus identified were fraxin and ligustroside, with on average 19 and 15 % of the total peak area, see figure 10 and table 2.
Nine compounds were detected at intermediate levels (with an average above 2 % of total peak area), together comprising 37 % of the remaining total peak area. In order of descending magnitude, they included esculin, NI15, pinoresinol glucoside, NI 12, a possible oleuropein derivative (NI 32), NI 36, tyrosol hexoside, oleuropein and NI 37.
Of the 11 major compounds in this data set, seven were found at signifi-cantly higher levels in resistant trees (p-values in parenthesis): fraxin (<0.001), ligustroside (0.025), NI 15 (<0.001), pinoresinol glucoside (0.027), NI 32 (0.004), NI 36 (0.001) and NI 37 (0.001). One was found at higher levels in susceptible trees; NI 12 (0.001), whereas the levels of esculin, ty-rosol hexoside and oleuropein were found at similar levels in resistant and susceptible trees.
Resistant trees had both more and higher amounts of secondary metab-olites than susceptible trees. Individual trees of the resistant group had sig-nificantly more detected phenolics than the susceptible (on average 45.65 compounds of 51, compared to 41.15 for susceptible trees, p 0,038). The total level of detected methanol solubles (presumably phenolics) as a class
28
was higher in resistant trees than in susceptible trees (p = 0,002, t = 3,11). Most of the individual phenolic compounds detected (27 of 51) were found at a significantly higher abundance in resistant trees, and only three were found at a lower abundance in resistant trees. See table 3.
Eight compounds, (NI 11, NI 12, fraxin, NI 15, NI 17, NI 20, NI 29 and ligustroside) showed significant differences between resistant and suscepti-ble trees when tested with t-tests. Of those, two of them, NI 11 and NI 12, showed a higher level for susceptible than resistant trees, while six showed a higher level for resistant trees.
For compounds tested with non-parametric methods, NI 4, NI 7, NI 8, NI 9, NI 10, NI 14, NI 18, NI 19, pinoresinol dihexoside, NI 21, NI 23, calceolar-ioside A, pinoresinol glucoside, NI 26, NI 28, NI 30, NI 32, NI 33, NI 36 and NI 37 showed significant differences between susceptible and resistant trees. Of these, only NI 36 had higher levels for susceptible, while all other compounds with significant differences were found in higher levels in re-sistant trees.
All compounds were found in each group (resistant or susceptible), alt-hough in the susceptible group, NI 04 and NI 08 were present in only one and two samples, respectively, and compounds typically found at lower lev-els were more often missing in individuals of either group, than compounds found at higher levels.
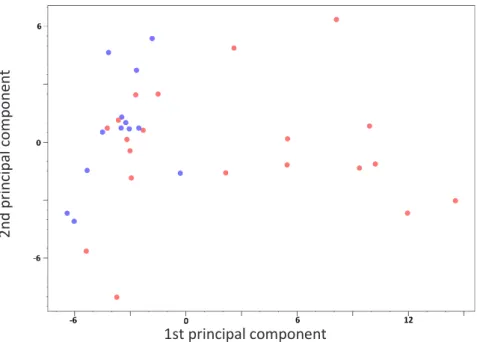
A principal components analysis showed incomplete separation of the resistant and susceptible groups, see figure 11, but instead groups after country of origin, see figure 12.
29 F igur e 9 . R ec o ns tr uc te d t ot a l io n c u rr en t ( R T IC ) c hr o m at o gr am s of t w o s am p le s , r epr e s en ti ng t w o i nd iv idua l tr ee s , one f rom a r es is ta nt t ree ( ab ov e, i n pur pl e ) a nd one f ro m a s us c e pt ibl e ( bel ow , i n gr een) . Th e s e c hr om a togr a m s s how t he i o n int en s it y at eac h poi n t in ti m e , w her e eac h t im e p oi nt i n t ur n re p re s ent s a m as s s pec tr um e ac h. E ac h m aj or pe ak r e pr e s e nt s ( at l ea s t) o ne c om poun d b ut m ay c ont a in s ev er al o ther c om po und s a s w el l, t ho ugh t he c om poun ds h av e been s ub jec ted t o s e par at ion t o av oi d t h is , s ee s ubc hapt er 4. 4. N o ti c e ho w t he upper , pur pl e gr ap h ( rep res en ti ng a r es is ta nt t ree) h a s hi gher am pl it ude s i n ge ner a l. C om par e w it h f ig ur e 1 0 . Ion int ens ity * 1 0 6 Re sis tan t Su sc ep tib le 40 30 Reten tio n ti m e, in m in ut es 10 20
30 F igur e 10 . T he av er ag e p eak ar ea f or a ll d et e c ted c om p oun ds f or r e s is tant t ree s ( red c ol u m ns ) and s us c ept ibl e t re es ( bl ue c ol u m n s ). O n t he y -a x is i s the uni tl e s s pea k ar ea , w hi c h i s c al c ul at ed f ro m t he i o n int e n s it y o f e ac h c om poun d det e c ted a nd r ef lec ts c on c e nt rat ion s of ea c h c o m po und. O n t h e x -ax is ar e al l det ec ted c om poun ds i n or d er by r et e nt ion t im e . De te ct ed co m po un ds Peak are a
31 T abl e 2 . P h eno lic c om po und s det e c ted by LC -MS /Q -T O F f ro m s am pl es . C om pou nd na me 1 R et ent ion ti m e 2 m /z 3 F ragm ent s 4 A v er age pe ak ar ea 5 R el at iv e peak ar ea 6 NI 0 1 5 .1 329. 0 866 165, 1 09, 149 26262 90 0. 43% NI 0 2 6 .2 315. 0 712 152, 1 08, 165, 121 87845 3 0. 15% NI 0 3 6 .7 345. 1 197 313, 1 51, 179, 123 76953 71 1. 27% H y dr o x y ty ros ol hex os ide 7 .0 315. 1 076 135, 1 53, 119, 101 , 11 3, 16 1, 179 65192 04 1. 08% NI 0 4 7 .3 339. 0 711 177, 13 1 11986 89 0. 20% NI 0 5 7 .5 313. 0 917 151, 1 23 94653 3 0. 16% NI 0 6 8 .1 407. 1 545 389, 3 13, 377, 377 , 35 7, 16 1, 345, 1 83, 101 35263 1 0. 06% NI 0 7 8 .4 407. 1 546 389, 3 77, 313, 377 , 35 7, 16 1, 183, 3 45, 101 19416 20 0. 32% NI 0 8 8 .9 491. 1 702 329, 1 79, 119, 161 , 1 01 11544 10 0. 19% T y ros ol hex os ide 9 .1 299. 1 131 119, 1 01, 179, 113 , 16 1, 14 9, 143, 1 37, 131 15633 384 2. 58% E s c u lin 9 .7 339. 0 720 177. 0 46907 054 7. 75% NI 0 9 11. 3 399. 0 918 191, 1 76, 353 89826 0 0. 15% E lenol ic ac id d er iv at iv e 11. 6 565. 1 761 403, 1 79, 223, 265 , 16 1, 11 9, 101, 2 65, 283 37108 68 0. 61% NI 1 0 11. 9 531. 1 340 207, 1 92 10545 63 0. 17% O leos ide 12. 1 389. 1 079 345, 1 83, 121, 209 , 16 5, 11 9, 101 39007 11 0. 64% NI 1 1 12. 2 565. 1 767 72275 94 1. 19% NI 1 2 12. 2 403. 1 238 25944 623 4. 29% NI 1 3 12. 4 241. 0 712 21782 38 0. 36% NI 1 4 12. 9 369. 0 822 207, 1 92, 249 72745 87 1. 20% F ra xi n 13. 4 369. 0 825 207, 1 92, 354 11685 585 8 19. 32 % NI 1 5 14. 2 221. 0 455 206, 1 91 38711 100 6. 40%
32 C om pou nd na me 1 R et ent ion ti m e 2 m /z 3 F ragm ent s 4 A v er age pe ak ar ea 5 R el at iv e peak ar ea 6 NI 1 6 14. 3 369. 0 819 207 95786 90 1. 58% NI 1 7 14. 8 221. 0 453 206, 1 91 56159 35 0. 93% NI 1 8 15. 2 583. 2 027 375, 3 27, 195, 179 13527 27 0. 22% NI 1 9 15. 7 537. 1 963 375, 3 27, 357, 179 , 19 5 26906 58 0. 44% NI 2 0 17. 4 581. 1 863 177, 3 73, 195, 162 19209 72 0. 32% P inor e s in ol d ihex os ide 17. 7 681. 2 405 357, 5 19, 161 82396 73 1. 36% N I 21 7 19. 1 523. 2 168 361. 0 28610 68 0. 47% H y dr o x y pi nor es inol hex os ide 19. 5 535. 1 817 373, 3 43, 211, 313 51860 46 0. 86% N I 22 7 20. 0 555. 1 715 151, 4 03, 223, 179 , 53 7, 29 1, 323, 3 93, 361 72351 61 1. 20% Lar ic ir e s ino l h ex os ide 20. 2 521. 2 015 329, 3 59, 161 32105 55 0. 53% NI 2 3 20. 4 565. 1 910 339, 3 27, 403, 207 , 52 1, 16 1 26054 91 0. 43% NI 2 4 20. 7 507. 1 494 475, 3 41, 161, 179 , 20 3, 32 3, 281, 1 95 66066 84 1. 09% Q uer c et in d igl y c o s ide 20. 9 609. 1 456 301, 1 79, 1 51, 271 58564 52 0. 97% C al c e ol ar ios ide A 21. 3 477. 1 386 161, 1 79, 341, 203 , 13 5, 31 5 91220 24 1. 51% NI 25 22. 0 593. 1 503 285, 1 16 19835 59 0. 33% P iner e s in ol g luc os ide 22. 4 519. 1 870 357, 1 51, 342, 161 , 13 6 33242 395 5. 50% NI 2 6 22. 7 447. 0 921 284 63057 39 1. 04% NI 2 7 23. 2 593. 1 503 285, 3 87, 117 31525 75 0. 52% NI 2 8 23. 3 387. 1 439 181, 1 51 48721 59 0. 81% NI 2 9 23. 6 447. 0 925 285 10419 710 1. 72% NI 3 0 23. 8 477. 1 038 314, 3 57 63131 8 0. 10% NI 3 1 23. 8 623. 1 618 315, 2 06, 117 19263 96 0. 32%
33 C om pou nd na me 1 R et ent ion ti m e 2 m /z 3 F ragm ent s 4 A v er age pe ak ar ea 5 R el at iv e peak ar ea 6 NI 3 2 8 24. 0 539. 1 764 377, 2 91, 275, 101 , 23 9, 17 9, 359, 4 19, 127 21581 371 3. 57% NI 3 3 24. 3 477. 1 034 314, 3 57, 271, 151 20365 31 0. 34% NI 3 4 25. 5 569. 1 872 403, 5 37, 151, 223 , 17 9, 30 5, 375, 3 37 11981 610 1. 98% O leur ope in 26. 1 539. 1 757 377, 2 75, 307, 223 , 17 9, 40 3, 149, 3 45 14178 679 2. 34% NI 3 5 26. 5 337. 1 069 322, 3 06 37657 99 0. 62% NI 3 6 27. 4 569. 1 871 223, 1 37, 385, 205 , 26 5, 16 1, 179, 3 15, 101 16332 756 2. 70% L ig us tr os ide 29. 4 523. 1 818 361, 2 91, 259, 101 , 22 3, 12 7, 179, 93642 604 15. 48 % NI 3 7 30. 0 553. 1 920 321, 3 91, 289, 101 , 22 3, 17 9, 403 13198 703 2. 18% 1P ut a ti v e na m e f or i den ti fi ed phenol ic c o m pound s and pr ov is ional na m e s f or no t i dent if ied ( N I) c o m pou nds . 2T he r et ent ion r im e i n the LC -MS /Q -T O F s pec tr o m et ry 3M as s per c har ge r at io 4F rag m ent s m /z i n or der of de c rea s ing abundanc e 5T he uni tl e s s pea k ar ea, av er aged for a ll s am p les 6T he s har e in per c ent of t he tot al peak ar ea, av er aged f or al l s a m pl es 7Ident if ied in E y le s et al . (2007) . 8A po s s ibl e O leur opei n der iv at e?
34 T abl e 3 . T he r e lat ion s hi p bet w een s us c ep ti bl e an d r e s is tant t rees i n t e rm s of pea k ar e a of d et ec ted c om pou nds . C om pou nd nam e 1 M et hod appl ied 2 D iffe re n c e 3 S igni fi c a nc e ( p -v al u e) 4 NI 0 1 S tudent 's t -t es t - NI 0 2 M ann -W hi tney - NI 0 3 S tudent 's t -t es t - H y dr o x y ty ros ol hex os ide M ann -W hi tney - NI 04 M ann -W hi tney R < 0. 001 NI 0 5 S tudent 's t -t es t - NI 0 6 M ann -W hi tney - NI 0 7 M ann -W hi tney R 0, 047 NI 0 8 M ann -W hi tney R 0. 014, ad jus ted 0 .00 5 T y ros ol hex os ide M ann -W hi tney - E s c u lin S tudent 's t -t es t - NI 0 9 M ann -W hi tney R < 0. 00 1, W 4 34 E lenol ic ac id d er iv at iv e S tudent 's t -t es t - NI 1 0 M ann -W hi tney R < 0 .0 0 1, W 435 O leos ide M ann -W hi tney - NI 1 1 S tudent 's t -t es t S 0. 001, t -3. 54 NI 1 2 S tudent 's t -t es t S < 0 .0 0 1 , t -3. 85 NI 1 3 S tudent 's t -t es t - NI 1 4 M ann -W hi tney R 0. 021 , W 3 96 F ra xi n S tudent 's t -t es t R < 0 .0 0 1 , t 3 .7 9 NI 1 5 S tudent 's t -t es t R < 0, 00 1 t 4 .47
35 C om pou nd nam e 1 M et hod appl ied 2 D iffe re n c e 3 S igni fi c a nc e ( p -v al u e) 4 NI 1 6 S tudent 's t -t es t - NI 1 7 S tudent 's t -t es t R < 0 .0 0 1 , t 4 .4 4 NI 1 8 M ann -W hi tney R 0. 003, W 4 15 NI 1 9 M ann -W hi tney R 0. 002, W 4 2 0 NI 2 0 S tudent 's t -t es t R 0. 013, t 2. 37 P inor e s in ol d ihex os ide M ann -W hi tney R 0. 009, W 4 0 5 N I 21 5 M ann -W hi tney R 0. 041, W 3 8 8 H y dr o x y pi nor es inol hex os ide S tudent 's t -t es t - N I 22 5 M ann -W hi tney - Lar ic ir e s ino l h ex os ide M ann -W hi tney - NI 2 3 M ann -W hi tney R 0. 002, W 4 19 NI 2 4 M ann -W hi tney - Q uer c et in d igl y c o s ide M ann -W hi tney - C al c e ol ar ios ide A M ann -W hi tney R 0. 010, W 4 01 NI 2 5 M ann -W hi tney - P iner e s in ol g luc os ide M ann -W hi tney R 0. 027, W 3 9 3 NI 2 6 M ann -W hi tney R 0. 043, W 3 8 7 NI 2 7 M ann -W hi tney - NI 2 8 M ann -W hi tney R 0. 001, W 4 2 7 NI 29 S tudent 's t -t es t R 0. 008, t 2. 57 NI 3 0 M ann -W hi tney R 0. 036 W 3 8 8 NI 3 1 M ann -W hi tney - N I 32 6 M ann -W hi tney R 0. 004, W 4 12
36 C om pou nd nam e 1 M et hod appl ied 2 D iffe re n c e 3 S igni fi c a nc e ( p -v al u e) 4 NI 3 3 M ann -W hi tney R 0. 009, W 40 5 NI 3 4 M ann -W hi tney - O leur ope in M ann -W hi tney - NI 3 5 S tudent 's t -t es t - NI 3 6 M ann -W hi tney S 0. 001, W 2 57 L ig us tr os ide S tudent 's t -t es t R 0. 025, t 2. 04 NI 3 7 M ann -W hi tney R 0. 001, W 4 17 T ot al det e c te d m et ha nol s o lubl es 7 S tudent ’s t -t es t R 0. 002, t 3. 11 1Na m e s a s per t abl e 2. 2T he m e thod c hos en depended o n the nor m al it y o f dat a di s tr ibut ion. S tuden t’ s t -t es t w as u s ed for dat a w it h nor m a l di s tr ibu ti on, and M ann -W hi tney f or dat a w it h non -nor m al di s tr ibut ion . 3T he di ff er enc e be tw een r es is tant and s us c ept ibl e genot y pes . “ R ” de not es t hat t he c o m pound w as f oun d i n hi gher a m oun ts i n r e s is tant ge not y pes c o m par ed to s us c ept i-bl e ones , and “S ” denot es t ha t the oppos it e s it uat ion w as f ound. N o s igni fi c ant di ff er en c e bet w een r es is tant and s us c ept ib le t ree s i s denot ed by “ -“ . 4T he s igni fi c anc e of t he t e s ts de s c ri bed w it h t he p -v al ues . 5A ls o det e c ted i n E y les et al . (2007) . 6A po s s ibl e O leur opei n der iv at e? 7T he t o tal a m ount ( in t er m s of pea k ar ea) of al l det e c ted phenol ic c o m pound s c o m bi ned .
37 Figure 11. Principal component analysis plot with samples from the resistant trees indicated by red dots, and samples from susceptible trees by blue dots. The two groups overlap.
Figure 12. Principal components analysis plot with the same data as in figure 11 but with dots coloured according to country of origin of the corresponding samples. Blue = Austria, teal = Denmark, green = France, pink = Lithuania and red = Sweden
2n d prin cip al co m po ne nt 2n d prin cip al co m po ne nt 1st principal component 1st principal component
38
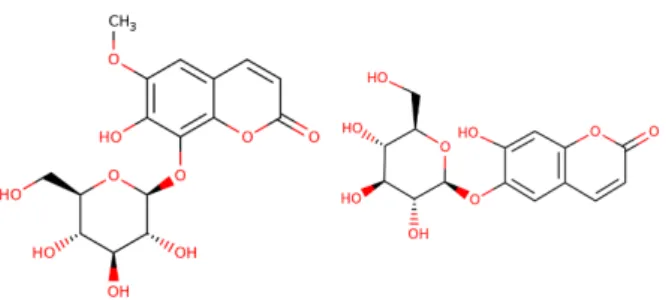
Figure 13. The chemical structure of fraxin (to the left) and esculin (to the right). Source: Toxnet, U.S. National Library of Medicine, 2019. https://chem.nlm.nih.gov/chemidplus/
Figure 14. The chemical structure of ligustroside (to the left) and oleuropein (to the right).
Source: Toxnet, U.S. National Library of Medicine, 2019.
https://chem.nlm.nih.gov/chemidplus/
Figure 15. The chemical structure of calceolarioside a. Source: Toxnet, U.S. National Library of Medicine, 2019. https://chem.nlm.nih.gov/chemidplus/
39
In this study I investigated the qualitative and quantitative differences in constitutive phenolics in different genotypes of Fraxinus excelsior which are resistant and susceptible to Hymenoscyphus fraxineus in order to improve our understanding of the mechanisms of genetic resistance to H. fraxineus.
On the findings
I found that the levels of fraxin and ligustroside, among several other phe-nolics, were significantly higher in resistant genotypes than in susceptible ones.
6.1.1 Compounds found
Fraxin, a glucoside of fraxetin, and esculin, a glycoside of esculetin, de-scribed for example by Kostova and Iossifova (2007), are members of the coumarin group and are well known prevalent phytochemicals in stem phloem in Fraxinus species (Iossifova,Kostova and Evstatieva, 1997) (as well as in several other species, such as in Aesculus hippocastanum (Stanić,Jurišić and Brkić, 1999)), and are often discussed together in scien-tific literature. Also in this study both were found at high levels, but only fraxin was found at different levels in resistant and susceptible genotypes. Fraxin is of interest in modern day medicine e.g. for its ability to protect human cells from oxidative stress (Whang et al., 2005) and both have been used in tra-ditional medicine (Li et al., 2005; Chen et al., 2017). Coumarins are in gen-eral of great interest for medical research, but their function in the plants from which they originate is less studied (Martins Borges et al., 2008). Ios-sifova et al. (1994) found the antimicrobial activity of both fraxin and esculin
40
to be limited, although their aglucones fraxetin and esculetin were found to be potent against bacteria (Staphylucoccus aureus and Escherichia coli). Similarly,Mercer et al. (2013) found fraxetin and esculetin to have an anti-fungal effect against human dermatophytes, but their glucones were devoid of antifungal effect. Perhaps the presence of the glucones can still be im-portant, for example for rapid synthetization of their respective aglucones through hydrolysis.
Ligustroside, also known as ligstroside, is described e.g. in Iossifova, Mi-khova and Kostova (1993) and is a secoiridoid glucoside with antimicrobial activity (Iossifova et al., 1994) and a direct precursor of oleuropein (see for example Soler-Riveras, Espín and Wichers (2000)), a prevalent compound in olives (Omar, 2010). Interestingly, the levels of oleuropein were similar in resistant and susceptible trees, whereas the levels of the precursory ligustroside differed significantly. It is thus possible that the role of ligustro-side, if it plays a part in defence against H. fraxineus, is either direct or indi-rect, that is, that oleuropein may be the active part in defence but that the synthesis of sufficient levels of oleuropein to resist the pathogen during in-fection is dependent on a high reservoir of ligustroside.
I found four lignans, the largest group of identified compound in this study, but not one with great amplitude, which seems to be in accordance with earlier investigations (Kostova and Iossifova, 2007). This group is known to have antifungal (and antibacterial) activity, for example pinoresinol and lariciresinol (Céspedes et al., 2006), which are related to all four lignans identified in this study.
The phenylethanoid glycoside calceolarioside A, (also known as desrhamnosyl acetoside) described for example by Kostova and Iossifova (2007), was also found at higher amounts in resistant than in susceptible trees, and it possesses antimicrobial activity (Shoyama,Matsumoto and Nishioka, 1986). Although found only at relatively low levels even, it may still contribute to resistance.
The remaining identified compounds (oleoside, tyrosol hexoside, hydrox-ytyrosol hexoside and quercetin diglycoside) were found at low levels in both resistant and susceptible trees with no significant differences
41
6.1.2 Principal components analysis
The principal components analysis (figures 11 and 12) did not show a com-plete separation between resistant and susceptible genotypes, but to some extent indicate a relationship between samples dependent on geography and phylogenetics. The Austrian samples grouped mid-left and the French and Danish forming a loose cluster around the Austrian, representing the Central European population and the Swedish and Lithuanian, representing the Eastern European population, are scattered and mostly to the right. This is in line with research on F. excelsior phylogenetics and post glacial recol-onization routes, (Heuertz et al., 2004). However, this relationship was not expected in the PCA, as phloem tissue from the same genotypes (albeit in a larger sample size) did not show strong links to geography, see Villari et
al. (2018). This may be an effect of the fact that for Sweden and Lithuania, I
had only resistant samples available, see table 1, and that the sample size is small.
Parallels and comparisons with earlier studies
Constitutive phenolic compounds have been a topic of high research in-terest for discovering the basis of resistance in different Fraxinus species towards the Emerald Ash Borer (EAB). Previous work has found that some lignans (e.g. pinoresinol dihexoside) are more abundant in Fraxinus species resistant to EAB (e.g. F. mandshurica) than in susceptible species (e.g. F.
excelsior, F. nigra, F. pennsylvanica, F. americana) (Whitehill et al., 2012).
The lignans, which may well play a role in genetic resistance to EAB (Villari
et al., 2016) are also interesting for research on H. fraxineus, as species
without a coevolutionary history with EAB also lacks the same for H.
frax-ineus, as mentioned earlier. Results from such EAB studies are helpful for
comparisons in ash dieback studies, and indeed there has been some cross-over studies, for example Sollars et al. (2017) , who found evidence that iridoid glucosides may play a part in susceptibility to H. fraxineus, as higher abundance were found in more susceptible genotypes than in more resistant (Sollars et al., 2017). It would thus be very interesting to know if the com-pounds NI 12, NI 12 and NI 36 in this study belong to the iridoid glucosides, but unfortunately, that is not revealed due to reference library limitations. The only identified iridoids in this study are secoiridoids, see table 4.
42
It is of interest to compare not only F. excelsior genotypes of different susceptibility, but also species of the Fraxinus genera with different suscep-tibility to H. fraxineus, especially to compare with the natural host of H.
frax-ineus, F. mandshurica. See table 4.
Whitehill et al. (2012) found similar levels of esculin in the susceptible F.
excelsior and the resistant F. mandshurica, suggesting that esculin does not
play a vital part in resistance, which is in line with these findings. Oleuropein was found in much higher levels in F. mandshurica, but in similar levels in resistant and susceptible genotypes in this study, so the higher amplitudes in F. mandshurica could be a coincidence. Cleary et al. (2014) found oleuro-pein to be downregulated in leaves of a resistant genotype when treated with viridiol, compared to untreated control, whereas demethyleuropein was up-regulated in another resistant genotype.
Interestingly, ligustroside were found at lower levels in F. mandshurica than in F. excelsior and two North American species (Eyles et al., 2007; Whitehill et al., 2012) while that compound is higher in resistant genotypes in this study. Cleary et al. (2014) found that the related compound demethyl-ligustroside was upregulated in leaves of a resistant genotype treated with viridiol compared to untreated control. There is thus contradictory evidence regarding if ligustroside confers resistance to H. fraxineus, but this could be worth investigating further.
Tyrosol hexoside was downregulated in a resistant genotype in Cleary et
al. (2014) and in higher abundance in susceptible than in resistant species
but had no significance in this study. It is thus at least unlikely that a higher amount of tyrosol hexoside confers resistance against H. fraxineus.
More interesting is that fraxin was found in much higher levels in F.
mandshurica than in F. excelsior. Fraxin was also found in F. mandshurica
but not in F. pennsylvanica or F. americana in both the Eyles et al. (2007) study and in the Whitehill et al. (2012) study. This is interesting as both F.
pennsylvanica and F. americana are susceptible to H. fraxineus, albeit to
perhaps a lower degree than F. excelsior (Gross and Sieber, 2016; Nielsen
et al., 2017).
Another compound of some interest is calceolarioside A, as it was found in higher amplitudes both in resistant and susceptible genotypes in this study, and in F. mandshurica and F. excelsior in the Whitehill et al. (2012) study.
43 Table 4. Comparisons between studies for identified compounds.
Peak number
Identified compounds in this
study1 Significance in this study2 Differences in interspecific studies3 Regulated in response to viridiol in leaf4 Simple phenolics 4 Hydroxytyrosol hexoside - R 10 Tyrosol hexoside - S ↓R Coumarins 11 Esculin - - 20 Fraxin R R Secoiridoids 15 Oleoside - NA 47 Oleuropein - R ↓R, ↑R6 50 Ligustroside R S ↑R6 Lignans 27 Pinoresinol dihexoside R R5 29 Hydroxypinoresinol dihexoside - NA 37 Pinoresinol glucoside R R5 31 Lariciresinol hexoside - NA Flavonoids 34 Quercetin diglycoside - NA ↓R7 Phenylethanoids 35 Calceolarioside A R R 1Name
2.The difference between resistant and susceptible genotypes. “R” denotes that the compound was
found in higher amounts in resistant genotypes compared to susceptible ones, and “S” denotes that the opposite situation was found. No significant difference between resistant and susceptible trees is de-noted by “-“.
3 The difference between resistant and susceptible Fraxinus species in Whitehill et al. (2012) and Eyles
et al. (2007). Both studies include F. mandshurica, F. pennsylvanica, and F. americana, but only Whitehill et al. (2012) includes F. excelsior. “R” denotes that the compound was found in higher amounts in resistant genotypes compared to susceptible ones, and “S” denotes that the opposite situa-tion was found. No significant difference between resistant and susceptible trees is denoted by “-“. NA indicates that no comparison was possible due to lack of data.
4. Comparison to Cleary et al. (2014). Change compared to untreated controls for susceptible and
sistant genotypes treated with viridiol, a phytotoxin produced by H. fraxineus. ↑R indicates that in re-sistant genotypes, that compound was upregulated compared to untreated control. ↓R indicates down-regulated compared to control. ↑S indicates upregulated in susceptible genotypes etc.
5Not including F. excelsior but only F. mandshurica and North American species. 6. Demethylated counterpart. Cleary et al. (2014).
44
Pinoresinol dihexoside was found in much higher amplitudes in F.
mands-hurica than in both F. pennsylvanica and F. americana in Eyles et al. (2007)
and found in F. mandshurica but not detected at all in other Fraxinus species in Whitehill et al. (2012) while found at higher levels in resistant genotypes in this study. Though found at much lower levels than fraxin in this study and in the Whitehill et al. (2012) study, it was found in moderately higher levels in the Eyles et al. (2007) study and can putatively play a part in resistance.
It is worth noting that the levels of the same compounds in the same spe-cies differed between the Eyles et al. (2007) study and the Whitehill et al. (2012) study. This can be due to several reasons. Therefore I do not com-pare absolute levels between studies but only relative to other species in the same study, as the methodology is consistent between species within those studies but not necessarily between studies.
Limitations
In this study, I investigated only a subset of the samples included in the Villari et al. (2018) study, and the small sample size may lead to some limi-tations to widespread interprelimi-tations of the results.
Since there can be more than one compound with the same m/z, several compounds can potentially be found under the same peak in the chromato-grams. The MS system used is however good at separating co-eluting com-pounds and the results are likely representative for the real circumstances. To be completely sure further steps of validation need to be taken, which however is beyond the resources available for this study. These results thus give a good indication on what could be in interest to investigate further ra-ther than an absolute answer as to which secondary metabolites are the key to resistance.
Many of the compounds were not identified, which is normal for this kind of study (Christoph Crocoll, pers. comm.), but that is not to say that they are necessarily new discoveries. Indeed NI 21 and NI 22 were also detected in Eyles et al.(2007), where they were labelled as previously unidentified com-pounds (peak number 21 and 23), and it is likely that several other of the compounds have been found before in other studies. However, this is not a vastly explored field, lacking adequate standard chemical compounds librar-ies, which makes identification difficult. Standard libraries and methods that
45
exists are mostly developed for studies on compounds in humans and ani-mals, (such as medical research) and studies on plant metabolomics rely on in-house resources to a large extent.
That the compounds in higher quantity were identified is however a sign of some robustness in the chemical analysis and compound identification. Based on the available information (retention time, mass to charge ratio, fragmentation patterns) it is possible to say something about unidentified compounds. Specifically, NI 32 is purportedly an oleuropein derivative.
Concentration of phenolic compounds can vary quite significantly over time and space even within the same species; it even varies over the course of the day within the very same tissue (Soengas et al., 2018). It would thus be welcome with a larger study which can take this into account and com-pensate with more replicates, representing phenotypes.
Although different compounds look differently interesting it is important to keep in mind that natural defensive compounds are active not one at a time but several at once. Thus the activity of single compounds can be weak alone but have synergistic effects when combined with others with which they naturally cooccur, as demonstrated for the antifungal activity of lignans in Céspedes et al. (2006).
Considering future research
It would be of interest to validate these findings with a broader study, and to experimentally explore the specific effects on resistance of the identified phenolics which differed significantly between resistant and susceptible gen-otypes. If one or several compounds can be attributed to resistance, breed-ing on genetic ability to produce that or those phenolics in sufficient quanti-ties could be targeted in the screening. The complete genome of F. excelsior has been sequenced (Sollars et al., 2017) and a next step could be to find the genes that code for the synthesis of the respective phenolics, especially for the promising coumarin fraxin, and guide the use of transcriptomic mark-ers.
Another topic worthy of further research might be to assess the possibility to use mycovirus as a biological control (Schoebel,Zoller and Rigling, 2014).
46
Conclusions
In this study I present indications that high synthesis of fraxin may be a key to resistance towards H. fraxineus. This makes efforts for the functional salvation of F. excelsior through genetic improvements and breeding pro-grammes more hopeful by identifying potential chemical biomarkers associ-ated with resistance.