Is Myotis brandtii a fussy little bat?
– Habitat selection and impact of forestry on
Brandt's bat (Myotis brandtii)
Är Myotis brandtii en kinkig liten fladdermus? – Habitatval och
påverkan av skogsbruk på tajgafladdermus (Myotis brandtii)
Johanna Kammonen
Faculty of Natural Resources and Agricultural Sciences
Is Myotis brandtii a fussy little bat? – Habitat selection and
impact of forestry on Brandt's bat (Myotis brandtii)
Är Myotis brandtii en kinkig liten fladdermus? – Habitatval och påverkan av skogsbruk på tajgafladdermus (Myotis brandtii)
Johanna Kammonen
Supervisor: Johnny de Jong, Swedish University of Agricultural Sciences, CBM Swedish Biodiversity Centre
Examiner: Göran Hartman, Swedish University of Agricultural Sciences, Department of Ecology
Credits: 30 credits
Level: A2E
Course title: Master thesis in Biology
Course code: EX0895
Course coordinating department: Department of Aquatic Sciences and Assessment Place of publication: Uppsala
Year of publication: 2019
Cover picture: Johanna Kammonen
Online publication: https://stud.epsilon.slu.se
Keywords: Myotis brandtii, habitat selection, forestry, insects, maternity
colony
Humans are expanding their land use with e.g. forestry, agriculture and urbanisation, which can have both positive and negative effects upon biodiversity. One taxon that has shown to be affected by forestry is bats, however, the impacts differ depending on forestry method and their foraging strategy. This study focused on the habitat composition around maternity colonies of the forest-living Brandt’s bat (Myotis
brandtii) in Sweden, with the objective to investigate how the species might be
af-fected by forestry and if their presence of colonies can be predicted based on habitat composition. To do so, bat activity and insect abundance was measured in relation to a number of habitat variables (forest density, canopy cover and level of soil moisture), and in three types of forest habitats (coniferous forest, swamp forest and edge be-tween forest and open areas). Insects were caught with suction traps and bat activity was surveyed with automatic ultrasound detectors. Habitat composition within 1 km radius from 14 colonies was compared to three control areas of 20 × 20 km.
Insect abundance and bat activity was not correlated. Insect abundance was highest at edge habitat, while bat activity was highest in swamp forests. High level of soil moisture was important for both insect abundance and bat activity, which suggests that drainage of forests is negative for forest-living bats. There was a trend towards more bats in medium dense forest, which suggests that the species is tolerant towards thinning of forests. Habitat coverage did not differ between colony areas and control areas, and the variance was large in colony areas. This indicates that M. brandtii oc-curs in the dominant type of landscape in the studied area. It was not possible to relate presence of colonies to occurrence or distribution to any habitat, making it hard to predict M. brandtii colony presence based on maps. Forestry methods in which a continuous crown cover is conserved is positive for forest-living bats, but the main conservation measure is to restore or create new forested wetlands.
Keywords: Myotis brandtii, habitat selection, forestry, insects, maternity colony
Abstract
List of tables 4 List of figures 5 1 Introduction 7 2 Methods 9 2.1 Study area 9 2.2 Bat colonies 10 2.3 Sampling sites 10 2.4 Insect sampling 11 2.5 Bat sampling 13 2.6 Landscape analysis 13 2.7 Data analysis 15 3 Results 16
3.1 Insect and bat sampling 16
3.2 Landscape analysis 17 4 Discussion 21 5 Conclusions 25 Acknowledgements 26 References 27 Appendix A 31 Appendix B 35
Table of contents
Table 1. Summary over habitat coverage within 1 km radius of the 16 colonies M.
brandtii colonies. 18
Table 2. Summary over pooled habitat coverage within 1 km radius of the M. brandtii colonies (14 × 314 ha) and the control areas in Uppland (3 × 2000 ha).
Showing mean, range and standard deviation. 20
Table 3. Distance (m) to closest large water body (≥1 ha) to each M. brandtii colony. 20 Table A1. Raw data for each sample site. Showing habitat, level of soil moisture (1 =
dry, 2 = medium, 3 = wet), level of canopy cover (1 = open, 2 = half-open, 3 = closed), forest density (number of trees/100m2), number of insects,
insect weight (g) and number of recorded Myotis. 31 Table B1. Habitat coverage (ha) and length (km) of edge between forest and open
grassland/water for each of the 16 M. brandtii colonies in 2019. 35
Figure 1. Female Myotis brandtii. Photo: Johanna Kammonen. 9
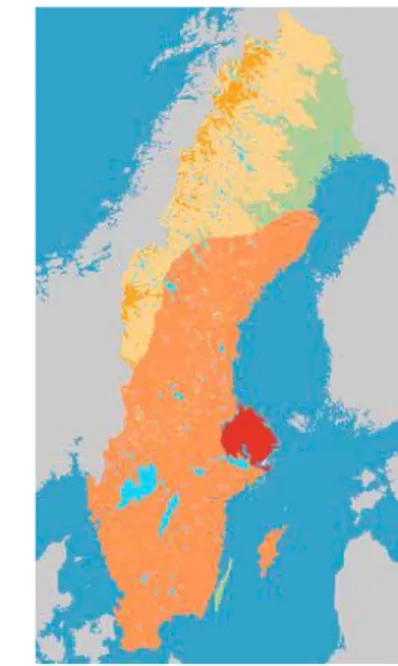
Figure 2. Distribution (orange) of Myotis brandtii in Sweden. The province of
Uppland is marked in red. Map adjusted from Ahlén (2011) and smhi.se. 9
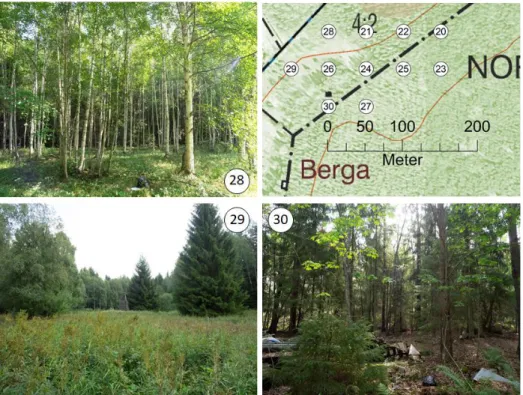
Figure 3. Sample design 2018, showing three sample sites (28, 29 and 30) from one
night at the colony in Berga. The map demonstrates locations for each
sample site. Photos: Marielle Cambronero. 12
Figure 4. The three different habitats sampled in 2019: a) forest, b) swamp and c)
edge. Picture d) shows dried and weighted insects. Photos: Johanna
Kammonen. 12
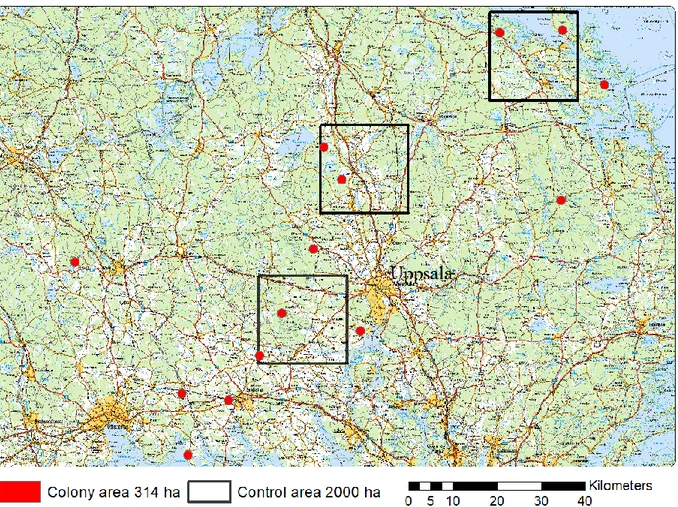
Figure 5. 14 of the 16 Myotis brandtii colonies (red dots) and the three control areas
(black squares) in the province of Uppland, east-central Sweden. 14
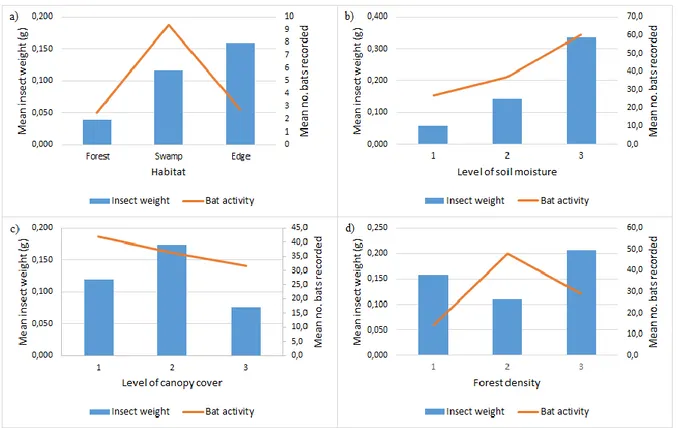
Figure 6. Insect weight and bat activity in relation to a) habitat, b) level of soil
moisture (1 = dry, 2 = medium, 3 = wet), c) level of canopy cover (1 = open, 2 = half-open, 3 = closed) and d) forest density (1 = low, 2 =
medium, 3 = high). 17
Figure 7. Variance in habitat coverage within 1 km radius across the 16 Myotis brandtii colonies. The seven main habitats are depicted: forest, swamp
forest, clear-cut, grassland, pasture, open wetland and open water. 19
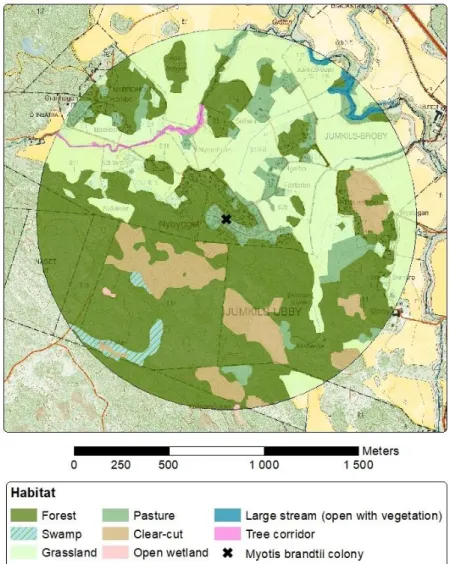
Figure 8. Example of digitised habitats within 1 km radius around a Myotis brandtii
colony (Jumkil). 19
As the human population expands, so does the anthropogenic use of land, such as forestry, agriculture and urban development. Land use can have positive effects on biodiversity, when new habitats are created (Fahrig, 2017), but habitat loss and deg-radation can also have negative effects (e.g. Schmiegelow & Monkkonen, 2002; Hillers et al., 2008; Farrow & Broders, 2011). To minimise negative effects and maximise positive effects, humans must challenge themselves to find smarter ways to use land and combine it with conservation. This paper will touch upon the com-bination of forestry and bat conservation.
Many bat species depend on forests for roosts, shelter and food, suggesting they are affected by forestry (Duchamp & Swihart, 2008; Law et al., 2016). Extensive forestry, in e.g. Europe, has removed trees with cavities, forcing cavity-roosting bats to seek shelter in manmade structures, e.g. buildings (Kunz & Lumsden, 2003). For-est management includes clear-cutting, variable retention harvFor-esting, pre-commer-cial thinning, thinning, drainage, planting etc. (e.g. Fries et al., 1997; Humes et al., 1999; Patriquin & Barclay, 2003; Peltomaa, 2007; Gustafsson et al., 2012), and these methods have shown to affect bat species differently. Bats are adapted to spe-cific vegetation structures, depending on e.g. wing morphology and echolocation call, and the foraging strategy is separated between species (Patriquin & Barclay, 2003; Owen et al., 2004; Law et al., 2018). Drainage of forestland, which was com-monly used in Fennoscandia to increase productivity of forests in the late 1900’s, had severe impacts on vegetation and plant composition (Peltomaa, 2007; Maanavilja et al., 2014). Structural changes in forests due to forestry can change the abundance and distribution of insects (Batzer & Wissinger, 1996; Deans et al., 2005), which is the main energy source of bats. For instance, edges created by for-estry can be positive for insect abundance (Deans et al., 2005; Gonzalez et al., 2017), while drainage of forests are presumably negative for the otherwise high in-sect abundance in wetlands (Batzer & Wissinger, 1996; Spitzer & Danks, 2006).
All bats and their roosts are legally protected in Europe (Council Directive 92/43/EEC). In order to know how to protect bats and their roosts, it is important to
understand how bats choose habitats and roosts, and how the quality of the sur-rounding landscape impact on bat occurrence (Bellamy & Altringham, 2015). Bats have very energy-consuming foraging strategies, and energy limitation affects ac-tivity pattern, home-range and behaviour, especially during pregnancy and lactation, when most of the energy goes to the pup (Rydell, 1993; Sommers et al., 2019). In general, the foraging ground seem to correlate with insect abundance (de Jong & Ahlén, 1991; Fukui et al., 2006), and to maximise energy intake and minimise flight time, bat maternity colonies should be located in areas with high insect production (Tuttle, 1976).
This study focused on the forest-living Myotis brandtii (Figure 1). It is a small (about 5-7 g) insectivorous bat, mainly feeding upon small Diptera and Lepidoptera (Vaughan, 1997; Whitaker & Karatas, 2009; Vesterinen et al., 2018). In May, the bat forms its colonies in trees and buildings (Sachanowicz & Ruczynski, 2001; Ahlén, 2011; Dietz & Kiefer, 2016), consisting of pregnant females. Pups are born in the end of June and the colonies dissolve in late July (Dietz & Kiefer, 2016). The species has been found to forage in coniferous forests and avoid open areas, such as clear-cuts or grassland (de Jong, 1995; Ekman & de Jong, 1996; Kammonen, 2015). M. brandtii was chosen as study species due to it being common in the study area and easy to find. Since it is a forest-living species, it is also potentially affected by changes in the forest caused by different types of forestry (Ekman & de Jong, 1996; Law et al., 2016; Law et al., 2018).
As an attempt to predict where Myotis brandtii might form colonies and see how forestry might affect the species, the surrounding landscape of maternity colonies of M. brandtii was investigated in east-central Sweden. I predicted a positive corre-lation between insect abundance and bat activity, and thus hypothesised that forestry methods that have negative effects upon insect production also are negative for bats. Further, I investigated what type of coniferous forests M. brandtii utilises, by eval-uating bat activity and insect abundance in relation to forest structure and level of soil moisture. I hypothesised that areas with high level of soil moisture, such as swamp forests, are important for bat activity, based on high insect production at wet areas. Thus, I predicted that swamp forests are important elements in the landscape surrounding M. brandtii maternity colonies.
2.1
Study area
The field study was performed in June and July, 2018 and 2019, in east-central Swe-den, predominantly in the province of Uppland (60°0’N, 18°0’E) (Figure 2), but
also in adjacent provinces of Södermanland and Västmanland.The hemiboreal
land-scape of Uppland is dominated by forests (58 %), but arable land also covers large areas (24 %) (Maad et al., 2009).
Figure 1. Female Myotis brandtii. Photo:
Johanna Kammonen.
Figure 2. Distribution (orange) of Myotis brandtii
in Sweden. The province of Uppland is marked in red. Map adjusted from Ahlén (2011) and smhi.se.
2.2
Bat colonies
The study focused on Myotis brandtii maternity colonies. In public appeals, citizens were asked to report known locations of bat colonies. Promising sites were visited to identify bats. A rough identification was made with ultrasound detectors (D240X, Pettersson Elektronik AB) when bats emerged from the colonies. Bats identified to the genus Myotis were trapped with mist nets for more detailed identification. In total, 16 colonies of M. brandtii were used in the digital landscape analysis, whereof nine were selected for the field studies (three 2018, six 2019). The colonies used in the field study 2018 were selected based on known bat activity. In 2019, colonies were selected based on accessibility to the city of Uppsala and presence of swamp forests.
2.3
Sampling sites
Two different methods were used for site selection of insect and bat sampling: bat activity and habitat composition. In 2018, the site selection was based on bat activ-ity. In a former study, de Jong et al. (in prep), identified forest areas where bats were foraging, close to three selected colonies. Within these foraging areas one sampling site with high activity of bats per colony was selected for insect trapping and bat survey. The remaining sampling sites were placed systematically around the first site. During each night, sampling sites were located at three directions, 50 meters from the generator, meaning that two traps were 100 meters from each other, and the third trap was 70 meters (diagonally) from the other two. Over all nights, sam-pling sites were systematically located 50/70 meters apart (Figure 3). These sites were described according to their level of soil moisture, canopy cover and forest density. Soil moisture was categorised in three classes, based on vegetation: 1) dry sites, mainly covered with Cladonia or Vaccinium vitis-idaea; 2) medium wet sites, with more complex vegetation with herbs, grass and bushes (mainly Vaccinium myr-tillus); 3) wet or moist sites, dominated by Carex or hydrophilic vegetation. Canopy cover was categorised as 1) open (more than 70 % of the sky visible); 2) half-open (about 30-70 % of the sky visible) or 3) closed (less than 30 % of the sky visible). Forest density was categorised in three classes based on number of trees >10 cm
DBH/100m2: 1) low (0-4 trees); 2) medium (5-9 trees); 3) high (10-14 trees).
In 2019, the site selection was based on habitat composition. Three different habitats were selected: mature coniferous forest (> 60 years old Picea abies and/or Pinus sylvestris), coniferous swamp forest and edge between mature coniferous
forest and open grassland (hereafter referred to as forest, swamp and edge, respec-tively; Figure 4). These habitats were chosen to investigate potential differences be-tween lush and wet forests in relation to insect abundance and bat activity. Edges were included due to their general use by bats for commuting and foraging (Morris et al., 2010; Kalcounis-Rueppell et al., 2013). Swamps and edges are also important insect habitats (Fowler et al., 1993; Batzer & Wissinger, 1996; Spitzer & Danks, 2006).
2.4
Insect sampling
Insects were caught with suction traps (Kunz, 1988) powered by a portable gasoline generator. The traps were located in areas 100-1000 meters from M. brandtii colo-nies. The minimum range of 100 meters was chosen due to the sampling of bat ac-tivity – to avoid recording bats commuting to and from the colony, but record bats actively foraging. The maximum range of 1000 meters was chosen based on the relatively small home-range of the species (Kammonen, 2015). At 18 of 54 sampling sites in 2019, the maximum range of 1000 meters was exceeded, due to absence of suitable habitats within the range. Other criteria for the location of traps were prox-imity to a road (accessibility with car due to heavy weights of the equipment) and secluded from houses (to minimise disturbance and risk of theft).
During each sample-night, three traps were placed at most 100 m, straight north, south, east or west from each other. In the edge habitat, 2019, traps were located along the edge between forest and grassland. In 2018, three colony areas were in-vestigated and categorised based on their vegetation structure (61 samples and 21 nights in total). In 2019, six colony areas were investigated based on three habitats (forest, swamp and edge; 54 samples and 18 nights in total).
The traps were started at sunset and ran for three hours. Captured insects were
stored in glycol and later counted,dried in 80°C for 18h and weighted on a balance
Figure 3. Sample design 2018, showing three sample sites (28, 29 and 30) from one night at the colony
in Berga. The map demonstrates locations for each sample site. Photos: Marielle Cambronero.
Figure 4. The three different habitats sampled in 2019: a) forest, b) swamp and c) edge. Picture d)
2.5
Bat sampling
Bat activity was sampled at the sites of insect traps using automatic ultrasound de-tectors, so-called auto-boxes (D500X, Pettersson Elektronik AB). Auto-boxes were placed in trees (about 2 meters above ground), facing the interior of forest/swamp and along the edge. The data used from the auto-boxes spans for three hours after sunset. Bat recordings were identified using Omnibat (Ecocom AB) and Batsound (Pettersson Elektronik AB). Only data from Myotis recordings was used in the anal-ysis. Myotis recordings were not identified to species, due to similarities of their echolocation calls (Ahlen & Baagoe, 1999). However, since all sampling sites were close to colonies of Myotis brandtii, it was assumed that the majority of all sounds was M. brandtii. Bat activity was measured as the number of Myotis recordings per auto-box and night. Foraging and commuting was not differentiated.
2.6
Landscape analysis
The landscape within 1 km radius around 16 M. brandtii colonies was digitised in ArcMap (version 10.7.1, ESRI Inc., Redlands, CA). The 1 km radius was chosen based on the relatively small home-range of the species (Kammonen, 2015). Seven major habitats were digitised with property maps and orthophotos as references (www.lantmateriet.se), namely: forest (both coniferous and deciduous), swamp for-est, clear-cuttings (logged stands and possibly stands < 20 years), open grassland (both current and abandoned arable land), pasture (≤ 50 trees/ha), open wetland and open water (sea, lakes, ponds). In addition, larger streams, tree corridors and urban areas were digitized. Larger streams were categorized as open, open with vegetation or inside forest. Larger streams were clearly visible in orthophoto with a minimum width of about four meters. Tree corridors connected habitats, e.g. two forests on opposite sides of a grassland. Urban areas included larger roads, railways and larger built areas. Data for swamp forests and clear-cuttings was provided from the Swe-dish Forest Agency (www.skogsstyrelsen.se).
In addition to digitising the landscape within 1 km radius from the bat colonies, three control areas of 20 × 20 km were digitised. These areas were distributed south to north in the province of Uppland and contained two analysed M. brandtii colonies each (Figure 5). These control areas were more roughly digitised with only five habitats: forest, swamp forest, open areas, open water and urban areas. Forest in-cluded forest and tree corridors as well as larger streams inside forests. Again, the data for swamp forest was provided from the Swedish Forest Agency. Open areas included grassland, pasture, open wetland and clear-cuttings (no provided data used). Open water included sea, lakes, ponds and larger streams. Urban areas only included larger built areas, with no roads or railways.
Similarly to previous studies (e.g. Sachanowicz & Ruczynski, 2001; Bellamy & Altringham, 2015), distance to the closest large water body (≥1 ha) was measured, because of high insect abundance over still water (Zukal & Rehák, 2006) and high levels of bat activity in general (Walsh & Harris, 1996).
Figure 5. 14 of the 16 Myotis brandtii colonies (red dots) and the three control areas (black squares)
2.7
Data analysis
Data was log base 10-transformed (Log(1+x)) and tested for normal distribution (Ryan-Joiner test). However, most data were not fitted to normal distribution. One exception was bat activity data which not differ from normal distribution. Therefore, Spearman’s rank correlation test and Kruskal-Wallis was used in the analysis of
insects, while ANOVA has been used to analyse bat data.
The landscape data was analysed with a one-sample z-test, with the alternative hypothesis: mean ≠ hypothesised mean, to compare the observed habitat coverage around the colonies with the expected habitat coverage from the control landscape of Uppland. When comparing colonies to control landscapes, the digitised habitats from colony areas were pooled together to match the habitats of control landscape. In this comparison, only 14 colonies were used, based on distance to the province of Uppland.
Data analysis were made in Minitab 18 (Minitab, LLC). Alpha level 0,05 was used for all tests.
3.1
Insect and bat sampling
Insect weight (g) and number were positively correlated (p < 0,001, Spearman rho = 0,620, n = 115). Because insect weight and number were correlated, only weight was further analysed as insect abundance. Most of the insects (94 %) belong to the order Diptera, which is one of the main prey insect orders of M. brandtii (Vesterinen et al., 2018). Because of the dominance of Diptera, no further analysis was made based on insect orders.
There was a difference between median insect abundance in the three different habitats, 2019: forest, swamp and edge (p = 0,001, Kruskal-Wallis, n = 54), where insect abundance was highest in edge and swamp habitats (Figure 6a). There was also a difference in insect abundance in the different levels of soil moisture, 2018 (p < 0,001, Kruskal-Wallis, n = 61), with higher insect abundance in the most wet areas (Figure 6b). Insect abundance also differed in the three different classes of canopy cover, 2018, with more insects in half open canopy (p = 0,044, Kruskal-Wallis, n = 61) (Figure 6c). Insect abundance was, however, not correlated with density of for-est, 2018 (p = 0,374, Kruskal-Wallis, n = 61) (Figure 6d, Appendix A).
Bat activity was significantly higher in swamp forest compared to forest and edge habitat (p = 0,015, ANOVA and Tukey test) (Figure 6a). There was no signif-icant difference in bat activity in relation to soil moisture (p = 0,812, ANOVA), however, mean values indicate a trend towards more bats in the most wet areas (Fig-ure 6b). Bat activity did not differ in relation to canopy cover (p = 0,232, ANOVA) (Figure 6c) or density of forest (p = 0,525, ANOVA), however, mean values indicate a trend towards more bats in medium dense forest (Figure 6d).
There was no correlation between overall (2018 + 2019) insect abundance and bat activity (p = 0,781, Spearman rho = 0,026, n = 115). The absence of correlation between insect abundance and bat activity was also prominent in the different
habitats (forest: p = 0,102, Spearman rho = -0,398, n = 18; swamp: p = 0,100, Spear-man rho = -0,400, n = 18; edge: p = 0,447, SpearSpear-man rho = 0,191, n = 18) (Figure 6a).
Figure 6. Insect weight and bat activity in relation to a) habitat, b) level of soil moisture (1 = dry, 2 =
medium, 3 = wet), c) level of canopy cover (1 = open, 2 = half-open, 3 = closed) and d) forest density (1 = low, 2 = medium, 3 = high).
3.2
Landscape analysis
Forest and grassland make up the majority of habitats of the combined areas around M. brandtii colonies (16 × 314 ha), where forest was the dominant habitat (56 % and 21 % respectively, Table 1). Forest cover ranged between 21 and 75 %, while the range of grassland was 0-63 %. Swamp had a total coverage of 4 %, with the range of 0-31 % (Table 1, Figure 7, Figure 8, Appendix B).
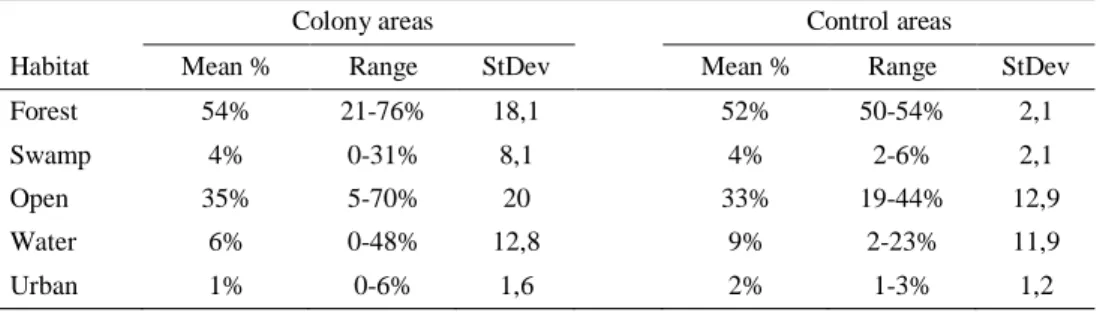
There was no difference in habitat coverage between the landscape of colony areas (14 × 314 ha) and the control landscapes of Uppland (3 × 2000 ha) (swamp p = 0,736; open p = 0,571; water p = 0,244; n = 14), except for forest (p < 0,001, n =
14) (Table 2). However, the mean coverage of forest was similar for colony areas and the control areas (54 % and 52 %, respectively).
There was a large variance in distance to nearest large water body (≥1 ha) from the colonies, with the closest being 144 m away and the furthest more than 4000 m
away. In total, ten Myotis brandtii colonies were located within 1500m of a large
water body, whereof three of the water bodies were the Baltic Sea. Six colonies were located further than 1500 m away, whereof two were further than 4000 m away of a large water body (Table 3).
Table 1. Summary over habitat coverage within 1 km radius of the 16 colonies M. brandtii colonies.
Habitat Mean Range StDev
Forest 56% 21-75% 17,4 Swamp forest 4% 0-31% 7,7 Clear-cutting 8% 0-30% 7,7 Grassland 21% 0-63% 20,2 Pasture 3% 0-9% 2,3 Open wetland 1% 0-6% 1,9 Open water 5% 0-48% 12,1
Larger stream (forest) 0% 0-0% 0,0
Larger stream (open) 0% 0-2% 0,5
Larger stream (open with vegetation) 0% 0-1% 0,3
Tree corridor 0% 0-1% 0,2
Urban 1% 0-6% 1,5
Edge (open, km) 19,8 10,6-29,7 5,4
Figure 7. Variance in habitat coverage within 1 km radius across the 16 Myotis brandtii colonies. The
seven main habitats are depicted: forest, swamp forest, clear-cut, grassland, pasture, open wetland and open water.
Table 2. Summary over pooled habitat coverage within 1 km radius of the M. brandtii colonies (14 ×
314 ha) and the control areas in Uppland (3 × 2000 ha). Showing mean, range and standard deviation.
Table 3. Distance (m) to closest large water body (≥1 ha) to each M. brandtii colony. Colony Distance (m) Sundsveden 144 Kolmården 200 Holmsjötorp 215 Marsveden 215 Habbalsbo 488 Ängsö 590 Gräsö 757 Lågbol 900 Hammarskog 940 Sala 1200 Långtora 1840 Jumkil 2084 Läby 2530 Bolanda 2777 Orresta >4000 Ullunda >4000
Colony areas Control areas
Habitat Mean % Range StDev Mean % Range StDev
Forest 54% 21-76% 18,1 52% 50-54% 2,1
Swamp 4% 0-31% 8,1 4% 2-6% 2,1
Open 35% 5-70% 20 33% 19-44% 12,9
Water 6% 0-48% 12,8 9% 2-23% 11,9
This study demonstrates the importance of wet forests for insect production and bat activity. However, the relation between bat activity and insect abundance in general, seem to be more complicated, since bat activity also relates to vegetation structure. Further, the study demonstrates that Myotis brandtii colonies are present in the dom-inant type of landscape in Uppland, suggesting that the requirements in habitat com-position matches the overall landscape.
Measuring insect abundance can be difficult and require a large number of sam-ples, both spatially and temporally (Ekman & de Jong, 1996). This may explain the lack of correlation between bat activity and insect availability in this study. How-ever, a potential correlation between insect abundance and bat activity is not only related to the amount of insects per se, but also vegetation structure and habitat se-lection by bats (Grindal & Brigham, 1999; Gonsalves et al., 2013). My results co-incide with those of Grindal & Brigham (1999) that found no significant correlation between activity of the studied bats and insect abundance in southern Canada. In England, Todd & Waters (2017) found no correlation between insect activity and bat activity (Myotis daubentonii and Pipistrellus pipistrellus) along a river. How-ever, other studies have found that bat activity is correlated to insect availability
(e.g. de Jong & Ahlén, 1991; Fukui et al., 2006; Gonsalves et al., 2013).Fukui et
al. (2006) experimentally tested the correlation between foraging bats (Myotis macrodactylus and M. ikonnikovi) and insect abundance along a stream in Japan, and found significantly more bats in control areas than in areas with experimentally excluded insects. de Jong & Ahlén (1991) found that bats in Sweden (mainly Epte-sicus nilssonii and P. pipistrellus) followed the availability of insects through the season, where different habitats were important at different periods. Gonsalves et al. (2013) found that the activity of Vespadelus vulturnus followed the abundance and distribution of its prey mosquito in Australia. Gonsalves et al. (2013) also found that V. vulturnus preferred to forage in the open saltmarsh even when mosquitos were equally available in the adjacent cluttered coastal swamp forest. However, when mosquitos were scarce in the saltmarsh, cluttered coastal swamp forest was
used according to its availability. Grindal & Brigham (1999) found that the studied bats in southern Canada avoided foraging in cluttered forest, even though insect abundance was highest in forest and that the bats roosted there. In my study, insect abundance was highest in edge habitat, however, bat activity was low at edges. This is an additional explanation as to why there was no correlation between insects and bats, since the studied species of bat avoid foraging in open areas (de Jong, 1995; Kammonen, 2015), and thus also avoid edge habitats.
Insect abundance was highest at the most wet locations in 2018, and high in swamp forests 2019 (highest in edge), demonstrating the importance of wet areas for insect production. It has previously been shown that wet areas generate high insect abundance (e.g. Batzer & Wissinger, 1996; Spitzer & Danks, 2006). How-ever, Vinnersten et al. (2014) found that the number of emerging insects decreased with an increased period of floods, in wetlands and swamps in Sweden, suggesting that the amount of water itself is negative for many insect taxa. Further studies may be needed to evaluate insect abundance in relation to forested wetlands. Higher in-sect abundance at edges compared to forest interior has been demonstrated (e.g. Gonzalez et al., 2017), however, Grindal & Brigham (1999) found higher insect abundance in forests compared to edges.
My prediction that wet areas would be important for bat activity is supported by significantly more bats in swamp forest 2019, and a trend towards higher bat activity in the most wet areas 2018. Few studies have focused on the relation between bats and swamp forests in boreal, or even temperate areas, but see Ciechanowski et al. (2011) and Nummi et al. (2011) for positive effects upon bats from beaver dams. However, several studies from tropical and subtropical areas demonstrate that swamp forests and other forested wetlands are important for different bat species, depending on foraging strategy (e.g. Struebig & Galdikas, 2006; Gonsalves et al., 2013). Clement & Castleberry (2013) developed a model based on the forest-dwell-ing bat Corynorhinus rafinesquii in subtropical Georgia, USA, predictforest-dwell-ing the num-ber of colonies and their densities in relation to forest wetland width and duration of flooding. The model predicted more colonies and higher densities in wider forest wetlands as well as those with longer periods of flooding, and the authors suggest the model can be used for other bat species.
Bat activity was not significantly correlated with forest structure (i.e. density or canopy cover). There was, however, a trend towards more bats in areas with more open canopy cover. This suggests that small glades are probably not negative for the species, in contrast to large clearings. There was also a trend towards more bats in medium dense forests, which suggests that M. brandtii tolerates management of forest interiors, such as thinning, but probably not clear-cutting. In Finland, Wermundsen & Siivonen (2008) found that M. brandtii/M. mystacinus foraged pre-dominantly in medium cluttered, coniferous woodland. This supports that M.
brandtii is tolerant to thinning of forests, and the authors even propose this action as a conservation measure (Wermundsen & Siivonen, 2008). While thinning of for-ests appear tolerable, or even positive, for M. brandtii (Wermundsen & Siivonen, 2008), clear-cutting or draining of forests are probably negative for the species. Whether M. brandtii forage in open areas (such as clear-cuts) or not, was not inves-tigated in this study, but has been done previously. Radio-tracking results show that M. brandtii avoids foraging in open areas (de Jong, 1995; Kammonen, 2015), sug-gesting that clear-cutting as a harvesting method is negative for this species of bat. M. brandtii might avoid large open areas due to predation risk from opportunistic avian predators (Speakman, 1991) and interspecific competition (Kurek et al., 2017; Roeleke et al., 2018). To my knowledge, no studies have investigated the effects of drainage in boreal forests upon bats. Draining of forests in northern Europe has caused a major decrease in the amount of swamp forests (Maanavilja et al., 2014). Based on the results from this and other studies, swamp forests are important for both insect production and bat activity (Struebig & Galdikas, 2006; Gonsalves et al., 2013). In Sweden, drainage to improve forestry or agriculture was common until 1980. It is nowadays rare, but is still used in connection to clear-cutting, thus large-scale restoration should be considered (Bernes, 1994, 2001).
The habitat composition within the colony areas (14 × 314 ha) did not differ from the control landscape of Uppland (3 × 2000 ha), i.e. there was no difference in the amount of e.g. swamp or forest. There were also large variations in habitat coverage around the colony areas (16 × 314 ha) in the more detailed analysis (e.g. forest 21-75 %, swamp 0-31 %, grassland 0-63 % and edge length between forest and open areas 10,6-29,7 km). The length of edges varied largely, and this together with low bat activity in edges suggests that edge-length is unimportant for colony-site selec-tion of M. brandtii. The importance of swamps and high level of soil moisture for both insects and bats have been demonstrated in this study, however, due to the large variation in swamp coverage, M. brandtii does not seem to require large areas of swamp in proximity to their colonies. These results suggest that the dominant type of landscape in Uppland is suitable for M. brandtii colonies, making it hard to pre-dict colony locations based on maps at landscape level. It is possible, however, that there are differences in microhabitats, that doesn’t show on maps. Insect abundance is probably important together with high level of soil moisture and forest interior habitats. Not only swamp forests have high level of soil moisture, but e.g. temporary pools and small bogs are also rich in water and positive for insect production (Batzer & Wissinger, 1996; Spitzer & Danks, 2006). Further studies are needed to evaluate at a finer level what causes Myotis brandtii to choose locations for their colonies, e.g. more detailed investigation of soil moisture in relation to bat abundance.
In general, different types of lakes, ponds and streams are positive for bats and insect abundance (Walsh & Harris, 1996; Zukal & Rehák, 2006). However, there
are studies showing a negative relation between M. brandtii and larger lakes (Sachanowicz & Ruczynski, 2001; Bellamy & Altringham, 2015). One possible ex-planation may be sensitivity to interspecific competition, with e.g. Myotis dauben-tonii and Pipistrellus pygmaeus that more frequently forage over water (Kurek et al., 2017). The large variance in distance to nearest large (≥1 ha) water body in this study, suggests that proximity to this type of water is not related to M. brandtii col-onies. The majority of colonies in this study (9 of 16) were closer than 1000 m from large water bodies, whereof five were closer than 500 m. On the other hand, five were located more than 2000 m away, whereof two more than 4000 m away.
Different bat species may be affected differently by forestry, depending on e.g. foraging strategy, wing morphology, echolocation calls and roost type (Patriquin & Barclay, 2003; Owen et al., 2004; Law et al., 2018; Huang et al., 2019). For in-stance, bats that forage in open habitats use echolocation calls designed to detect items at long distances and also have long and narrow wings, enabling fast flight (Norberg, 1989; Schnitzler et al., 2003; Russ, 2012). Bats that forage in edges and more cluttered environments, on the other hand, use a variety of echolocation calls that gives detailed information about the nearest surroundings. They usually have shorter and broader wings, enabling slow but manoeuvrable flight in dense vegeta-tion (Norberg, 1989; Schnitzler et al., 2003; Russ, 2012). Bats adapted to open hab-itats can be positively affected by forestry, when more open forests, edges and clear-cuts are created (cf. Ethier & Fahrig, 2011). On the other hand, forestry may have negative impacts on species specialised to highly cluttered environments, especially if they also roost in trees (Huang et al., 2019). M. brandtii forages in medium clut-tered forests (Zukal & Rehák, 2006; Wermundsen & Siivonen, 2008) and roosts in trees as well as in buildings (Sachanowicz & Ruczynski, 2001), which might explain why this species appears to be tolerant towards thinning of forests.
To conclude, Myotis brandtii occurs in landscapes dominated by production for-estry, and is probably favoured by thinning and continuous canopy-cover forfor-estry, which could be employed as conservation measures. Thinning can be beneficial for bats, since forests can be used more efficiently for foraging (Humes et al., 1999; Wermundsen & Siivonen, 2008). Adapted forestry with a continuous canopy-cover (i.e. clear-cuts are avoided) containing trees of various sizes and ages (i.e. structur-ally heterogenous), can be beneficial for forest-living bats (Pommerening & Murphy, 2004). Probably, the most important aspect in the conservation of forest-living bats is rewetting of forested wetlands. A next step for this study can be to further evaluate forested wetlands, based on e.g. their size and duration of flooding, and connect them to presence of forest-living bats.
Myotis brandtii is present in the dominant type of landscape in east-central Sweden, and it is difficult to predict M. brandtii colonies in these areas based on maps and the data used. The results of this study show a clear connection between soil mois-ture and insect abundance as well as bat activity, suggesting that swamp forests and other wet forested areas are important for M. brandtii colonies. However, the species do not seem to require large amounts of swamp forests, meaning that the presence of a M. brandtii colony cannot be predicted by swamp forests alone. Further studies are needed to investigate the relation between forested wetlands and forest-living bats.
No correlation between insect abundance and bat activity was found. Insect abundance was highest at edges, while bat activity was low at these habitats, sug-gesting that vegetation structure is more important than insect abundance in habitat selection of this species of bat. However, forest density does not appear to be crucial in habitat selection, even though there was a tendency towards more bat activity at medium dense forests. In all studied areas, normal production forestry was em-ployed, further suggesting that the species is tolerant towards thinning of forests. One area of conflict can, however, be large areas of clear-cutting, if not enough forest is retained in connection to colonies. Additionally, the most negative impact from forestry upon Myotis brandtii is drainage of forests. Therefore, the most im-portant conservation measure for M. brandtii, and probably for forest-living bat spe-cies in general, is to preserve, restore or create new swamp forests and other forested wetlands.
I would like to thank all the kind people who let us come to their homes and look for and catch bats, as well as educate them about bats. Without the support from citizens, these kinds of studies are hard to perform. I also want to thank Marielle Cambronero for the assistance with auto-boxes; Arvid de Jong for his help with sorting and counting insects; Anders Dahlberg for lending me a lab to dry and weight insects; and all the people who did the field work in 2018. Last but certainly not least, I want to especially thank Johnny de Jong for all his valuable support – both practical and mental.
The study was sponsored by the Swedish Forest Society (Skogssällskapet) and the Swedish Transport Administration (Trafikverket).
Ahlén, I. (2011). Fladdermusfaunan i Sverige. Arternas utbredning och status. Kunskapsläget 2011.
Fauna och flora, 106(2), 2-19.
Ahlen, I., & Baagoe, H. J. (1999). Use of ultrasound detectors for bat studies in Europe: experiences from field identification, surveys, and monitoring. Acta Chiropterologica, 1(2), 137-150. Batzer, D. P., & Wissinger, S. A. (1996). Ecology of insect communities in nontidal wetlands. Annual
Review of Entomology, 41(1), 75-100.
Bellamy, C., & Altringham, J. (2015). Predicting species distributions using record centre data: multi-scale modelling of habitat suitability for bat roosts. Plos One, 10(6).
Bernes, C. (1994). Biological diversity in Sweden: a country study. Solna: Naturvårdsverket förlag. Bernes, C. (2001). Läker tiden alla sår? Om spåren efter människans miljöpåverkan. Solna:
Naturvårdsverket förlag.
Ciechanowski, M., Kubic, W., Rynkiewicz, A., & Zwolicki, A. (2011). Reintroduction of beavers Castor fiber may improve habitat quality for vespertilionid bats foraging in small river valleys.
European Journal of Wildlife Research, 57(4), 737-747.
Clement, M. J., & Castleberry, S. B. (2013). Estimating density of a forest‐dwelling bat: a predictive model for Rafinesque's big‐eared bat. Population ecology, 55(1), 205-215.
Council Directive 92/43/EEC of 21 May 1992 on the conservation of natural habitats and of wild fauna and flora, (1992).
de Jong, J. (1995). Habitat use and species richness of bats in a patchy landscape. Acta Theriologica,
3(40).
de Jong, J., & Ahlén, I. (1991). Factors affecting the distribution pattern of bats in Uppland, central Sweden. Holarctic Ecology, 14(2), 92-96.
Deans, A. M., Malcolm, J. R., Smith, S. M., & Bellocq, M. I. (2005). Edge effects and the responses of aerial insect assemblages to structural-retention harvesting in Canadian boreal peatland forests.
Forest Ecology and Management, 204(2-3), 249-266.
Dietz, C., & Kiefer, A. (2016). Bats of Britain and Europe: Bloomsbury Publishing.
Duchamp, J. E., & Swihart, R. K. (2008). Shifts in bat community structure related to evolved traits and features of human-altered landscapes. Landscape Ecology, 23(7), 849-860.
Ekman, M., & de Jong, J. (1996). Local patterns of distribution and resource utilization of four bat species (Myotis brandti, Eptesicus nilssoni, Plecotus auritus and Pipistrellus pipistrellus) in patchy and continuous environments. Journal of Zoology, 238, 571-580.
Ethier, K., & Fahrig, L. (2011). Positive effects of forest fragmentation, independent of forest amount, on bat abundance in eastern Ontario, Canada. Landscape Ecology, 26(6), 865-876.
Fahrig, L. (2017). Ecological responses to habitat fragmentation per se. In D. J. Futuyma (Ed.), Annual
Review of Ecology, Evolution, and Systematics, Vol 48 (Vol. 48, pp. 1-23). Palo Alto: Annual
Reviews.
Farrow, L. J., & Broders, H. G. (2011). Loss of forest cover impacts the distribution of the forest-dwelling tri-colored bat (Perimyotis subflavus). Mammalian Biology, 76(2), 172-179.
Fowler, H. G., Silva, C. A., & Venticinque, E. (1993). Size, taxonomic and biomass distributions of flying insects in central amazonia - forest edge vs understory. Revista De Biologia Tropical,
41(3A), 755-760.
Fries, C., Johansson, O., Pettersson, B., & Simonsson, P. (1997). Silvicultural models to maintain and restore natural stand structures in Swedish boreal forests. Forest Ecology and Management, 94(1-3), 89-103.
Fukui, D., Murakami, M., Nakano, S., & Aoi, T. (2006). Effect of emergent aquatic insects on bat foraging in a riparian forest. Journal of Animal Ecology, 75(6), 1252-1258.
Gonsalves, L., Law, B., Webb, C., & Monamy, V. (2013). Foraging ranges of insectivorous bats shift relative to changes in mosquito abundance. Plos One, 8(5), e64081.
Gonzalez, E., Salvo, A., & Valladares, G. (2017). Natural vegetation cover in the landscape and edge effects: differential responses of insect orders in a fragmented forest. Insect Science, 24(5), 891-901.
Grindal, S. D., & Brigham, R. M. (1999). Impacts of forest harvesting on habitat use by foraging insectivorous bats at different spatial scales. Ecoscience, 6(1), 25-34.
Gustafsson, L., Baker, S. C., Bauhus, J., Beese, W. J., Brodie, A., Kouki, J., . . . Messier, C. (2012). Retention forestry to maintain multifunctional forests: a world perspective. BioScience, 62(7), 633-645.
Hillers, A., Veith, M., & Rodel, M. O. (2008). Effects of forest fragmentation and habitat degradation on west African leaf-litter frogs. Conservation Biology, 22(3), 762-772.
Huang, J. C. C., Rustiati, E. L., Nusalawo, M., & Kingston, T. (2019). Echolocation and roosting ecology determine sensitivity of forest-dependent bats to coffee agriculture. Biotropica, 51(5), 757-768.
Humes, M. L., Hayes, J. P., & Collopy, M. W. (1999). Bat activity in thinned, unthinned, and old-growth forests in western Oregon. Journal of Wildlife Management, 63(2), 553-561.
Kalcounis-Rueppell, M. C., Briones, K. M., Homyack, J. A., Petric, R., Marshall, M. M., & Miller, D. A. (2013). Hard forest edges act as conduits, not filters, for bats. Wildlife Society Bulletin, 37(3), 571-576.
Kammonen, J. (2015). Foraging behaviour of Myotis mystacinus and M. brandtii in relation to a big
road and railway in south-central Sweden. (Bachelor's thesis). Swedish University of Agricultural
Sciences, Uppsala.
Kunz, T. H. (1988). Methods of assessing the availability of prey to insectivorous bats. In Ecological
and behavioral methods for the study of bats (pp. 191-210). Washington, D. C.: Smithsonian
Institution Press.
Kunz, T. H., & Lumsden, L. F. (2003). Ecology of cavity and foliage roosting bats. In T. H. Kunz & M. B. Fenton (Eds.), Bat ecology (Vol. 1, pp. 3-89). Chicago: University of Chicago Press. Kurek, K., Tołkacz, K., & Mysłajek, R. (2017). Low abundance of the whiskered bat myotis
mystacinus (kuhl, 1817) in poland – consequence of competition with pipistrelle bats? Applied
Ecology and Environmental Research, 15(4), 241-248.
Law, B., Gonsalves, L., Brassil, T., & Hill, D. (2018). Does thinning homogenous and dense regrowth benefit bats? Radio-tracking, ultrasonic detection and trapping. Diversity, 10(2), 45.
Law, B., Park, K. J., & Lacki, M. J. (2016). Insectivorous bats and silviculture: balancing timber production and bat conservation. In Bats in the Anthropocene: conservation of bats in a changing
world (pp. 105-150): Springer, Cham.
Maad, J., Sundberg, S., Stolpe, P., & Jonsell, L. (2009). Floraförändringar i Uppland under 1900-talet– en analys från Projekt Upplands flora. Svensk Botanisk Tidskrift, 103(2), 67-104.
Maanavilja, L., Aapala, K., Haapalehto, T., Kotiaho, J. S., & Tuittila, E. S. (2014). Impact of drainage and hydrological restoration on vegetation structure in boreal spruce swamp forests. Forest
Ecology and Management, 330, 115-125.
Morris, A. D., Miller, D. A., & Kalcounis‐Rueppell, M. C. (2010). Use of forest edges by bats in a managed pine forest landscape. The Journal of Wildlife Management, 74(1), 26-34.
Norberg, U. M. (1989). Ecological determinants of bat wing shape and echolocation call structure with implications for some fossil bats. In V. H. Hanák, I.; Gaisler, J. (Ed.), European bat research 1987 (pp. 197-211). Prague: Charles University Press.
Nummi, P., Kattainen, S., Ulander, P., & Hahtola, A. (2011). Bats benefit from beavers: a facilitative link between aquatic and terrestrial food webs. Biodiversity and Conservation, 20(4), 851-859. Owen, S. F., Menzel, M. A., Edwards, J. W., Ford, W. M., Menzel, J. M., Chapman, B. R., . . . Miller,
K. V. (2004). Bat activity in harvested and intact forest stands in the Allegheny Mountains.
Northern Journal of Applied Forestry, 21(3), 154-159.
Patriquin, K. J., & Barclay, R. M. (2003). Foraging by bats in cleared, thinned and unharvested boreal forest. Journal of Applied Ecology, 40(4), 646-657.
Peltomaa, R. (2007). Drainage of forests in Finland. Irrigation and Drainage, 56, S151-S159. Pommerening, A., & Murphy, S. (2004). A review of the history, definitions and methods of
continuous cover forestry with special attention to afforestation and restocking. Forestry, 77(1), 27-44.
Roeleke, M., Johannsen, L., & Voigt, C. C. (2018). How bats escape the competitive exclusion principle—Seasonal shift from intraspecific to interspecific competition drives space use in a bat ensemble. Frontiers in Ecology and Evolution, 6.
Russ, J. (2012). British bat calls: a guide to species identification: Pelagic publishing.
Rydell, J. (1993). Variation in foraging activity of an aerial insectivorous bat during reproduction.
Journal of Mammalogy, 74(2), 503-509.
Sachanowicz, K., & Ruczynski, I. (2001). Summer roost sites of Myotis brandtii (Eversmann, 1845) (Chiroptera, Vespertilionidae) in eastern Poland. Mammalia, 65(4), 531-535.
Schmiegelow, F. K. A., & Monkkonen, M. (2002). Habitat loss and fragmentation in dynamic landscapes: Avian perspectives from the boreal forest. Ecological Applications, 12(2), 375-389. Schnitzler, H.-U., Moss, C. F., & Denzinger, A. (2003). From spatial orientation to food acquisition in
echolocating bats. Trends in Ecology & Evolution, 18(8), 386-394.
Sommers, A. S., Rogers, E. J., & McGuire, L. P. (2019). Migration and reproduction are associated with similar degrees of phenotypic flexibility in an insectivorous bat. Oecologia, 190(4), 747-755. Speakman, J. (1991). The impact of predation by birds on bat populations in the British Isles. Mammal
Review, 21(3), 123-142.
Spitzer, K., & Danks, H. V. (2006). Insect biodiversity of boreal peat bogs. Annual Review of
Entomology, 51(1), 137-161.
Struebig, M. J., & Galdikas, B. M. (2006). Bat diversity in oligotrophic forests of southern Borneo.
Oryx, 40(4), 447-455.
Todd, V. L. G., & Waters, D. A. (2017). Small scale habitat preferences of Myotis daubentonii, Pipistrellus pipistrellus, and potential aerial prey in an upland river valley. Acta Chiropterologica,
Tuttle, M. D. (1976). Population ecology of the gray bat (Myotis grisescens): factors influencing growth and survival of newly volant young. Ecology, 57(3), 587-595.
Walsh, A. L., & Harris, S. (1996). Foraging habitat preferences of vespertilionid bats in Britain.
Journal of Applied Ecology, 508-518.
Vaughan, N. (1997). The diets of British bats (Chiroptera). Mammal Review, 27(2), 77-94.
Wermundsen, T., & Siivonen, Y. (2008). Foraging habitats of bats in southern Finland. Acta
Theriologica, 53(3), 229-240.
Vesterinen, E. J., Puisto, A. I. E., Blomberg, A. S., & Lilley, T. M. (2018). Table for five, please: Dietary partitioning in boreal bats. Ecology and Evolution, 8(22), 10914-10937.
Whitaker, J. O., & Karatas, A. (2009). Food and feeding habits of some bats from Turkey. Acta
Chiropterologica, 11(2), 393-403.
Vinnersten, T. Z. P., Ostman, O., Schafer, M. L., & Lundstrom, J. O. (2014). Insect emergence in relation to floods in wet meadows and swamps in the River Dalalven floodplain. Bulletin of
Entomological Research, 104(4), 453-461.
Zukal, J., & Rehák, Z. (2006). Flight activity and habitat preference of bats in a karstic area, as revealed by bat detectors. Folia zoologica, 55(3), 273.
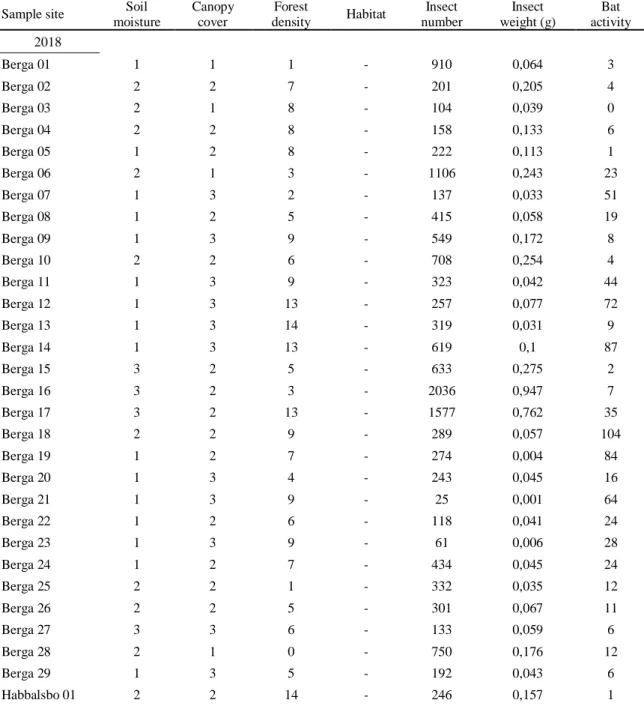
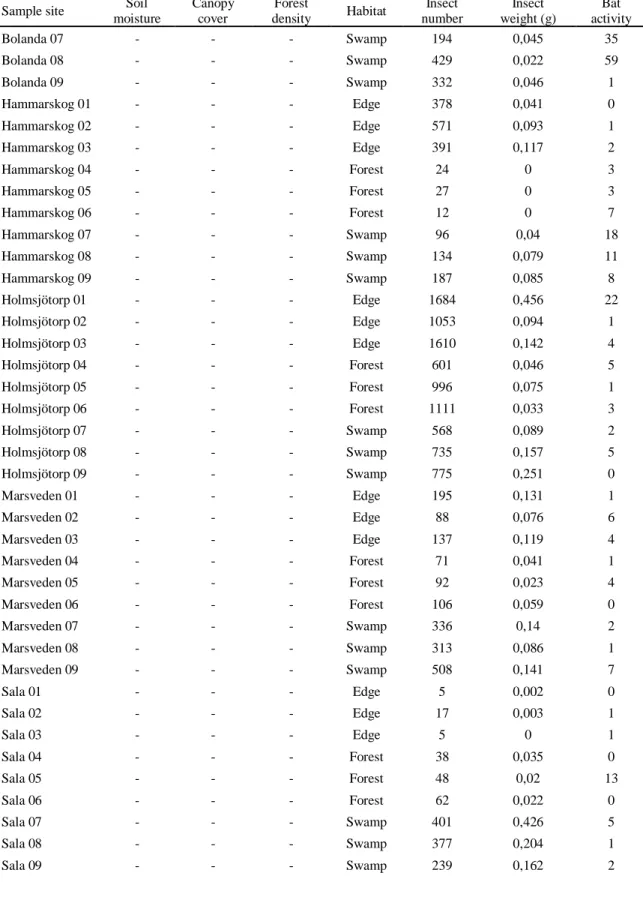
Table A1. Raw data for each sample site. Showing habitat, level of soil moisture (1 = dry, 2 = medium,
3 = wet), level of canopy cover (1 = open, 2 = half-open, 3 = closed), forest density (number of trees/100m2), number of insects, insect weight (g) and number of recorded Myotis.
Sample site Soil moisture Canopy cover Forest density Habitat Insect number Insect weight (g) Bat activity 2018 Berga 01 1 1 1 - 910 0,064 3 Berga 02 2 2 7 - 201 0,205 4 Berga 03 2 1 8 - 104 0,039 0 Berga 04 2 2 8 - 158 0,133 6 Berga 05 1 2 8 - 222 0,113 1 Berga 06 2 1 3 - 1106 0,243 23 Berga 07 1 3 2 - 137 0,033 51 Berga 08 1 2 5 - 415 0,058 19 Berga 09 1 3 9 - 549 0,172 8 Berga 10 2 2 6 - 708 0,254 4 Berga 11 1 3 9 - 323 0,042 44 Berga 12 1 3 13 - 257 0,077 72 Berga 13 1 3 14 - 319 0,031 9 Berga 14 1 3 13 - 619 0,1 87 Berga 15 3 2 5 - 633 0,275 2 Berga 16 3 2 3 - 2036 0,947 7 Berga 17 3 2 13 - 1577 0,762 35 Berga 18 2 2 9 - 289 0,057 104 Berga 19 1 2 7 - 274 0,004 84 Berga 20 1 3 4 - 243 0,045 16 Berga 21 1 3 9 - 25 0,001 64 Berga 22 1 2 6 - 118 0,041 24 Berga 23 1 3 9 - 61 0,006 28 Berga 24 1 2 7 - 434 0,045 24 Berga 25 2 2 1 - 332 0,035 12 Berga 26 2 2 5 - 301 0,067 11 Berga 27 3 3 6 - 133 0,059 6 Berga 28 2 1 0 - 750 0,176 12 Berga 29 1 3 5 - 192 0,043 6 Habbalsbo 01 2 2 14 - 246 0,157 1
Appendix A
Table A1 (continued) Sample site Soil
moisture Canopy cover Forest density Habitat Insect number Insect weight (g) Bat activity Habbalsbo 02 2 2 10 - 675 0,261 19 Habbalsbo 03 7 2 2 - 268 0,221 1 Habbalsbo 04 2 2 1 - 383 0,12 7 Habbalsbo 05 3 3 1 - 197 0,134 14 Habbalsbo 06 3 2 2 - 179 0,14 2 Habbalsbo 07 6 1 2 - 800 0,079 8 Habbalsbo 08 3 2 2 - 182 0,159 36 Habbalsbo 09 1 2 1 - 419 0,134 26 Habbalsbo 10 7 3 2 - 1401 0,209 5 Habbalsbo 11 7 2 2 - 768 0,109 28 Habbalsbo 12 6 2 2 - 453 0,219 8 Habbalsbo 13 0 3 1 - 389 0,077 5 Habbalsbo 14 6 2 2 - 301 0,051 8 Habbalsbo 15 3 2 2 - 384 0,08 9 Jumkil 01 6 1 1 - 229 0,028 12 Jumkil 02 0 1 1 - 553 0,034 1 Jumkil 03 5 2 2 - 1241 0,05 14 Jumkil 04 9 2 1 - 1800 0,167 31 Jumkil 05 1 1 1 - 1171 0,118 4 Jumkil 06 7 2 3 - 1026 0,056 7 Jumkil 07 10 2 2 - 950 0,126 8 Jumkil 08 8 2 2 - 658 0,032 4 Jumkil 09 13 1 2 - 576 0,056 15 Jumkil 10 12 2 3 - 1056 0,288 16 Jumkil 11 7 2 2 - 1490 0,301 249 Jumkil 11:2 8 3 1 - 1169 0,221 408 Jumkil 12 9 2 3 - 961 0,072 49 Jumkil 13 9 2 3 - 1358 0,136 30 Jumkil 14 6 2 2 - 146 0,079 408 Jumkil 15 7 1 3 - 612 0,053 11 Jumkil 16 6 2 2 - 1126 0,241 1 2019 Bolanda 01 - - - Edge 913 0,183 1 Bolanda 02 - - - Edge 880 0,113 1 Bolanda 03 - - - Edge 1855 0,381 1 Bolanda 04 - - - Forest 409 0,061 1 Bolanda 05 - - - Forest 788 0,055 0 Bolanda 06 - - - Forest 861 0,127 2
Table A1 (continued) Sample site Soil
moisture Canopy cover Forest density Habitat Insect number Insect weight (g) Bat activity Bolanda 07 - - - Swamp 194 0,045 35 Bolanda 08 - - - Swamp 429 0,022 59 Bolanda 09 - - - Swamp 332 0,046 1 Hammarskog 01 - - - Edge 378 0,041 0 Hammarskog 02 - - - Edge 571 0,093 1 Hammarskog 03 - - - Edge 391 0,117 2 Hammarskog 04 - - - Forest 24 0 3 Hammarskog 05 - - - Forest 27 0 3 Hammarskog 06 - - - Forest 12 0 7 Hammarskog 07 - - - Swamp 96 0,04 18 Hammarskog 08 - - - Swamp 134 0,079 11 Hammarskog 09 - - - Swamp 187 0,085 8 Holmsjötorp 01 - - - Edge 1684 0,456 22 Holmsjötorp 02 - - - Edge 1053 0,094 1 Holmsjötorp 03 - - - Edge 1610 0,142 4 Holmsjötorp 04 - - - Forest 601 0,046 5 Holmsjötorp 05 - - - Forest 996 0,075 1 Holmsjötorp 06 - - - Forest 1111 0,033 3 Holmsjötorp 07 - - - Swamp 568 0,089 2 Holmsjötorp 08 - - - Swamp 735 0,157 5 Holmsjötorp 09 - - - Swamp 775 0,251 0 Marsveden 01 - - - Edge 195 0,131 1 Marsveden 02 - - - Edge 88 0,076 6 Marsveden 03 - - - Edge 137 0,119 4 Marsveden 04 - - - Forest 71 0,041 1 Marsveden 05 - - - Forest 92 0,023 4 Marsveden 06 - - - Forest 106 0,059 0 Marsveden 07 - - - Swamp 336 0,14 2 Marsveden 08 - - - Swamp 313 0,086 1 Marsveden 09 - - - Swamp 508 0,141 7 Sala 01 - - - Edge 5 0,002 0 Sala 02 - - - Edge 17 0,003 1 Sala 03 - - - Edge 5 0 1 Sala 04 - - - Forest 38 0,035 0 Sala 05 - - - Forest 48 0,02 13 Sala 06 - - - Forest 62 0,022 0 Sala 07 - - - Swamp 401 0,426 5 Sala 08 - - - Swamp 377 0,204 1 Sala 09 - - - Swamp 239 0,162 2
Table A1 (concluded) Sample site Soil
moisture Canopy cover Forest density Habitat Insect number Insect weight (g) Bat activity Sundsveden 01 - - - Edge 515 0,15 0 Sundsveden 02 - - - Edge 386 0,278 3 Sundsveden 03 - - - Edge 495 0,488 0 Sundsveden 04 - - - Forest 58 0,015 1 Sundsveden 05 - - - Forest 48 0,024 0 Sundsveden 06 - - - Forest 36 0,057 1 Sundsveden 07 - - - Swamp 42 0,019 1 Sundsveden 08 - - - Swamp 66 0,047 6 Sundsveden 09 - - - Swamp 71 0,036 5
Appendix B
Table B1. Habitat coverage (ha) and length (km) of edge between forest and open grassland/water for each of the 16 M. brandtii colonies in 2019.
Colony Forest
Swamp
forest Clear-cut Grassland Pasture
Open
wetland Open water
Stream (forest) Stream (open) Stream (open with vegetation) Tree corridor Urban Edge km (forest-open) Edge km (forest-water) Bolanda 152,38 1,31 94,53 54,69 11,29 0 0 0 0 0 0 0 27,5 0,0 Gräsö 236,49 12,13 7,34 35,47 14,75 1,39 2,89 0 0 0 0,74 2,9 22,9 0,3 Habbalsbo 228,92 3,13 26,78 17,49 9,54 4,64 21,45 0,59 0 0 0 1,62 22,1 2,4 Hammarskog 160,48 0 4,37 129,45 4,08 12,17 0,46 0 0 0 0,6 2,52 21,2 0,0 Holmsjötorp 227,38 17,26 28,41 0,69 1,54 12,17 26,71 0 0 0 0 0 12,5 5,4 Jumkil 149,83 3,51 27,88 106,3 22,52 0,26 0 0 0 2,14 1,6 0 23,8 0,0 Kolmården 185,99 28,1 57,18 26,03 8,14 1,61 4,37 0 0 0 0,74 1,98 29,7 0,8 Lågbol 234,48 12,19 39,51 13,96 4,85 2,87 3,16 0 0,1 0 0 3,97 23,8 0,2 Långtora 204,2 0 21,73 75,24 9,53 0,62 0 0 0 0 0 2,82 20,9 0,0 Läby 120,93 97,62 23,67 41,23 9,67 20,23 0,14 0 0 0 0,62 0,16 14,1 0,0 Marsveden 224,84 19,72 33,64 10,88 7,17 1,43 16,44 0 0 0 0 0 14,2 2,5 Orresta 93,62 0 5,04 190,71 14,2 0 1,13 0 0 0 0 9,43 16,4 0,0 Sala 230,49 17,66 16,32 41,87 5,73 2,03 0 0 0 0 0 0 16,3 0,0 Sundsveden 146,14 2,94 1,95 7,11 2,68 2,7 150,58 0 0 0 0 0 10,6 8,3 Ullunda 65,99 0 9,06 198,29 11,76 0 0 0,8 4,86 4 0 19,35 18,2 0,0 Ängsö 133,32 0 0 100,89 27,29 8,91 40,31 0 0,52 0 0 2,87 22,6 3,2 Range 66-236,5 0-97,6 0-94,5 0,7-198,3 1,5-27,3 0-20,2 0-150,6 0-0,8 0-4,9 0-4,0 0-1,6 0-19,4 10,6-29,7 0-8,3