By Jens Alm
Play the Game/
Danish Institute for Sports Studies
May 2012
World Stadium Index
play
home for the homeless questions in sportthe
game
Stadiums built for major sporting events
– bright future or future burden?
2 Title
World Stadium Index
Stadiums built for major sporting events – bright future or future burden?
Author Jens Alm
Other contributors to the report
Lau Tofft-Jørgensen, Henrik Brandt and Søren Bang
Cover layout Agnethe Pedersen
Text layout
Danish Institute for Sports Studies
Cover photos
Jon Candy/Flickr, Allianz SE
Edition
1. Edition, Copenhagen, May 2012
ISBN
978-87-92120-46-5
978-87-92120-47-2 (electronic)
Publisher
Danish Institute for Sports Studies/Play the Game Kanonbådsvej 12 A DK-1437 København K T: +45 32 66 10 30 F: +45 32 66 10 39 E: idan@idan.dk W: www.idan.dk
The report can be quoted in parts when crediting Play the Game/Danish Institute for Sports Studies
3
World Stadium Index
Stadiums built for major sporting events
– bright future or future burden?
4
Content
Preface ... 5 Summary ... 6 1. Introduction ... 8 2. Method ... ‘12 3. Olympic stadiums ... 174. FIFA World Cup stadiums ... 27
2002 FIFA World Cup in Korea/Japan ...28
2006 FIFA World Cup in Germany ... 32
2010 FIFA World Cup in South Africa ... 37
5. UEFA Euro stadiums ... 48
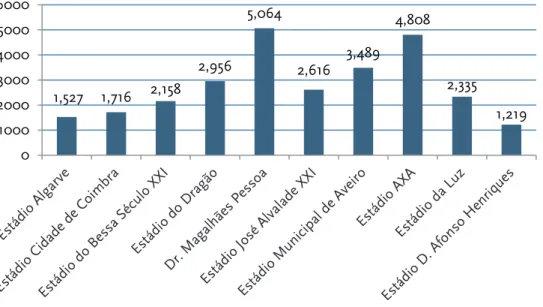
UEFA Euro 2004 in Portugal ... 48
UEFA Euro 2008 in Austria/Switzerland ... 60
6. Africa Cup of Nations stadiums ... 69
2008 Africa Cup of Nations in Ghana ... 70
2010 Africa Cup of Nations in Angola ... 72
7. The continental sporting events ... 75
All-Africa Games stadiums ... 75
Asian Games stadiums ... 76
Pan-American Games stadiums ... 79
Commonwealth Games stadiums ... 80
8. China and the Chinese stadium diplomacy ... 84
9. Analysis ... 88
10. The Future ... 94
UEFA Euro 2012 in Poland/Ukraine ... 94
2012 Summer Olympics ... 96
References ... 98
Appendix 1: World Stadium Index ... 105
Appendix 2: Stadium questionnaire – quantitative ... 110
Appendix 3: Questionnaire – qualitative ... 112
Appendix 4: Overnight stays in hotels in Algarve ... 115
5
Preface
This report from the Danish Institute for Sports Studies/Play the Game has the objective to obtain a greater understanding of the sporting legacy of stadiums built for or having undergone major renovations to host a major international sporting event. Several brand new stadiums have been built or renovated for specific events, but the legacy of such stadiums and to what extent they are used after the event are in many cases unclear.
The study detailed in this report was conducted in order to assess the sustainability of stadiums built for major international sports events in terms of sporting and financial sustainability. Do substantial
investments in stadiums for mega events lead to significant utilisation after the event? Is it possible for all stadiums to be utilised to a higher extent after the major sporting event? Is there a complex of general problems present, and if so: How and where are they occurring? How can we avoid the potential
problems? Are there any model examples? And why have they succeeded?
The overall results presented in the report allow us to answer at least some of the questions related to stadiums that have been constructed or undergone major renovations due to a major sporting event.
We wish to invite persons with an interest in the field to contribute with more precise and additional data in order for us to be able to continually develop and expand the stadium data set.
The author and the Danish Institute for Sports Studies/Play the Game wish to thank the stadiums that have chosen to participate in the survey by submitting information. A special thanks goes to our local informers Francisco Pinheiro, Sahr Morris Jr., Junmei HU, Clemens von Veltheim, Honorata Jakubowska, Simon Pile, Hiroto Shoji, Tolga Senel and Özden Fedakar, who have assisted with additional country specific research. We also want to thank the stadium expert and founder of Xperiology.com, Ian Nuttall, for his inspiration and contribution to developing this study. Furthermore, the author wants to thank his colleagues at the Danish Institute for Sports Studies/Play the Game for their input and support in the process and for their assistance in translating, editing and layouting this report. Without their help the work in producing this report would have been far more difficult.
Finally, the Danish Institute for Sports Studies/Play the Game wants to thank the Danish Gymnastics and Sports Associations (DGI), Team Danmark, the Danish Company Sports Federation, and the National Olympic Committee and Sports Confederation of Denmark (DIF) for their general financial contribution to this study and other research activities connected to the 7th
Play the Game conference held in Cologne, Germany, on October 3-6, 2011.
The Danish Institute for Sports Studies/Play the Game, Copenhagen, Denmark, May 2012
Jens Alm Henrik H. Brandt
Analyst and main author of the report Director
6
Summary
The present study has looked into 75 venues in 20 countries that have been built or undergone major renovations in order to host a major international or continental sporting event. The aim of the study has been to examine how and to what extent stadiums built for these events are utilised after the events have taken place.
The main variable in the report is the number of spectators per season/year. By dividing the attendance figures with the stadiums’ capacities, we have created an index that has made it possible to compare the stadiums included in the study in a simple manner. The index has also made it possible to visualise the state of each stadium built or renovated for particular events, and compare and examine the events to determine which types of events have been most successful in terms of sporting legacy.
Even though the study shows that some stadiums have had positive legacies and satisfying developments post-event, it also demonstrates that numerous stadiums that have been built or renovated for major events have had problematic legacies. A majority of the stadiums included in the study have had problems attracting larger crowds, and in general their attendance figures are low.
The lack of an attractive anchor tenant from the outset or weak attendance figures are the main reasons why some stadium owners have financial problems and why several stadiums have a negative sporting legacy.
Sports federations should be more cautious when awarding major events and to a higher degree award the events to countries or cities in a manner that gives these hosts a realistic chance of converting the short-lived honour of hosting a major event into a long term stadium legacy.
However, it is not only the sports federations’ fault that several stadiums stand empty. The host countries and cities also have a responsibility as they ultimately (almost every time) pay the bill. Countries and cities should have a greater awareness of what kind of impact hosting an event really has. They should take a longer time perspective when they consider becoming hosts and be more focused on what their legacy will be after the event is over.
The 2006 FIFA World Cup in Germany is the single most successful event in the study as viewed in this context, as a majority of the stadiums have had a large inflow of spectators after the World Cup.
That the World Cup stadiums in Germany would continue to have good attendance figures was not a big surprise in view of Germany’s relative wealth, strong football tradition and a local football league that has highest attendance figures in the world. Nor was it surprising that several of the stadiums built or renovated for UEFA Euro 2004 in Portugal have turned out to have a problematically legacy. Aside from three teams, attendance figures in Portuguese football are low.
The experiences from Portugal show that the mantra ‘If you build it, they will come’ should not be seen as a trustworthy solution. It requires more than a new stadium to get an inflow of spectators. Several UEFA
7 Euro 2004 stadiums have since been put up for sale, and the majority have very low attendance figures in relation to their capacities.
Instead of taking local needs into account beforehand, many stadium owners have, to a great extent, chosen to customise their stadiums according to external requirements. This has led to the problem that many stadiums cannot be adapted for daily needs after the event. This has not only resulted in empty stadiums and negative sporting legacies, but also higher construction and maintenance costs for stadium owners, who are typically cities and municipalities. The cost of a stadium does not end with its
completion. Weekly events with good attendance figures are needed if a stadium is to avoid becoming a financial burden and causing great financial losses for its owner(s).
8
1. Introduction
On the 2nd December 2010 in Zürich, Switzerland, when FIFA awarded Russia and Qatar hosting rights for the 2018 and 20221
World Cups respectively, it was also implicitly decided that over 20 new stadiums would be built.
Neither Russia nor Qatar have a satisfactory stadium infrastructure in place today and thus do not meet FIFA’s requirements2 for stadium capacity within a host country. However, both Russia and Qatar will, according to FIFA's evaluation of the 2018 and 2022 World Cup applications, invest massive sums in order to meet FIFA's requirements. Russia has an official stadium budget of $3.8bn. for the 2018 FIFA World Cup, while Qatar has agreed to a tidy sum of $3bn.3
But Russia and Qatar are not the only applicants willing to invest substantial amounts to host major international and continental sporting events. Many other countries and cities are looking to stage these events not only for sporting motives, but also in an attempt to promote their host city or country or reach other economic or political objectives.
Major sporting events mean major stadiums, and it is the stadiums only that this report will examine. While the construction of such stadiums may also reflect architectonic or political ambitions, the focus of this report is solely on the intended long-term use of the stadiums. What happens to the stadiums after the major events are over? Do they get utilised and to what extent? Is it possible to see any pattern in the investments and their after use? Do the stadiums as the most iconic buildings of most mega events contribute to the promised positive legacies of mega events – or should stadiums rather be considered the symbol of an arms race for big international sports events that has been allowed to spiral out of control?
The total construction cost of the venues included in the study is nearly $14.5 bn. Significant investments are therefore required to host a major sporting event – investments that come with enormous
expectations and promises. But are the promises fulfilled? Are the stadiums able to live up to the high expectations that were present prior to the event?
This is not a new issue. Brand new stadiums have always been built for major sporting events. Their design and shape often attract a lot of attention, so the stadiums therefore tend to seen, beyond the sport itself, as the very symbol of a major sporting event.
But as it is evident that several of the stadiums that have been constructed for major events have not had a successful legacy in terms of attendance, this report examines whether such problems are relevant and what they might look like.
1 http://www.fifa.com/worldcup/russia2018/news/newsid=1344698/index.html 2 http://transparencyinsport.org/The_documents_that_FIFA_does_not_want_fans_to_read/PDF-documents/%2815%29Stadium-Agreement.pdf 3 http://www.fifa.com/mm/document/tournament/competition/01/33/59/45/bidevaluationreport.pdf p. 28 & 32
9 Basically, the aim of study is to examine whether stadiums built for major international or continental sporting events are utilised after these events and to what extent. How many people visit the stadium per season/year? What kinds of events are taking place in the stadiums?
As an operational and relatively simple measure this report is primarily based on the number of
spectators visiting each stadium for events taking place at the pitch of the stadium in 2010. However, the study also considers qualitative data in the discussion of why some stadiums might succeed in attracting people, while others do not. Which of the stadiums has been most successful in terms of their number of spectators? Why have they been successful? Which of the stadiums have had difficulties attracting
spectators after the event? And why have these venues faced problems?
The growth of major events
The Olympic Summer Games and the men’s football World Cup and European Championships have developed and grown substantially in recent years.
In terms of the number of participating countries, sports disciplines and athletes the Summer Olympics have had an increase from Atlanta 1996 to Beijing 200845
, and a similar trend can be discerned from the Winter Olympics from Lillehammer 1994 to Vancouver 2010.67
As football has become increasingly globalised, commercialised and professionalised, both FIFA and UEFA have chosen to expand their respective main events, FIFA World Cup and UEFA Euro, making it possible for more countries to participate in the final stage of the events. FIFA, for example, has expanded the number of participating countries in the World Cup finals from 24 to 32 since the tournament in France in 1998. The confederations that benefited most from this development were the Confederation of African Football (CAF) and the Asian Football Confederation (AFC). CAF received two additional places and now has five World Cup places, while the AFC’s number of World Cup places doubled from two to four.
Another significant change reflecting this development in football is the decision to introduce a rotation system when it comes to the location of the FIFA World Cup. The policy arose after South Africa failed to be awarded FIFA World Cup in 2006 after a very tight bidding contest with Germany, which set forth the idea that the World Cup should rotate between the continents. On this ground it was decided that the World Cup 2010 would be awarded to an African country, while the 2014 World Cup should take place in South America.8
However, FIFA's policy has undergone changes since its introduction, and now all
4 http://web.archive.org/web/20080822100835/http://www.olympic.org/uk/games/past/index_uk.asp?OLGT=1&OL GY=1996 5 http://en.beijing2008.cn/news/official/preparation/n214496035.shtml 6 http://www.olympic.org/vancouver-2010-winter-olympics 7 http://www.olympic.org/lillehammer-1994-winter-olympics 8 http://news.bbc.co.uk/sport2/hi/football/7067187.stm
10 member countries of FIFA can apply for the World Cup, as long as a country from the same confederation has not arranged any of the last two World Cup finals.9
Just like FIFA, UEFA has also made some structural changes. The UEFA Euro finals expanded from eight teams in Sweden in 1992 to 16 teams in England in 1996, and for UEFA Euro 2016 in France the event will grow from 16 to 24 participating teams, nearly half of UEFA's 53 member countries. Unlike FIFA, UEFA does not have an explicit rotation system. All countries that are members of UEFA have the same opportunity to apply to host the finals. However, based on the host countries chosen for the event in recent years one can argue that UEFA has an underlying wish to spread the event around.
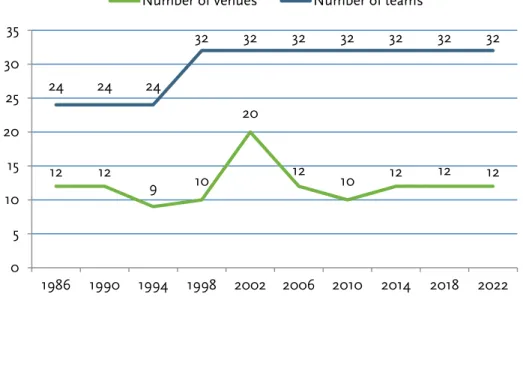
One could expect that the expansion of these events to include a greater number of participant countries would lead to more stadiums being used, but this is not entirely true. As figure 1.1 below shows, 12 stadiums were utilised for FIFA World Cup 1986 in Mexico and during the subsequent World Cup in Italy in 1990. Both tournaments took place before FIFA decided to expand the World Cup finals with an additional eight teams.
12 stadiums will also be used at the upcoming World Cup in Brazil in 2014 and the consecutive events in Russia and Qatar, where 32 teams will participate. This determines that expansion has not influenced the number of venues required to host the event. The exception is Korea/Japan in 2002, which was played in 20 venues, partly for political reasons. We will return to the FIFA World Cup and the 2002 FIFA World Cup stadiums in Korea/Japan later in this report.
Figure 1.1: Number of participating teams and utilised venues FIFA World Cup 1986-2022
9 Ibid. 12 12 9 10 20 12 10 12 12 12 24 24 24 32 32 32 32 32 32 32 0 5 10 15 20 25 30 35 1986 1990 1994 1998 2002 2006 2010 2014 2018 2022
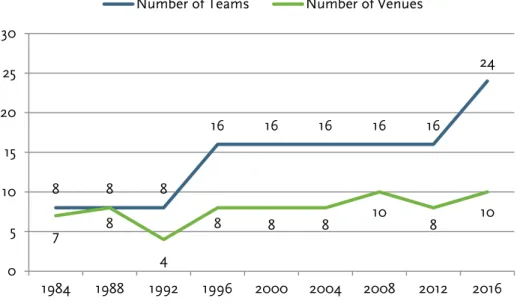
11 The number of venues used for the European Football Championship has not changed in accordance with UEFA's gradual expansion of the tournament. The most notable exception to this relatively constant trend was in fact a decrease in the number of venues used for UEFA Euro 1992 in Sweden.
Figure 1.2: Number of participating teams and utilised venues UEFA Euro 1984-2016
Only four stadiums were utilised during the tournament in Sweden, which may be seen as comparatively low, but also as proof that it is possible to host a major event with only a few main stadiums. The main reason why so few stadiums were used is that Sweden had only four stadiums at that time that were suitable for hosting UEFA Euro matches and refused to construct any new stadiums up to the event.
As figure 1.2 above shows, UEFA Euro 1984 in France and the subsequent event in Germany were the events where most venues in relation to participating teams were utilised. Germany already had existing and sufficient stadium facilities before the 1988 event, while France had to build two new stadiums and make major renovations on several others before its event.
As stated above, it is not the expansion of teams in the World Cup and UEFA Euro that has resulted in more stadiums being built for the events. Instead, the answer lies in FIFA and UEFA’s stadium specific requirements1011
. Stadium requirements set for the Olympic Games and other major sporting events have also resulted in many host countries needing to build new stadiums or make significant upgrades to older ones in order to host these events.
A more detailed review of FIFA and UEFA’s stadium requirements will be given at the beginning of chapters 4 and 5. 10 http://transparencyinsport.org/The_documents_that_FIFA_does_not_want_fans_to_read/PDF-documents/%2815%29Stadium-Agreement.pdf 11 http://www.uefa.com/MultimediaFiles/Download/Regulations/uefa/Others/84/03/26/840326_DOWNLOAD.pdf 8 8 8 16 16 16 16 16 24 7 8 4 8 8 8 10 8 10 0 5 10 15 20 25 30 1984 1988 1992 1996 2000 2004 2008 2012 2016
12
2. Method
Selection
The study's initial phase included 65 stadiums in 20 countries – stadiums which have been constructed or have undergone significant renovations in order to host an international or continental sporting event. The sports events which initially formed the basis of the study’s selection of venues were the Olympic Summer and Winter Games, the FIFA World Cup, UEFA Euro, Africa Cup of Nations, All-Africa Games, Asian Games, Pan-American Games and Commonwealth Games.
However, during the report’s progress we included a few cities that had unsuccessfully bid to host the Olympic Games. So in light of this and other methodological adjustments, the study has been expanded to comprise 75 stadiums in 20 countries on six continents.
It would have been possible to include even more new and modern stadiums in the study if the focus had been broader. During recent years numerous new stadiums and venues have been built for concerts and other cultural events as well as sport. However, an inclusion of these many venues would have resulted in a burdensome number of stadiums for the analysis.
Another choice made was to only focus on the main stadium of the Olympic Summer and Winter Games, All-African Games, Asian Games, Pan-American Games and Commonwealth Games. This means that many smaller stadiums and sports venues built for these events have not been included in the study. The choice to include only the main stadiums can be justified by the fact that they are often the venues in which the host’s largest single investment is made. These venues are often ascribed a symbolic or iconic value for the mega events and their legacies and receive most attention. Furthermore, these venues’ capacities are comparable to those of the stadiums that stage the major football events.
For the FIFA World Cup, UEFA Euro and Africa Cup of Nations we have chosen to include all of the stadiums that have been built or have undergone major renovations for these events. This means that venues were not included in the study if they already existed and were suitable or almost suitable for the event before the host city/country was selected.
In the study we have chosen to focus in greater depth on a few stadiums per event, both stadiums that have done well and stadiums that not have done so well after hosting an international or continental sporting event. The reason why we have chosen these case studies is that we have good data available on certain stadiums and these stadiums have interesting backgrounds and sporting legacies.
As stated above, only events that have taken place on the pitch after the major event has taken place, e.g. football games and concerts, are included in the study. No accounts have been made of the business events or stadium tours that have subsequently taken place at each stadium. The main reason for this omission is that the venues were constructed with the primary purpose of holding major events like sporting events and cultural events. If they were intended to be a forum for business events, a pure conference centre would have been significantly cheaper to construct and maintain.
13 A few Olympic stadiums in particular have reduced their capacities after the event. We have chosen to use their final venue capacities in this study simply because it is our intention to provide a fair picture of the number of spectators in relation to the capacity of each venue. Otherwise, the report’s figures and numbers would be misleading, because they would have judged the proportion of spectators attending events held after the major event against the venues’ capacities during the major event. This is also the case when the price per seat is presented since only the final configuration is relevant for the long term use of the stadium.
Questionnaire
The study began with desk research in which all adequate information about the stadiums included in the study was collected from available sources – i.e. stadium websites and press reports. Following the initial desk research, a questionnaire (see Appendix 1) was created and subsequently sent out to each stadium owner/stadium operator in order to get answers to the questions for which we had no information, and also in order to verify the information we had found via the desk research. The focus of the questionnaire was on the number of tickets sold and the number of events taking place at each venue. The
questionnaire was supplemented with basic facts and technical information about each venue.
Only 14 stadiums chose to respond to the questionnaire, giving a relatively low response rate of 18.6 per cent. There were cases, especially some venues in Africa, where it was impossible to find any contact details for either the owner or the operator of the stadium. Therefore, due to the low response rate and our intention to give the study a qualitative angle, we contacted sources who either had knowledge about a specific venue or area or spoke the language in the country where we wanted to obtain data.
The initial questionnaire was supplemented at this stage with qualitative questions (see Appendix 2) and sent out to our local sources. The information provided by our network of local sources in many of the countries gave us a greater opportunity to create an accurate picture of the venues and, to some degree, overcome the lack of figures and numbers on certain venues.
Methodological Problems
It has not been possible to obtain adequate information about all of the included stadiums, neither through primary nor secondary sources, which has resulted in a lack of information about certain venues mostly concerning the most significant variables in our study: numbers of tickets sold and numbers of events. Although it is generally difficult to obtain data on numbers of tickets sold or total attendance figures per season/year, this problem is even more pronounced for the African stadiums that have hosted either the Africa Cup of Nations or All-Africa Games. The lack of designated long-term management, sales or PR-infrastructure in several of the selected stadiums is striking taking into the account the significant investments made in stadium infrastructure to ensure long-term use after the initial mega event.
In some cases, when the owner or operator of a certain venue has not been able or willing to state the figures, it has been possible to find estimates through online sources of attendance numbers for most of the events which have taken place in the venues. However, finding these numbers has proven
14 taken place. This means that we are not able to present the total attendance numbers or a qualified estimate for all cases. It is, however, interesting in itself that there are certain venues built to host major sporting events where adequate information about the venues is not available in any form.
The main reason why adequate information has not been available in some cases is primarily the lack of answers from stadium owners and operators, but obtaining trustworthy information through desk research and local sources is also a challenge.
Another problem that arose during the study was a discrepancy between the number of tickets sold and the number of spectators per season/year. The study's questionnaire was based on the number of tickets sold, but during the study it became apparent that the numbers of total spectators were much easier for us and our sources to obtain. The figures presented in this study are therefore the attendance figures and not the number of tickets sold as originally intended.
The challenges in collecting reliable data from all stadiums meant that some uncertainties, especially regarding the utilisation of single stadiums, could not be avoided. Despite these shortcomings, we still believe that the general trends described in this report are valid. But the report should be seen as a first step in getting a more comprehensive picture of stadium investments, and further research must eventually fill out some of the gaps. It is also the reason why we invite others with interest in the field to contribute with more precise data, if possible.
Comparison of stadiums
A major part of this report is based on comparisons of the different venues. But how should we compare the different venues constructed for various events held at different times and in different countries?
To make these comparisons as consistent as possible and to create an accurate picture, we have chosen to include different variables to help us convey as complete a picture as possible on the state of the individual venue.
Capacity, price and the World Stadium Index
A relatively simple way to compare the stadiums is to look closely at what each venue has cost to build. Although construction prices give an important indication of which events have been the most and least expensive to host, it can be misleading to focus only on the respective venues’ total construction costs.
Calculating the price per seat gives a more adequate picture of what the owners have got for their invested money in terms of capacity. But although these two price variables play a significant role in this report, they are rather superficial and do not provide an indication of how much the venues are used.
We have therefore chosen to complement these variables with an index that goes beyond price and instead focuses on the number of spectators visiting the stadiums each season/year in relation to each stadium's capacity – an index we have chosen to name the ‘World Stadium Index’. The index is a result of the relationship between the number of spectators per season/year and the stadium's capacity. To further clarify the index we will give an example below with a fictional venue.
15 If we suppose that the fictional Victoria Stadium has a capacity of 55,000 spectators and the venue had 456,789 visitors in 2010, this would result in an index number of 8.3. The World Stadium Index represents how many occasions per season/year the venue theoretically is filled up. In Victoria Stadium's case, this would represent slightly more than eight times.
One must also take into account other variables that can measure whether a venue is successful or not. But even if the World Stadium Index does not completely show the success of a venue, it is a valuable indicator which demonstrates the sporting legacy and the operators' ability to fill the stadium in relation to its capacity in a simple way. The index is also a valuable and significant indicator that can be used to rank the venues.
Another method, which is not used in this report, would be to compare the stadium's capacity with the average attendance. If Victoria Stadium, with its capacity of 55,000, had six events with an average attendance of 53,123, it would result in an utilisation rate of 96 per cent. This indicates that it is possible to fill the stadium on certain occasions, but the disadvantage of this approach is that it does not take into account the total number of spectators or events per season/year. Despite the stadium’s relatively high utilisation rate when events do take place, its low number of events per year means that its number of spectators per year is also relatively low.
GNI Index
To be able to compare venues which have been constructed at different times, for different prices and in different countries, and to further deepen the study's analysis, we have chosen to include the variable gross national income (GNI) per capita, purchasing power parity (PPP) from 2010 in the study.
The World Bank's definition of GNI per capita is:
"GNI per capita based on purchasing power parity (PPP). PPP GNI is gross national income (GNI) Converted to international dollars using purchasing power parity rates. An international U.S. dollars hock the Sami purchasing power over GNI as a U.S. dollar hock into the United States. NCI is the sum of value added by all resident Producers plus any product Taxes (less subsidies) not included in the valuation of output plus net receipts of primary Income (Compensation of Employees and Property Income) from abroad."12
The GNI per capita is implemented in order to obtain an index number that makes it possible to do a more precise comparison of the construction costs measured by price per seat between countries and venues. This is done by dividing the price per seat for each venue with the GNI per capita figure in the country in which the stadium is built.
A GNI Index also highlights which countries and cities have made the biggest and the smallest investments in relation to their population’s purchasing power parity. Is it, for example, financially or
12
16 morally feasible if the price per seat is equal to the annual purchasing power parity per capita in a
country?
Along with World Stadium Index, the GNI Index will serve as an indicator of the legacy of each stadium and event and indicate whether the money invested in the stadiums can be seen as a good or poor investment.
Once again we can use the fictive Victoria Stadium as an example: Victoria Stadium cost $350 million to construct and has a capacity of 55,000 giving a price per seat of $6,364. The stadium has been built in a country with a GNI per capita of $15,250, which results in a GNI Index number of 0.40. Unlike the World Stadium Index, the GNI Index should be as low as possible. In this case, the index 0.40 represents about 50 per cent of a person's purchasing power parity per year in the country where Victoria Stadium has been built.
Currency
If not stated, all prices are in U.S. dollars ($). When the price has only been available in the domestic currency, we have converted the price into U.S. dollar using the exchange rate between the domestic currency and the average U.S. dollar rate during the year the stadium was completed. Inflation is taken into account, and therefore, unless otherwise indicated, all prices are under the monetary value of 2010.
17
3. Olympic stadiums
We have included eight Olympic stadiums in the study and we have chosen to include venues for the Summer and Winter Games as well as stadiums that have been constructed as a consequence of an Olympic bid from a candidate city which ended up not being awarded the Olympic Games.
As the figures below show, the main stadiums for the Summer Olympics are much more expensive to construct and modernise than the corresponding venues for the Olympic Winter Games. The total costs of the Olympic stadiums are just over $2 bn. giving an average price of close to $270 million per venue.
Figure 3.1: Construction price Olympic stadiums 1996-2010 (million dollars)
All prices in 2010 dollar value
Figure 3.2: Price per seat Olympic stadiums 1996-2010 (dollars)
All prices in 2010 dollar value
144 104 428 373 67 583 107 346 0 200 400 600 800
Atatürk Olympic Stadium BC Place Beijing National Stadium Olympic Stadium Spiros Louis Rice-Eccles Stadium ANZ Stadium Nagano Olympic Stadium Turner Field Contruction Price 6908 3571 6978 1448 5361 5355 1905 1879 0 1000 2000 3000 4000 5000 6000 7000 8000
Turner Field Nagano Olympic Stadium ANZ Stadium Rice-Eccles Stadium Olympic Stadium Spiros Louis Beijing National Stadium BC Place Atatürk Olympic Stadium Price per Seat
18 One of the explanations why the stadiums for the Olympic Summer Games are more expensive to
construct is that the capacity in general is significantly higher for those venues than for the Winter Olympic venues. Often it is also necessary for the hosts of the summer Olympics to build a main stadium, because the majority of the candidate cities do not have a stadium which is big enough and provides running tracks. These problems are not present at the Winter Olympics. The stadiums that are used for the opening and closing ceremonies at the Winter Olympics do not have to take any specific sport on the Olympic program into account. None of the main venues for the Winter Olympics, which are included in this study, have hosted an Olympic sport. They were constructed for ceremonial purposes.
Of the eight Olympic venues included in the study, only the Beijing National Stadium lacks a permanent anchor tenant. The other venues have one or several tenants. However, there is a big difference between the venues in the extent to which the tenants utilise the stadium and the number of other events taking place in the stadium.
1996 Summer Olympics, Turner Field, Atlanta in USA Construction price: 346 million
Capacity: 49,586
Attendance in 2010: 2,510,119 World Stadium Index: 50.6
After the Olympics the local baseball team, Atlanta Braves, chose to remove the running track, lower the capacity and convert the Centennial Olympic Stadium, now Turner Field, into a ballpark for baseball.13 The investment cost $40 million, equal to $54 million in 2010 value. It has proven to be a successful
investment in terms of attendance and over the past three seasons up until the time of writing the stadium has hosted more than 80 baseball games per season, including the annual game between the college teams Georgia and Georgia Tech.14
In the past seasons the stadium attracted over 2.5 million spectators, and the many baseball games per season had of course a significant impact on the attendance figures. Major League Baseball (MLB), the league in which Atlanta Braves play, is the most popular league in the world in terms of the total number of spectators. Had the Braves not chosen to convert the stadium into a ballpark that met the local needs, the venue could have had some of the problems another big stadium in Atlanta, Georgia Dome, which has seating for more than 70,000 spectators, is facing.15
1998 Winter Olympics, Nagano Olympic Stadium, Nagano in Japan Construction price: 107 million
Capacity: 30,000
Attendance in 2010: 17,828 World Stadium Index: 0.6
13 http://www.nytimes.com/specials/olympics/0730/oly-stadium-braves.html 14 http://www.georgiadogs.com/sports/m-basebl/spec-rel/042810aab.html 15 http://www.gadome.com/about/Default.aspx
19 After the Winter Games in Nagano in 1998, the Olympic stadium has primarily been used for baseball, both professional and amateur. But the stadium is also used for the Nagano Olympic Commemorative Marathon, where the runners cross the finish line inside the stadium.
The main tenant is the semi-professional baseball team Shinano Grandserows, which plays in the Baseball Challenge League. The league was founded in 2007 and includes six teams. Unlike the Atlanta Braves, Shinano Grandserows has a more leisurely schedule playing only 11 games in 2010. In terms of attendance the contrast is even bigger. Throughout the whole season, Shinano Grandserows only had around 18,000 spectators, which is relatively poor for an arena of Nagano Olympic Stadium's size.
2000 Summer Olympics, ANZ Stadium, Sydney in Australia Construction price: 583 million
Capacity: 83,500
Attendance in 2010: 1,195,696 (2006) World Stadium Index: 14.3
ANZ Stadium in Sydney, Australia, has had, as shown by the figures above, both the highest construction price and the highest price per seat. Just as Turner Field in Atlanta, the stadium in Sydney chose to remove the running track after the Olympics and reduce the stadium’s capacity. The intention in Sydney was similar: to meet local sporting needs and to be able to host as many events as possible. Both rugby and Australian Rules football, which are not on the Olympic programme, are considerably popular in the country, and no less than five teams belonging to these sports use ANZ Stadium as their home ground. Athletics has, apart from the Olympics and the World Championships, difficulties in attracting larger crowds to the stadiums so the removal of these tracks in Atlanta and Sydney after the Games was not surprising.
As ANZ Stadium did not wish to participate in the study, the latest available and reliable data about the stadium's total attendance figures is from 2006. In ‘Idrættens største arenaer’ (2007) the authors state that ANZ Stadium had nearly 1.2 million spectators in 2006.16
Just like Rice-Eccles Stadium in Salt Lake City and Turner Field, ANZ Stadium has up to now not held an international or continental major sporting event since it hosted the Olympics. However, 2015 will be a significant year for Australia, as two major sporting events will be held in the country.
The country will for the first time host the AFC Asia Cup,17 the equivalent of the UEFA Euro and Copa América, and ANZ Stadium is expected to be the tournament’s final venue.1819
The other major event, the
16
Almlund, U., S. Bang & H. Brandt (2007): Idrættens største arenaer – fra OL til hverdag. P. 15
17 http://www.the-afc.com/en/news-centre/news/32028-australia-to-host-2015-afc-asian-cup 18 http://www.austadiums.com/news/news.php?id=461 19 http://theworldgame.sbs.com.au/asian-cup/news/1015189/Cities-fight-for-Asian-Cup-motza
20 Cricket World Cup, will be jointly hosted by Australia and New Zealand20
and ANZ stadium is likely to be one of the potential venues.21
Australia was one of the candidates to host 2022 FIFA World Cup, where ANZ Stadium, according to the Australian application, would have hosted either the opening match or the final.22 However, FIFA decided to award the event to Qatar, which prevents a possible World Cup in Australia in the foreseeable future due to FIFA’s rotation policy. Australia is a member of the Asian Football Confederation, along with Qatar, so it is not eligible to host the World Cup until two championships after another country in its confederation has hosted the event. Australia also applied to host the FIFA Women's World Cup in 2011, but later decided to withdraw its application.23
2002 Winter Olympics, Rice-Eccles Stadium, Salt Lake City in USA Construction price: 67 million
Capacity: 46,178
Attendance in 2010: 332,482 World Stadium Index: 7.2
Rice-Eccles Stadium hosted the opening and closing ceremony of the Winter Olympics in Salt Lake City in 2002. Two stadiums had previously existed on the site where Rice-Eccles Stadium was built, and when Rice-Eccles was completed in 1998 it replaced the Rice Stadium. The new stadium has a capacity of 46,178 and cost about $66 million to construct. Four main partners shared the investment, including the Salt Lake City Olympic Committee and the University of Utah.24
The stadium is owned and operated by the University of Utah and the anchor tenant is the American football team Utah Utes, which plays in the American College League NCAA. However, the team played only six home games in 2010 and only three other events took place in the stadium. Although the Utah Utes’ games are usually well attended, 45,459, the total attendance number for the stadium is quite low due to the limited number of Utah Utes games and other major events.
2004 Summer Olympics, Olympic Stadium Spiros Louis, Athens in Greece Construction price: 373 million
Capacity: 69,618
Attendance in 2010: 1,234,379 World Stadium Index: 17.7
The Olympic Stadium in Athens, Olympic Stadium Spiros Louis, was built in 1982, but underwent significant renovations for the Summer Olympics in 2004. Thanks to two of the largest football clubs in
20 http://icc-cricket.yahoo.net/events_and_awards/CWC/overview.php 21 http://www.cricketworldcup2015.in/venues 22 http://www.fifa.com/mm/document/tournament/competition/01/33/74/50/b3ause.pdf p. 11 23 http://www.fifa.com/aboutfifa/footballdevelopment/news/newsid=614495/index.html 24 http://utahutes.cstv.com/trads/utah-trads-ricestadium.html
21 Greece, Panathinaikos FC and AEK Athens FC, who use the stadium as their home ground, the Olympic stadium has a fairly high attendance number.
The stadium is not ideal for football matches as its running track has been kept. But as the two clubs’ plans to build their own stadiums have not been fulfilled, and considering the current condition of the Greek economy, it is likely that for at least the next couple of years the two clubs will continue to play their home games at the Olympic Stadium Spiros Louis, which is owned and operated by the OAKA and the Greek government.
Both clubs are among the most successful and popular football clubs in Greece, and collectively they had just over 1 million home spectators during the 2009/10 season. The stadium has also been relatively good at attracting significant sporting and cultural events over the years. Since 1982, the stadium has hosted three UEFA Champions League finals, a final in the now defunct UEFA Cup Winners’ Cup, IAAF World Athletics Championships, the Olympic Games and numerous concerts by major artists. However, there is not much competition from other venues in Greece to host major events, which gives the stadium the best opportunity to host major artists when they are passing by on their tours.
In recent years, several modern football stadiums have been built around Europe, and the Olympic stadium in Athens could be challenged in the future when it comes to attracting a final in any of the European Cups, UEFA Champions League and UEFA Europa League or UEFA Euro if it does not have major renovations.
Greece jointly applied with Turkey to host UEFA Euro 200825
.If their application had been successful, Spiros Louis Olympic Stadium would have been the final venue26
, but instead the joint bid from Austria and Switzerland was awarded the event. Four years later, Greece once again applied to host UEFA Euro,27 but this time the event went to Poland and Ukraine. Spiros Louis Olympic Stadium would have most likely been the final venue as the stadium was still, by far, the largest football ground in Greece.
2008 Summer Olympics, Beijing National Stadium, Beijing in China Construction price: 428 million
Capacity: 80,000
Attendance in 2010: N/A World Stadium Index: N/A
It is rather difficult to obtain data regarding attendance at events that have taken place at the Beijing National Stadium in 2010. The information we have found indicates that the stadium had 19 events during 2010 and the majority of these were sporting events. Although there have been relatively few events on the pitch, the venue had, according to our sources, a net income of 370 million RMB in the period April 2008 to January 2010, which is equivalent to approximately $54 million. More than $14
25 http://news.bbc.co.uk/sport2/hi/football/europe/1321498.stm 26 http://www.scotland-mad.co.uk/feat/edz4/greeceturkey_euro2008_78131/index.shtml 27 http://edition.cnn.com/2004/SPORT/football/11/11/euro.greece/index.html
22 million of the net income was from ticket revenue from stadium tours. From the day the stadium opened in 2008 there have been about 13 million people who have taken a stadium tour.
According to an article in Chinatown Sports Science28
the stadium's operating budget in 2009 was just over 187 million RMB, or a little over $27 million, and this budget will not rise significantly over the next ten years. The operating numbers are similar to numbers printed in the China Daily, which indicates that the annual operating expenses are just over $22 million.29
The stadium is owned by the Beijing State-Owned Assets Management Co. Ltd (BSAM) and the China International Trust and Investment Company (CITIC Group), both of which have clear links to the Chinese government. CITIC Group is also an operator of the stadium. The football team Beijing Guoan FC, which is tightly connected to the co-owner and operator of the arena, CITIC Group, has a priority to play in the venue, but has so far chosen to play its matches at the Workers Stadium.30
2010 Winter Olympics, BC Place, Vancouver in Canada Construction price: 104 million
Capacity: 54,320
Attendance in 2010: 1 million (2009) World Stadium Index: 18.3
BC Place hosted the opening and closing ceremony of the 2010 Winter Olympics in Vancouver, Canada. In 2009-2011 the stadium, originally constructed in 1983, went through a complete renovation for 565 million Canadian dollars31
, equivalent to $548 million, approximately $194 million more than initially expected.32
The redevelopment of the stadium was done in two phases. The first phase, which cost more than $103 million, was done before the Olympics and included new public spaces, new restrooms, updated media facilities, kiosks, new seating for people with disabilities and new lighting and signs.33
The second phase, which was the most costly, began after the Olympics were over. This phase included the installation of a new roof that can be opened and closed in twenty minutes. Other major
modifications were a new pitch, new screens, new sound system and new seats. The last phase cost about $445 million and the stadium reopened in September 2011.34
As the stadium was closed due to the renovations after the Olympics, no attendance figures for 2010 are available. However, the venue has confirmed over 231 event dates in 2012. Only a fraction of these events
28
China Sport Science. Vol. 30, No. 1 2010
29 http://www.chinadaily.com.cn/metro/2010-06/30/content_10039597.htm 30 http://translate.googleusercontent.com/translate_c?hl=da&rurl=translate.google.dk&sl=zh-CN&tl=en&u=http://fcguoan.sina.com.cn/fixtures- 31 http://www.theglobeandmail.com/sports/football/bc-place-to-be-gussied-up-in-time-for-2011-grey-cup/article1781720/ 32 http://www.canada.com/vancouversun/news/westcoastnews/story.html?id=c5dd17d0-de39-4019-98cc-b70a6e50d73e 33 http://www.winnipegfreepress.com/sports/football/bombers/two-stadiums-similar-sagas-134483063.html 34 Ibid.
23 are reserved for the main tenants: the football team Vancouver Whitecaps, which plays in Major League Soccer, and the American football team BC Lions, which plays in the Canadian Football League. The majority of the confirmed events are either concerts or other major gatherings.
According to Duncan Blomfield, Marketing and Communications Manager at BC Place, the venue had about 200 event days per year until the start of the renovation in 2009, and each year had approximately one million visitors.
Atatürk Olympic Stadium, Istanbul in Turkey Construction price: 144 million
Capacity: 76,092
Attendance in 2010: N/A World Stadium Index: N/A
The Atatürk Olympic Stadium in Istanbul is clear evidence that the motto “build it and they will come” is questionable.
Turkey and Istanbul have applied to host the Summer Olympics four times (2000, 2004, 2008 and 2012) without success.35
After their unsuccessful bids for the Games in 2000 and 2004, former International Olympic Committee (IOC) president Juan Antonio Samaranch recommended that Turkey and Istanbul should demonstrate tangible improvements to display their determination to the IOC.
That this recommendation resulted in the construction of Atatürk Olympic Stadium cannot be confirmed, but Atatürk Olympic Stadium was nevertheless built soon after and since then Istanbul has had another two unsuccessful Olympic bids. Despite its previous failures, Turkey's Prime Minister, Recep Tayyip Erdogan, confirmed in July 2011c that Turkey and Istanbul had once again submitted an application to host the Olympic Games 2020.36
Turkey has not only had unsuccessful Olympic bids but also unsuccessful bids to host UEFA Euro. As mentioned above, Turkey and Greece had a joint bid to host the UEFA Euro 2008. Atatürk Olympic Stadium was supposed to host the opening game37
if the joint bid with Greece became a reality. Turkey also applied for UEFA Euro in 2016, but once again the bid was unsuccessful.38
According to the Turkish UEFA Euro 2016 application39
, Atatürk Olympic Stadium was supposed to host group matches, the last 16 matches, quarter- and semi-finals and the final.
35 http://www.gamesbids.com/english/bids/ist2012.shtml 36 http://www.insidethegames.biz/olympics/summer-olympics/2020/13679-turkey-prime-minister-confirms-istanbul-bid-for-2020-olympics 37 http://www.scotland-mad.co.uk/feat/edz4/greeceturkey_euro2008_78131/index.shtml 38 http://news.bbc.co.uk/sport2/hi/football/europe/8711016.stm 39 http://www.uefa.com/MultimediaFiles/Download/MediaRelease/uefaorg/MediaReleases/01/48/83/27/1488327_DO WNLOAD.pdf p. 3
24 The football club Istanbul Buyuksehir Belediye Spor Kulubu (IBB) uses the stadium as its home ground. However, the competition is fierce in Istanbul with teams like Fenerbahce SK, Galatasaray SK and Besiktas JK. IBB is the least popular team among the Istanbul teams in the top division.
IBB is also another example of the problems we had in obtaining exact data on the total number of spectators per season/year. Neither the club nor the Turkish Football Federation (TFF) have information regarding the attendance number for IBB on their official websites, and despite requests to the two parties, they have not been willing or able to answer.
However, our source in Turkey and the Turkish newspaper ‘Haber3’ points out that at a normal game in 2010 IBB had around 200 spectators.40
According to’ Hürriyet Futbol’ the average had risen to 4,000 in 2011.41
Although the club has increased its average, the numbers of spectators at a regular game confirm that IBB has very low attendance figures in relation to the venue’s capacity.
Conclusion on Olympic stadiums
If you only look at the Olympic venues included in the study in terms of big events, Atatürk Olympic Stadium is the poorest investment. Having spent nearly $150 million in construction costs with no major event in return, the largest stadium in Turkey could be seen as a major failure and a poor public
investment. Turkey and Atatürk Olympic Stadium have so far, despite numerous attempts, not hosted any major international sporting events and its next opportunity could be to host the Summer Olympics or UEFA Euro in 2020 – 18 years after the stadium was opened.
Its price per seat in relation to GNI per capita is, however, low, and results in a relatively low GNI Index, which may be positive for a stadium that is used by a football team with relatively low attendance figures. But the stadium is nevertheless underutilised. For instance, even though the Turkish national football team chose to play their home games at several different venues in their qualifying series for the 2010 World Cup and the 2012 European Football Championship, Atatürk Olympic Stadium was not one of them. Most of the events taking place in the stadium are connected with the football team IBB, which is the main tenant. But as the team has a low average attendance, it does not have a major influence at the total attendance number.
40
http://www.haber3.com/turkler-tv-taraftari--556356h.htm
41
25 Table 3.1: Overview Olympic stadiums 1996-2010
Name Construction Price Price per Seat World Stadium Index
Events GNI Index Ownership
Turner Field, Atlanta (USA) $346,052,868 $6,908 50.6 85 0.15 Private Nagano Olympic Stadium, Nagano (JPN) $107,127,879 $3,571 0.6 11 0.10 Public ANZ Stadium, Sydney (AUS) $582,685,890 $6,978 14.3 44 0.18 Private Rice-Eccles Stadium, Salt Lake City (USA)
$66,888,036 $1,448 7.2 9 0.03 Private Olympic Stadium Spiros Louis, Athens (GRE) $373,209,963 $5,361 17.7 49 0.20 Public Beijing National Stadium, Beijing (CHN) $428,406,780 $5,355 N/A 19 0.71 Public BC Place, Vancouver (CAN) $103,843,500 $1,905 18.3 200 0.05 Public Atatürk Olympic Stadium, Istanbul (TUR) $144,238,715 $1,879 N/A 46 0.12 Public Average $269,056,704 $4,176 18 58 - -
All prices in 2010 dollar value
The stadium which clearly has the lowest known World Stadium Index is Nagano Olympic Stadium at 0.6. The reason why the stadium has such a low index is connected to the problem of finding a high profile tenant, which is indicated by the stadium’s annual attendance numbers. In terms of the number of events held at the venue, the stadium’s general utilisation is also below average.
It is possible that the stadium fills a local sporting need, but this need could most likely also be filled with a much smaller venue. If the local authorities had a sporting legacy plan for the Olympic Stadium, this plan has proven not to have worked very well. 17,828 spectators in total in 2010 for an Olympic venue is a number that is hard to beat – on the wrong end of the scale.
Another stadium that has a low index is Rice-Eccles Stadium in Salt Lake City. The low index is a result of the few annual events held at the stadium. The Utah Utes have a high average audience, but the team
26 only plays six home games per year. However, the investment cost was quite low resulting in a low GNI Index. The stadium’s annual costs are only $133,00042, and while the stadium is entirely funded by private funds43
, its potential negative results do not affect public finances.
A venue that has clearly done well since the Olympics is Turner Field in Atlanta. The former Centennial Olympic Stadium has an index of 50.6, which in comparison with the other Olympic venues is very high compared to the average index of 21.5 for Olympic venues. What has contributed to Turner Field's success is, without a doubt, its adaption to local sporting needs after the Olympics. No nostalgia for the Olympic stadium got in the way as Atlanta had any interest in letting the stadium stand as a monument of the Games. Another important aspect of its success is its anchor tenant. The Atlanta Braves play more than one game per week and attract more than two million spectators per season. However, baseball is not equally strong around the globe and cannot be seen as a universal solution.
A venue that seems to have chosen its own distinctive path is Beijing National Stadium. The stadium has no main anchor tenant, and has, along with Nagano Olympic Stadium and Rice-Eccles Stadium, hosted least number of events per year. There are no data available on its total attendance, which makes it impossible to calculate a World Stadium Index figure. Instead of having a permanent anchor tenant and several events per year, the Chinese have chosen to use the stadium as a tourist attraction, a historical and possibly also a political monument. This strategy had brought some success – 13 million people have taken a stadium tour since the stadium opened in 2008 and the ‘Bird Nest’ is well-known around the globe.
The GNI Index for Beijing National Stadium, however, is not a success. At 0.71 it is high and well above average for the Olympic venues. It could be argued that there is a connection between the high index and the way in which the Chinese chose to utilise Beijing National Stadium after the Olympics. The distinctive design of the stadium has certainly contributed to its high construction price, almost $430 million, and the stadium is more of an excursion goal and a landmark symbol for China as a nation than a sports stadium.
Many of the Olympic venues have quite high construction costs, but is there a correlation between the amount of money invested and high attendance numbers? Yes and no. Turner Field in Atlanta cost nearly $7,000 per seat to build, but has been the most successful arena in attracting spectators. Rice-Eccles Stadium has the lowest investment cost and also the lowest World Stadium Index of the Olympic venues. Although it is tempting to draw a conclusion that there is a correlation between the money invested per seat and the subsequent success of the venue, it is not possible to make this conclusion. The Olympic cases presented here are too few, and at the same time Beijing National Stadium, one of the most expensive stadiums per seat to build, has an (unofficially) low World Stadium Index, which furthermore contradicts this assumption.
42
https://law.marquette.edu/assets/sports-law/pdf/sports-facility-reports/v12-college-facilities.pdf p.49
43
27
4. FIFA World Cup stadiums
FIFA has a number of requirements for stadiums hosting World Cup games. One of these is capacity. FIFA requires that a venue hosting the opening game and the final must have a net capacity of at least 80,000. For the other group matches, last 16, quarter finals and the match for third place the requirement is at least 40,000, and FIFA requests a net capacity of at least 60,000 for venues hosting the
semi-finals.44
At the first FIFA World Cup for men, which was held in Uruguay in 1930, 13 teams participated. Over time, the number of teams has increased and, as mentioned in chapter 1, the number of participating countries had become 32 by the World Cup in France in 1998.
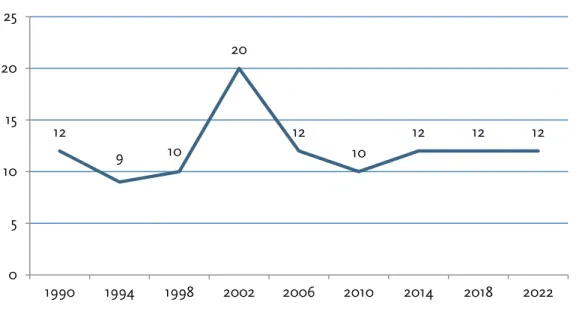
The increase in participating teams has, as stated above, not resulted in more stadiums being built, and figure 4.1 below shows that the number of World Cup stadiums has been 9-12 per venue per event regardless of whether 24 or 32 countries took part in the finals. The exception is the 2002 World Cup in Korea/Japan where 20 stadiums were used.
Figure 4.1: Number of FIFA World Cup stadiums 1990-2022
For future World Cups, the number of venues is also about the same. FIFA advised applicants for the World Cup in 2018 and 2022 that 16-18 venues should be presented in each application, venues which, in a reasonable manner, should be spread all over the country. Of these 16-18 stadiums FIFA would then choose 12 stadiums.45
The majority of the stadiums used for the 2018 World Cup in Russia and 2022 in
44 http://transparencyinsport.org/The_documents_that_FIFA_does_not_want_fans_to_read/PDF-documents/%2815%29Stadium-Agreement.pdf p.17 45 Ibid. p.8-9 12 9 10 20 12 10 12 12 12 0 5 10 15 20 25 1990 1994 1998 2002 2006 2010 2014 2018 2022 Number of Venues
28 Qatar will be newly built. Brazil anticipates six new stadiums and major renovations to four others for its World Cup in 2014.
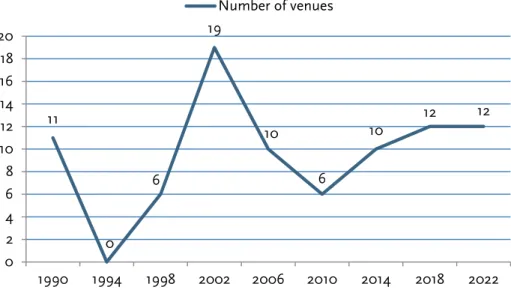
As figure 4.2 shows below, the number of venues that have been constructed or undergone major renovations varies from event to event. Before the 1998 World Cup in France, FIFA decided to only allow all-seater stadiums. France built one new stadium while five underwent major renovations partly due to these requirements.
The all-seater stadium requirements were introduced eight years before when Italy hosted the World Cup and despite the former requirements Italy had to make significant investments to be able to host the event. 11 new stadiums were built or underwent major renovations for the event. Since 1990 the majority of these Word Cup venues have not undergone any significant renovations.
As figure 4.2 shows, the 1994 World Cup in the United States took place without any new stadiums being built or major renovations being carried out. Thanks to a major interest in American football in the state, on both a professional and college level, USA could organise the event without any significant stadium investments.
Figure 4.2: Number of new or major renovations to stadiums due to the FIFA World Cup
2002 FIFA World Cup in Korea/Japan
The total cost of the 19 new or renovated stadiums for the 2002 FIFA World Cup was just over $4.6 bn. resulting in an average price of $243 million per venue. As figures 4.1 and 4.2 show, the World Cup in Korea/Japan so far has the highest number of used venues and also the highest number of new or renovated venues due to the event.
The main reason for the many venues is that the two countries initially intended to apply for the World Cup individually. However, the two countries eventually decided to make a joint application and were awarded the event in 1996.
11 0 6 19 10 6 10 12 12 0 2 4 6 8 10 12 14 16 18 20 1990 1994 1998 2002 2006 2010 2014 2018 2022 Number of venues
29 Miyagi Stadium, Rifu in Japan
Construction price: 318 million Capacity: 49,133
Attendance in 2010: 73,767
World Stadium Index: 1.5
After the 2002 World Cup a number of venues in Japan have faced difficulties in attracting larger crowds. One of these venues is Miyagi Stadium. The stadium, with a capacity of 49,133 and construction costs of almost $320 million, hosted two group matches and one last 16 match during the event. Miyagi Stadium staged nearly 80 events, but had only 73,767 spectators in total in 2010, which is a poor figure for a stadium of Miyagi Stadium's capacity.
Another major problem is that the two big teams in the prefecture, Vegalta Sendai and Tohoku Rakuten Golden Eagles, have chosen to play their home games at other venues – venues that existed before the Miyagi Stadium was built. Both teams attracted larger attendance figures than the events at Miyagi Stadium did in 2010.
The football team, Vegalta Sendai, chose to play a majority of their home games at the much smaller venue Yurtec Stadium Sendai, which has seating for 20,000 spectators. In 2010 the team had an average audience of 17,33246
and played only three matches in the J-League at Miyagi Stadium. The baseball team in the prefecture (subnational jurisdiction), Tohoku Rakuten Golden Eagles, plays its home games at Miyagi Baseball Stadium, which has a capacity of 23,026 spectators, and had an average attendance of 15,876 in 2010.47
The two teams have similar average attendance figures, but while Tohoku Rakuten Golden Eagles play at least 72 matches at home per season, their total attendance figures are just over 1.6 million, which results in a higher total attendance figure than Vegalta Sendai.
Miyagi Stadium needs a high profile anchor tenant if the stadium is going to increase its attendance figures. Its few major sporting events per year are not enough and the sporting legacy of the stadium is questionable. The local stadium need was fulfilled before 2002 World Cup and the new stadium has not been a boost for sport in the prefecture.
Sapporo Dome, Sapporo in Japan Construction price: 426 million Capacity: 42,328
Attendance in 2010: 1,965,944 (only baseball and soccer) World Stadium Index: 46.4
46 http://www.worldfootball.net/zuschauer/jpn-j-league-2010/1/ 47 http://translate.googleusercontent.com/translate_c?hl=da&rurl=translate.google.dk&sl=ja&tl=en&u=http://blog.go o.ne.jp/renee_2008/e/29c6b80b97cf5cc9b1e79309b2f59ebf&usg=ALkJrhhgtoyatqm-MPWAe4uLaTX8xJPkjw
30
N
ot all stadiums built for the 2002 World Cup have had a problematic sporting legacy. One example is Sapporo Dome on the island of Hokkaido. Although the stadium had a relatively high investment cost, just over $426 million, due to its multi-functionality and roof, this has made it possible for the venue to host different types of events.Significant events that have taken place in the stadium after the World Cup exemplifying the venue’s multi-functionality are the sprint races in the 2007 FIS Nordic World Ski Championship and a special stage of Rally Japan in 2008 and 2010.
In 2010 the stadium hosted 118 events and the majority of these were sporting events. The local baseball team, Hokkaido Nippon-Ham Fighters, played 72 games at Sapporo Dome. The stadium’s other main tenant, football team Consadole Sapporo, play at the venue on match days that do not clash with Hokkaido Nippon Ham-Fighters. Consadole Sapporo played eleven games in the J-League at the venue during the 2010 season.
The Hokkaido Nippon-Ham and Consadole Sapporo’s games alone gave Sapporo Dome a total
attendance figure of over two million in the 2010 season. The total figure for the stadium is higher, but we lack the figures from the other events.
Conclusion on 2002 FIFA World Cup in Korea/Japan
Unfortunately, we lack data on the total attendance numbers for the Korean stadiums built for FIFA World Cup 2002, which means that is impossible to give an overall picture of the sporting legacy for the 2002 World Cup venues. Desk research indicates that Korea spent nearly $1.7 bn. on its stadiums. The equivalent figure for Japan was just over $2.5 bn.
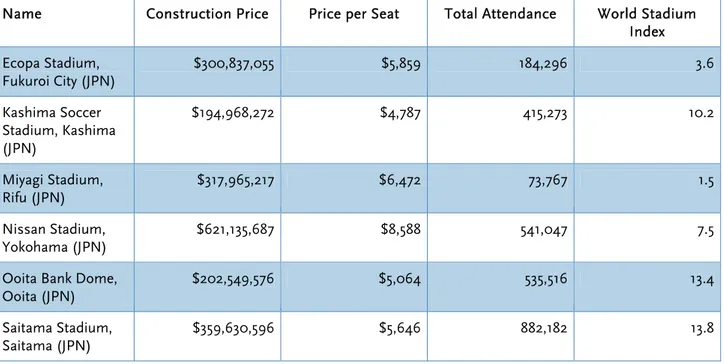
Table 4.1: Overview 2002 FIFA World Cup stadiums
Name Construction Price Price per Seat Total Attendance World Stadium
Index Ecopa Stadium, Fukuroi City (JPN) $300,837,055 $5,859 184,296 3.6 Kashima Soccer Stadium, Kashima (JPN) $194,968,272 $4,787 415,273 10.2 Miyagi Stadium, Rifu (JPN) $317,965,217 $6,472 73,767 1.5 Nissan Stadium, Yokohama (JPN) $621,135,687 $8,588 541,047 7.5
Ooita Bank Dome, Ooita (JPN)
$202,549,576 $5,064 535,516 13.4
Saitama Stadium, Saitama (JPN)
31 Misaki Park Stadium, Kobe (JPN) $232,345,610 $7,711 242,979 8.1 Sapporo Dome, Sapporo (JPN) $426,303,684 $10,071 1,965,944 46.4 Tohoku Denryoku Big Swan Stadium, Niigata (JPN) $283,348,305 $6,699 572,099 13.5 Busan Asiad Stadium, Busan (KOR) $223,623,410 $4,159 N/A N/A Daegu Stadium, Daegu (KOR) $293,203,898 $4,414 N/A N/A
Daejeon World Cup Stadium, Daejeon (KOR) $141,821,986 $3,499 N/A N/A Gwangju World Cup Stadium, Gwangju (KOR) $156,506,820 $4,090 N/A N/A Incheon Munhak Stadium, Incheon (KOR) $121,402,939 $2,562 N/A N/A
Jeju World Cup Stadium, Seogwipo (KOR)
$124,426,864 $3,660 N/A N/A
Jeonju World Cup Stadium, Jeonju (KOR)
$131,177,945 $3,144 N/A N/A
Seoul World Cup Stadium, Seoul (KOR)
$197,111,864 $2,951 N/A N/A
Suwon World Cup Stadium, Suwon (KOR) $149,065,847 $3,452 N/A N/A Ulsan Munsu Football Stadium, Ulsan (KOR) $149,213,681 $3,500 N/A N/A Average $243,507,329 $5,070 601,456 13.1
All prices in 2010 dollar value
The only information we have on the total inflow of spectators in Korea is from the statistics on the football games that took place at the Korean World Cup stadiums. Seven stadiums had less than 150,000
32 football spectators in 2010. The Korean World Cup stadium with the best figures was Seoul World Cup Stadium, which had a total attendance of 680,101 football spectators in 2010.
The FIFA World Cup in Japan resulted in an excessive construction of stadiums that led to increased competition between new and existing stadiums. This was particular visible in Miyagi and Fukuroi City. Both cities already had stadiums that were being used by local sports teams before the World Cup and were serving local needs. These old stadiums have continued to play an important role for the local teams, which has meant that Miyagi Stadium and Ecopa Stadium have had problems attracting larger crowds.
Miyagi Stadium and Ecopa Stadium have, as Table 4.1 shows, a poor World Stadium Index and the construction of both stadiums were obviously questionable. The stadiums are owned by the Miyagi and Shizuoka prefectures, and with their low attendance figures there is an obvious risk that the local citizens bear significant annual costs of maintaining the stadiums as the revenues from the stadiums are most likely minimal.
The current over-capacity of venues in Japan could quite easily have been avoided by choosing not to build and use as many stadia for 2002 World Cup. In the Japanese 2022 FIFA World Cup application, Japan submitted proposed to use stadiums that existed before 2002 World Cup. If these stadiums had been used in 2002, the current problems in Japan would probably not be present to the same extent.
As researcher John Horne points out in his article ‘The Four ‘Knowns’ of Sports Mega-Events’, the World Cup did result in some desired tourism developments for the two host countries, but not as much as originally hoped. Japan and Korea expected a million extra tourists in 2002, but Japan had only 30,000 more tourists than the year before. Korea had the same number of tourists in 2001 as in 2002.48
The two countries’ estimations before the 2002 World Cup are typical for the overt optimism that is often seen in connection with the construction of mega-event stadiums. Hopes and visions are not always transformed into something that can be called a sustainable success. Miyagi Stadium and Ecopa Stadium are two good examples of this.
However, there are venues that have done well and have had a positive sporting legacy after the World Cup. As mentioned above, the Sapporo Dome is an excellent example and Saitama Stadium, with nearly 900,000 spectators in 2010, could also be mentioned. Both stadiums have succeeded in playing an important role for their local sports post-World Cup and have managed to become a natural part of the local sporting landscape and fulfil a local sporting need.
2006 FIFA World Cup in Germany
Although Germany had fairly updated stadiums before 2006 FIFA World Cup, the country made significant investments due to the 2006 tournament. Nearly $2 bn. was invested in stadiums that were either built for or underwent major renovations for the event. The German investment is comparable to
48