This is the published version of a paper published in The Lancet.
Citation for the original published paper (version of record):
Vos, T., Allen, C., Arora, M., Barber, R M., Bhutta, Z. et al. (2016)
Global, regional, and national incidence, prevalence, and years lived with disability for 310
diseases and injuries, 1990-2015: a systematic analysis for the Global Burden of Disease Study
2015.
The Lancet, 388(10053): 1545-1602
https://doi.org/10.1016/S0140-6736(16)31678-6
Access to the published version may require subscription.
N.B. When citing this work, cite the original published paper.
Permanent link to this version:
Global, regional, and national incidence, prevalence, and
years lived with disability for 310 diseases and injuries,
1990–2015: a systematic analysis for the Global Burden of
Disease Study 2015
GBD 2015 Disease and Injury Incidence and Prevalence Collaborators*
Background
Non-fatal outcomes of disease and injury increasingly detract from the ability of the world’s population to
live in full health, a trend largely attributable to an epidemiological transition in many countries from causes aff ecting
children, to non-communicable diseases (NCDs) more common in adults. For the Global Burden of Diseases,
Injuries, and Risk Factors Study 2015 (GBD 2015), we estimated the incidence, prevalence, and years lived with
disability for diseases and injuries at the global, regional, and national scale over the period of 1990 to 2015.
Methods
We estimated incidence and prevalence by age, sex, cause, year, and geography with a wide range of updated
and standardised analytical procedures. Improvements from GBD 2013 included the addition of new data sources,
updates to literature reviews for 85 causes, and the identifi cation and inclusion of additional studies published up to
November, 2015, to expand the database used for estimation of non-fatal outcomes to 60 900 unique data sources.
Prevalence and incidence by cause and sequelae were determined with DisMod-MR 2.1, an improved version of the
DisMod-MR Bayesian meta-regression tool fi rst developed for GBD 2010 and GBD 2013. For some causes, we used
alternative modelling strategies where the complexity of the disease was not suited to DisMod-MR 2.1 or where incidence
and prevalence needed to be determined from other data. For GBD 2015 we created a summary indicator that combines
measures of income per capita, educational attainment, and fertility (the Socio-demographic Index [SDI]) and used it to
compare observed patterns of health loss to the expected pattern for countries or locations with similar SDI scores.
Findings
We generated 9·3 billion estimates from the various combinations of prevalence, incidence, and YLDs for
causes, sequelae, and impairments by age, sex, geography, and year. In 2015, two causes had acute incidences in excess
of 1 billion: upper respiratory infections (17·2 billion, 95% uncertainty interval [UI] 15·4–19·2 billion) and diarrhoeal
diseases (2·39 billion, 2·30–2·50 billion). Eight causes of chronic disease and injury each aff ected more than 10% of the
world’s population in 2015: permanent caries, tension-type headache, iron-defi ciency anaemia, age-related and other
hearing loss, migraine, genital herpes, refraction and accommodation disorders, and ascariasis. The impairment that
aff ected the greatest number of people in 2015 was anaemia, with 2·36 billion (2·35–2·37 billion) individuals aff ected.
The second and third leading impairments by number of individuals aff ected were hearing loss and vision loss,
respectively. Between 2005 and 2015, there was little change in the leading causes of years lived with disability (YLDs) on
a global basis. NCDs accounted for 18 of the leading 20 causes of age-standardised YLDs on a global scale. Where rates
were decreasing, the rate of decrease for YLDs was slower than that of years of life lost (YLLs) for nearly every cause
included in our analysis. For low SDI geographies, Group 1 causes typically accounted for 20–30% of total disability,
largely attributable to nutritional defi ciencies, malaria, neglected tropical diseases, HIV/AIDS, and tuberculosis. Lower
back and neck pain was the leading global cause of disability in 2015 in most countries. The leading cause was sense
organ disorders in 22 countries in Asia and Africa and one in central Latin America; diabetes in four countries in
Oceania; HIV/AIDS in three southern sub-Saharan African countries; collective violence and legal intervention in two
north African and Middle Eastern countries; iron-defi ciency anaemia in Somalia and Venezuela; depression in Uganda;
onchoceriasis in Liberia; and other neglected tropical diseases in the Democratic Republic of the Congo.
Interpretation
Ageing of the world’s population is increasing the number of people living with sequelae of diseases
and injuries. Shifts in the epidemiological profi le driven by socioeconomic change also contribute to the continued
increase in years lived with disability (YLDs) as well as the rate of increase in YLDs. Despite limitations imposed by
gaps in data availability and the variable quality of the data available, the standardised and comprehensive approach
of the GBD study provides opportunities to examine broad trends, compare those trends between countries or
subnational geographies, benchmark against locations at similar stages of development, and gauge the strength or
weakness of the estimates available.
Funding
Bill & Melinda Gates Foundation.
Copyright
© The Author(s). Published by Elsevier Ltd. This is an Open Access article under the CC BY license.
Lancet 2016; 388: 1545–602 This online publication has been corrected. The corrected version first appeared at thelancet.com on January 5, 2017
See Editorial page 1447 See Comment pages 1448 and 1450
*Collaborators listed at the end of the Article
Correspondence to: Prof Theo Vos, Institute for Health Metrics and Evaluation, Seattle, WA 98121, USA
Introduction
Although substantial progress has been made toward
reducing mortality and extending life expectancy
throughout the world over the past few decades, the
epidemiological transition is manifest in the growing
importance of non-fatal diseases, outcomes, and injuries
which pose, partly as a consequence of decreasing death
rates, a rising challenge to the ability of the world’s
population to live in full health. Complementing
information on deaths by age, sex, cause, geography, and
time with equally detailed information on disease
incidence, prevalence, and severity is key to a balanced
debate in health policy. For this reason, the Global
Burden of Disease (GBD) Study uses the
disability-adjusted life-year (DALY), combining years of life lost
(YLLs) due to mortality and years lived with disability
(YLDs) in a single metric. One DALY can be thought of
as one lost year of healthy life. The sum of DALYs in a
population can be thought of as the gap between the
population’s present health status and an ideal situation
where the entire population lives to an advanced age,
free of disease. Assessments of how diff erent diseases
lead to multimorbidity and reductions in functional
health status are important for both health system
planning
1and a broader range of social policy issues
such as the appropriate age for retirement in some
countries.
2,3Many challenges in making standardised
estimates of non-fatal health outcomes are similar to
those aff ecting mortality estimates (including variations
in case defi nitions, data collection methods, variable
quality of data collection, confl icting data, and missing
data) but are compounded by more sparse and varied
data sources, the need to characterise each disease by its
disabling sequelae or consequence(s), and the need
to
quantify the severity of these consequences. The
standardised approach of the annual GBD updates
addresses these measurement problems to enhance
comparability between causes by geography and
over time.
The estimates from GBD 2013 drew attention to large
increases in the number of YLDs over the previous
decade, whereas rates of YLDs for most causes remained
stable or showed only small decreases.
4The GBD 2013
assessment largely attributed increases in the number
of YLDs to musculoskeletal disorders, mental
and
substance use disorders, neurological disorders, and
chronic respiratory diseases, as well as population growth
and ageing. GBD 2013 also brought attention to increased
diff erences in trends between mortality and morbidity
for many causes. YLDs as a proportion of DALYs
increased globally, a manifestation of the continuing
epidemiological transition in low-income and
middle-income countries. Decreases in mortality from diseases
such as pneumonia, diarrhoea, maternal and neonatal
disorders, and an absence of progress in reducing YLD
Along with broad recognition that data from some
regions were sparse and that more and higher quality data
in general would probably improve estimation, useful
debates on the GBD results have been published. These
debates have focused on the analysis or presentation of
individual diseases, such as changes over time in GBD
estimates of dementia,
5the accuracy of HIV incidence
estimates,
6,7the absence of sepsis as a disease,
8,9the quality
of some cancer registry data,
10and the absence of mental
disorders as sequelae of neglected tropical diseases.
11The
GBD empirical approach to measuring the public’s view of
health state severity has generated substantial interest with
questions about the relative importance of diff erent
dimensions of health,
12,13the quantifi cation of health loss,
14,15and discussions of the transferability of judgments about
relative health to conventional notions of disability and
dependence.
5In each cycle of the GBD, we seek to improve
the estimates, refl ecting published and unpublished
critique through the acquisition of new data, expansion of
the network of collaborators, changes in how data are
corrected for bias, advances in modelling techniques, and
the targeted expansion of the GBD cause list.
The primary objective of this component of the GBD
was to use all available data of suffi
cient quality to
generate reliable and valid assessments of disease and
injury sequelae incidence, prevalence, and YLDs for all
310 causes in the GBD cause hierarchy for 591 locations
in the GBD study during 1990–2015. We describe the
change over time and between populations in relation to
where countries fall on the development continuum.
16Continuing eff orts to improve data and code transparency
are an important part of the GBD cycle. These results
thus supersede any previous publications about the GBD
on disease incidence, prevalence, and YLDs.
Methods
Overall approach
We estimated incidence and prevalence by age, sex, cause,
year, and geography using a wide range of updated and
standardised analytical procedures. The overall logic of
our analytical approach is shown for the entire non-fatal
estimation process in fi gure 1. The appendix provides a
single source for detail of inputs, analytical processes,
and outputs and methods specifi c to each cause. This
study complies with the Guidelines for Accurate and
Transparent Health Estimates Reporting (GATHER)
recommendations (methods appendix pp 1, 608–10).
17Geographies in GBD 2015
The geographies included in GBD 2015 have been
arranged into a set of hierarchical categories composed of
seven super-regions and a further nested set of 21 regions
containing 195 countries and territories. Eight additional
subnational assessments were done for Brazil, China,
India, Japan, Kenya, Saudi Arabia, South Africa, Sweden,
List of causes and sequelae
The GBD cause and sequelae list is organised
hierarchically (methods appendix 625–53). At Level 1
there are three cause groups: communicable, maternal,
neonatal, and nutritional diseases (Group 1 diseases);
non-communicable diseases; and injuries. These Level 1
aggregates are subdivided at Level 2 of the hierarchy into
21 cause groupings. The disaggregation into Levels 3
and 4 contains the fi nest level of detail for causes
captured in GBD 2015. Sequelae of diseases and injuries
are organised at Levels 5 and 6 of the hierarchy. The
fi nest detail for all sequelae estimated in GBD is at
Level 6 and is aggregated into summary sequelae
categories (Level 5) for causes with large numbers of
sequelae. Sequelae in GBD are mutually exclusive and
collectively exhaustive, and thus our YLD estimates at
each level of the hierarchy sum to the total of the level
above. Prevalence aggregations are estimated at the level
of individuals who might have more than one sequela or
disease and therefore are not additive.
The cause and sequelae list was expanded based upon
feedback after the release of GBD 2013 and input from
GBD 2015 collaborators. Nine causes for which
non-fatal outcomes are estimated were added: Ebola
virus disease, motor-neuron disease, environmental
heat and cold exposure, four subtypes of leukaemia,
and two subtypes of non-melanoma skin cancer
(methods appendix pp 625–53). The incorporation of
these changes expanded the cause list from the
301 causes with non-fatal estimates examined in
GBD 2013, to 310 causes with non-fatal estimates and
from 2337 to 2619 unique sequelae at Level 6 of the
hierarchy. At the newly created Level 5 of the hierarchy
there were 154 summary sequela categories. The
methods appendix (pp 654–61) provides a list of
International Classifi
cation of Diseases version 9
(ICD-9) and version 10 (ICD-10) codes used in the
extraction of hospital and claims data, mapped to GBD
2015 non-fatal causes, impairments, and nature of
injury categories.
Input data Process Results Database
Non-fatal estimation process
Raw data source Data adjustment Database
Alternative disease modelling Impairment and underlying cause
Post DisMod-MR DisMod-MR Injury modelling Disability weights Final burden estimates
Colours of non-fatal estimation
Case notifications
1 Data sources 2 Data adjustment 3b Alternative disease modelling strategies (details figure 1B)
3c Injury modelling strategy 5 Severity distribution 6 Disability weights 7 Comorbidity 8 YLDs 3a DisMod-MR 2.1 estimation
4 Impairment and underlying cause estimation Expansion factors for
case notifications Population-at-risk data Seroprevalence data Disease registries Birth registries Active screening Intervention coverage Vital registration Surveillance Community surveys National surveys Outpatient hospital data Claims data: outpatient visits Inpatient hospital data SMR data from cohort studies Cohort study MEPS Expert estimates duration untreated injuries Sequelae mapped to health states Household surveys Open access web-based survey GBD collaborator advice Surveys with diagnostic information and SF-12 Opportunistic surveys by IHME to fill SF-12 for 60 lay descriptions
Cohort follow-up studies Claims data: inpatient visits Adjustment for under-reporting HIV/AIDS and TB Malaria Seroprevalence to incidence models Case fatality proportion and cause of death rate models Apply aetiology or severity proportions to disease or impairment morbidity estimates Scale impairment prevalence by underlying cause or severity to envelope Neonatal disorders Cancer Age–sex splitting Add study-level covariaties Pre DisMod bias
correction
Adjustment for multiple outpatient visits per prevalent or incident case based on claims data Adjustment from primary code to all code based on claims data for causes with long duration
Adjustment for multiple admissions
in same individual Generate cause–natureof injury matrices with negative binomial models Determine most severe nature of injury category in any individual Compute excess mortality before from available incidence or prevalence and CSMR data Adjusted input data Non-fatal database: prevalence, incidence, excess
mortality rate, RR, SMR, duration, remission, severity proportions, and
intermediary modelling variables CSMR from CoDCorrect Study covariates
Disability weights for 235 health states Country covariates Apply cause–nature injury of matrices Regression to estimate disability weight by cause in survey respondents controlling for comorbidity
YLD to YLL ratio for 12 residual causes without primary data Analysis of paired comparison and population health equivalence responses Incidence by cause of injury code Prevalence and incidence by disease or impairment Proportion of disease or impairment sequelae or causes Scaled proportion of disease or impairment sequelae or underlying causes Proportion by sequelae Prevalence and incidence of sequelae from alternative models Prevalence and incidence of sequelae Unadjusted YLD by sequelae Probability of long-term disability Estimate duration of short-term disability DisMod-MR 2.1 Meta-analysis Short-term incidence by cause–nature and inpatient or outpatient Short-term prevalence by cause–nature and inpatient or outpatient
Lay descriptions for 235 health states Long-term incidence by cause–nature combination Long-term prevalence by cause–nature and inpatient or outpatient Map EQ5D to SF-12 DisMod-MR 2.1 Scale to 100% Scale to 100% Map SF-12 to GBD disability weights Meta-analysis proportion by severity level DisMod analysis proportion by severity level Comorbidity correction (COMO) Prevalence and incidence of sequelae of impairment or diseases (by severity
or underlying cause)
YLLs residual causes without
primary data
YLDs for each disease and injury by age, sex, year, and country
Figure 1: Analytical fl ow chart for the estimation of cause-specifi c YLDs by location, age, sex, and year for GBD 2015
Ovals represent data inputs, square boxes represent analytical steps, cylinders represent databases, and parallelograms represent intermediate and fi nal results. The fl ow chart is colour-coded by major estimation component: raw data sources, in pink; data adjustments, in yellow; DisMod-MR 2.1 estimation, in purple; alternative modelling strategies, in light green; injury modelling strategy, in dark green; estimation of impairments and underlying causes, in brown; post-DisMod-MR and comorbidity correction, in blue; disability weights, in orange; and cause of death and demographic inputs, in grey. GBD=Global Burden of Disease. TB=tuberculosis. SF-12=Short Form 12 questions. MEPS=Medical Expenditure Panel Surveys. CSMR=cause-specifi c mortality rate. SMR=standardised mortality ratio. YLDs=years lived with disability. YLLs=years of life lost. IHME=Institute for Health Metrics and Evaluation.
Period of analysis
A complete set of age-specifi c, sex-specifi c,
cause-specifi c, and geography-cause-specifi c incidence and prevalence
numbers and rates were computed for the years 1990,
1995, 2000, 2005, 2010, and 2015. In this study we focus
on trends for main and national results over the past
decade, from 2005 to 2015, together with more detailed
results for 2015. Online data visualisations at vizhub
provide access to results for all GBD metrics.
Non-fatal modelling strategies vary substantially
between causes. Figure 1 outlines the general process of
non-fatal outcome estimation from data inputs to
fi nalisation of YLD burden results; step 3b of that process
identifi es alternative modelling approaches used for
specifi c causes (methods appendix pp 603, 604). The
starting point for non-fatal estimation is the compilation
of data sources identifi ed through systematic analysis
and extractions based on predetermined inclusion and
exclusion criteria (methods appendix p 603). As part of
the inclusion criteria, we defi ned disease-specifi c or
injury-specifi c reference case defi nitions and study
methods, as well as alternative allowable case defi nitions
and study methods which were adjusted for if we detected
a systematic bias. We used 15 types of primary data
sources representing disease prevalence, incidence,
mortality risk, duration, remission, or severity in the
estimation process (oval shapes in fi gure 1).
Data sources
For this iteration of the study, we updated data searches
through systematic data and literature reviews for
85 causes published up to
Oct 31, 2015. For other
causes, input from GBD collaborators resulted in
the identifi cation and inclusion of a small number of
additional studies published after January, 2013. Data were
systematically screened from household surveys archived
in the Global Health Data Exchange, sources suggested
to us by in-country experts, and surveys identifi ed in
major multinational survey data catalogues and Ministry
of Health and Central Statistical Offi
ce websites. Case
notifi cations reported to WHO were updated up to and
including 2015. Citations for all data sources used for
non-fatal estimation in GBD 2015 are provided in searchable
form through a new web tool. A description of the
search terms used for cause-specifi c systematic reviews,
inclusion and exclusion criteria, and the preferred and
alternative case defi nitions and study methods are detailed
by cause in the methods appendix (pp 26–601).
Hospital inpatient data were extracted from
284 country-year and 976 subnational-year combinations
from 27 countries in North America, Latin America,
Europe, and New Zealand. Outpatient encounter data
were available from the USA, Norway, Sweden, and
Canada for 48 country-years. For GBD 2015, we also
accessed aggregate data derived from claims information
claims data, we generated several correction factors to
account for bias in health service encounter data from
elsewhere, which were largely available to us aggregated
by ICD code and by primary diagnosis only. First, for
chronic disorders, we estimated the ratio between
prevalence from primary diagnoses and prevalence from
all diagnoses associated with a claim. Second, we used
the claims data to generate the average number of
outpatient visits per disorder. Similarly, we generated per
person discharge rates from hospital inpatient data in the
USA and New Zealand, the only sources with unique
patient identifi ers available for GBD 2015.
In GBD 2013, we calculated a geographical and temporal
data representativeness index (DRI) of non-fatal data
sources for each cause or impairment. The DRI represents
the fraction of countries for which any incidence,
prevalence, remission, or mortality risk data were available
for a cause. This metric quantifi es data availability, not
data quality. The overall DRI and period-specifi c DRI
measures for each cause and impairment are presented in
the methods appendix (pp 662–68). DRI ranged from 90%
for nine causes, including tuberculosis and measles, to
less than 5% for acute hepatitis C and the category of
other exposures to mechanical forces. Required case
reporting resulted in high DRI values for notifi able
infectious diseases; the network of population-based
registries for cancers resulted in a DRI of above 50%.
DRI values ranged from 6·1% in North Korea to 91·3%
in the USA. Many high-income countries, as well as
Brazil, India, and China, had DRI values above 63%; data
availability was low in several countries, including
Equatorial Guinea, Djibouti, and South Sudan.
Non-fatal disease models
In addition to the corrections applied to claims and
hospital data, a number of other adjustments were applied
including age–sex splitting, bias correction, adjustments
for under-reporting of notifi cation data, and computing
expected values of excess mortality. In GBD 2013, we
estimated expected values of excess mortality from
prevalence or incidence and cause-specifi c mortality
rate data for a few causes only, including tuberculosis
and chronic obstructive pulmonary disease. In order to
achieve greater consistency between our cause of death
and non-fatal data, we adopted this strategy systematically
for GBD 2015. We matched every prevalence data point
(or incidence datapoint for short duration disorders) with
the cause-specifi c mortality rate value corresponding to
the age range, sex, year, and location of the datapoint.
The ratio of cause-specifi c mortality rate to prevalence is
conceptually equivalent to an excess mortality rate.
To estimate non-fatal health outcomes in previous
iterations of GBD, most diseases and impairments were
modelled in DisMod-MR, a Bayesian meta-regression tool
originally developed for GBD 2010 (step 3a in fi gure 1).
18For Global Health Data Exchange see http://ghdx.healthdata.org
For data in GBD 2015 see http:// ghdx.healthdata.org/global-burden-disease-study-2015
For data visualisations at
vizhub see http://vizhub.
synthesis of often sparse and heterogeneous
epidemio-logical data. For GBD 2015, the computational engine of
DisMod-MR 2.1 remained unchanged, but we substantially
rewrote the code that organises the fl ow of data and
settings at each level of the analytical cascade. The
sequence of estimation occurs at fi ve levels: global,
super-region, super-region, country, and where applicable, subnational
locations (appendix pp 611–24). At each level of the cascade,
the DisMod-MR 2.1 computational engine enforces
consistency between all disease parameters. For GBD 2015,
we generated fi ts for the years 1990, 1995, 2000, 2005, 2010,
and 2015. We log-linearly interpolated estimates for the
intervening years in each 5-year period. Greater detail on
DisMod-MR 2.1 is available at Global Health Data
Exchange and the methods appendix (pp 7–11).
In previous iterations of GBD, custom models were
created for a short list of causes for which the compartment
model underpinning DisMod (susceptible, diseased, and
dead) was insuffi
cient to capture the complexity of the
disease or for which incidence and prevalence needed to
be derived from other data. Step 3b of fi gure 1 describes
the development of custom models with greater detail
shown in the methods appendix fi gure 1B (p 604, and
for associated write-ups pp 26–601) for HIV/AIDS,
tuberculosis, malaria, cancer, neonatal disorders,
infectious diseases for which we derived incidence from
seroprevalence data, and infectious diseases for which we
derived incidence from cause of death rates and pooled
estimates of the case fatality proportion.
In GBD 2013, we estimated the country–age–sex–year
prevalence of nine impairments (step 4 of fi gure 1).
Impairments in GBD are disorders or specifi c domains of
functional health loss that are spread across many GBD
causes as sequelae and for which there are better data to
estimate the occurrence of the overall impairment than for
each sequela based on the underlying cause. Overall
impairment prevalence was estimated with DisMod-MR 2.1
except for anaemia, for which spatiotemporal Gaussian
Process regression methods were applied. We constrained
cause-specifi c estimates of impairments, such as in the
19 causes of blindness, to sum to the total prevalence
estimated for that impairment. Anaemia, epilepsy, hearing
loss, heart failure, and intellectual disability were estimated
at diff erent levels of severity.
Severity distributions
In step 5, sequelae were further defined in terms
of severity for 194 causes at Level 4 of the hierarchy
(fi gure 1A). We generally followed the same approach for
estimating the distribution of severity as in GBD 2013.
For Ebola virus disease, we created a health state for the
infectious disease episode with duration derived from
average hospital admission times, and a health state for
ongoing postinfection malaise and joint problems based
on four follow-up studies
19–22from which we derived an
average duration. The health states for the subtypes of
leukaemia and non-melanoma skin cancer were the
same as the general cancer health states. For
motor-neuron disease we accessed the Pooled Resource
Open-Access ALS Clinical Trials (PROACT) database containing
detailed information on symptoms and impairments for
more than 8500 patients who took part in the trials.
23Disability weights
We used the same disability weights as in GBD 2013 (see
methods appendix pp 669–94 for a complete listing of
the lay descriptions and values for the 235 health states
used in GBD 2015).
Comorbidity
In step 7, we estimated the co-occurrence of diff erent
diseases by simulating 40
000 individuals in each
geography–age–sex–year combination as exposed to the
independent probability of having any of the sequelae
included in GBD 2015 based on disease prevalence. We
tested the contribution of dependent and independent
comorbidity in the US Medical Expenditure Panel Surveys
(MEPS) data, and found that independent comorbidity
was the dominant factor even though there are well
known examples of dependent comorbidity. Age was
the main predictor of comorbidity such that age-specifi c
microsimulations accommodated most of the required
comorbidity correction. Taking dependent comorbidity
into account changed the overall YLDs estimated in the
MEPS data by only 2·5% (and ranging from 0·6% to
3·4% depending on age) in comparison to assuming
independent comorbidity (methods appendix pp 18–20).
24YLD computation
We report 95% uncertainty intervals (95% UI) for each
quantity in this analysis using 1000 samples from the
posterior distribution of prevalence and 1000 samples of
the disability weight to generate 1000 samples of the YLD
distribution. The 95% UI is reported as the 25th and 975th
values of the distribution. We report signifi cant changes
in disease estimates between countries or over time if the
change was noted in more than 950 of the 1000 samples
computed for each result. For GBD 2015, we computed
age-standardised prevalence YLD rates from the updated
world population age standard developed for GBD 2013.
25Less common diseases and their sequelae were included
in 35 residual categories (methods appendix pp 695–97).
For 22 of these residual categories, estimates were made
from epidemiological data for incidence or prevalence.
For 13 residual categories, we estimated YLDs by
multiplying the residual YLL estimates by the ratio of
YLDs to YLLs from the estimates for explicitly modelled
Level 3 causes in the same disease category.
Socio-demographic Index
In GBD 2013, a sociodemographic status variable
was computed based on a principal components
analysis of income per capita, educational attainment,
average age of the population, and the total fertility
For DisMod-MR 2.1 engine and
the code see http://ghdx.
healthdata.org/global-burden-disease-study-2015
rate.
26For GBD 2015, we excluded mean age of the
population because it is directly aff ected by death
rates. To improve interpretability for GBD 2015, we
computed a Socio-demographic Index (SDI) similar to
the computation of the human development index.
27In the SDI, each component was weighted equally and
rescaled from zero (for the lowest value observed during
1980–2015) to one (for the highest value observed) for
income per capita and average years of schooling, and
the reverse for the total fertility rate. The fi nal SDI score
was computed as the geometric mean of each of the
components. SDI ranged from 0·060 in Mozambique in
1987 to 0·978 in District of Columbia, USA, in 2015.
Role of the funding source
The funder of the study had no role in study design,
data collection, data analysis, data interpretation,
or writing of the report. The corresponding author
had full access to all the data in the study and had
fi nal responsibility for the decision to submit for
publication.
Results
Global incidence and prevalence
We generated over 9·3 billion outcomes of incidence,
prevalence, and YLDs for 310 diseases, injuries, and
aggregate categories; 2619 unique and aggregate
sequelae; nine impairments; 63 age–sex groups;
591 geographies; and 26 individual years from 1990
to 2015. Each of these 9·3 billion estimates was
calculated 1000 times to determine uncertainty
intervals. Here, we present key summary fi ndings
on global incidence of short duration diseases, global
prevalence of long-term disorders, global prevalence
of impairments, global numbers and rates of YLDs
and changes from 2005 to 2015, global YLL and YLD
rates of change, patterns of comorbidity, the expected
changes in the composition of YLDs with SDI, and
country fi ndings of leading causes of YLDs.
Disorders of less than 3 months duration and injuries
with incidence of more than 1 million cases per year in
2015 are listed in table 1. There were two disorders with
incidence greater than 1 billion per year: upper respiratory
infections (17·2 billion [95% UI 15·4–19·2 billion]), and
diarrhoeal diseases (2·39 billion [2·30–2·50 billion]).
A further 13 diseases and injuries caused between
100 million and 1 billion incident cases a year
and 16 diseases and injuries had incident cases of
between 10 million and 100 million per year (table 1).
The disease and injury sequelae with a duration of
more than 3 months and a global prevalence of more
than 1% in 2015 are presented in table 2, aggregated to
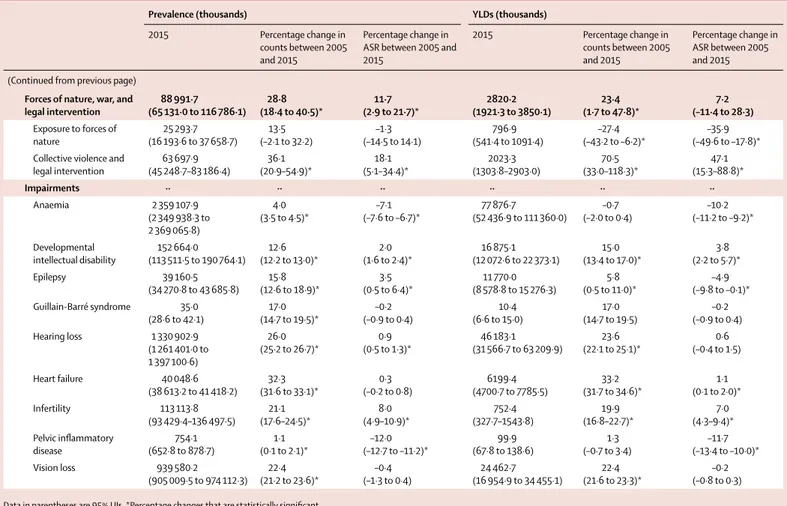
the cause level. Prevalence for impairments is presented
at the bottom of table 3. Eight out of 56 high-prevalence
causes aff ected more than 10% of the world’s population
Incidence (thousands) Percentage change (%)
2005 2015
Upper respiratory infections 15 624 257
(13 851 237–17 411 199) 17 230 659 (15 351 516–19 172 439) 10·3 (9·0 to 11·6)* Diarrhoeal diseases 2 235 739 (2 139 050–2 348 407) 2 392 517 (2 301 101––2 503 094) 7·0 (6·0 to 8·0)* Permanent caries 426 963 (371 216–484 332) 487 629 (423 507–552 895) 14·2 (13·1 to 15·4)* Otitis media 429 820 (353 915–525 059) 471 027 (386 606–577 286) 9·6 (7·9 to 11·2)* Lower respiratory infections 273 131
(257 286–288 078) 291 759 (276 244–307 004) 6·8 (5·6 to 8·1)* Malaria 339 275 (261 417–447 605) 286 859 (219 712–377 332) –15·4 (–23·0 to –8·1)* Gastritis and duodenitis 185 250
(167 471–204 974) 213 729 (192 486–236 339) 15·4 (10·8 to 17·2%)* Pyoderma 178 382 (172 199–184 147) 207 452 (200 498–213 936) 16·3 (15·6% to 17·0)* Gonococcal infection 138 220 (107 106–184 385) 172 676 (129 731–235 737) 24·9 (17·9 to 31·0)* Interstitial nephritis and
urinary tract infections
127 380 (124 308–130 683) 152 295 (148 748–156 177) 19·6 (19·2 to 19·9)* Varicella and herpes zoster 128 678
(124 298–133 090) 142 413 (137 804–147 181) 10·7 (10·0 to 11·4)* Trichomoniasis 121 948 (104 825–141 284) 140 781 (121 207–163 163) 15·4 (14·5 to 16·5)* Acute hepatitis A 109 609 (101 813–117 648) 114 212 (103 349–124 776) 4·2 (–7·2 to 17·0) Hepatitis B 98 277 (86 507–112 527) 111 212 (97 410–126 251) 13·2 (–4·3 to 35·2) Gallbladder and biliary
diseases 88 215 (79 276–96 495) 104 322 (93 074–114 430) 18·3 (16·0 to 20·7)*
Peptic ulcer disease 83 388
(77 760–89 435) 87 410 (80 343–94 506) 4·8 (2·6 to 7·0)* Dengue 32 749 (18 879–68 335) 79 609 (53 784–169 704) 143·1 (–0·3 to 564·7) Other sense organ diseases 60 659
(58 721–62 579) 69 945 (67 856–72 080) 15·3 (14·6 to 16·0)* Chlamydial infection 56 976 (45 489–70 839) 61 173 (48 871–76 698) 7·4 (5·5 to 9·4)* Maternal abortion,
miscarriage, and ectopic pregnancy 53 942 (43 630–67 168) 53 958 (43 224–67 417) 0·0 (–3·8 to 4·0) Syphilis 43 515 (37 479–51 054) 45 413 (37 787–54 921) 4·4 (–0·3 to 8·1) Deciduous caries 41 353 (28 723–58 131) 43 688 (29 630–62 543) 5·6 (2·1 to 8·1)* Genital herpes 29 112 (25 131–33 432) 39 791 (35 569–44 572) 36·7 (32·4 to 41·6)* Urolithiasis 17 875 (16 320–19 728) 22 080 (20 183–24 295) 23·5 (21·2 to 25·6)* Cellulitis 17 312 (15 988–18 739) 21 211 (19 582–22 985) 22·5 (21·0 to 24·1)* Maternal hypertensive disorders 20 416 (17 593–23 417) 20 731 (17 355–24 379) 1·5 (–3·0 to 6·3) Acute hepatitis E 18 869 (17 340–20 580) 19 525 (18 011–21 273) 3·5 (2·2% to 4·7)* Whooping cough 22 457 (17 322–28 268) 16 298 (12 599–20 445) –27·4 (–29·5 to –25·2)*
these causes are not among the dominant causes of YLDs
because of comparatively low average disability weights,
some causes, such as headaches, gynaecological diseases,
oral disorders, and skin diseases, put great demands on
health system resources by their sheer numbers.
Anaemia was the most common of our nine
impairments, aff ecting 2·36 billion (2·35–2·37 billion)
people in 2015. The next most common impairments
were hearing loss of greater than 20 dB (1·33 billion
[1·26–1·40 billion]), vision loss (940 million
[905–974 million]), developmental intellectual disability
(153 million [114–191 million]), infertility (113 million
[93·4–136 million]), heart failure (40·0 million
[38·6–41·4 million]), and epilepsy (39·2 million
[34·3–43·7 million]; table 3; see results appendix
(pp 740–48)
for the prevalence estimates of the underlying
causes of these impairments). Iron defi ciency was the
cause of anaemia in more than half of all cases. Over
90% of hearing loss was classifi ed as age-related or other
hearing loss. The largest number of people with vision
loss had uncorrected refraction error. Idiopathic
developmental intellectual disability, idiopathic female
infertility, and idiopathic epilepsy were the most common
causes of their impairments. Ischaemic heart disease
was the most common cause of heart failure.
Global causes of disability
Global trends in YLDs 2005 to 2015
GBD 2015 included the assessment of 2619 sequelae at
Level 6 of the GBD cause hierarchy, including 1316 sequelae
from injuries that contributed to the global burden of
disability. Causes at Level 4 of the hierarchy that resulted in
30 million or more YLDs in 2015 included lower back pain,
major depressive disorder, age-related and other hearing
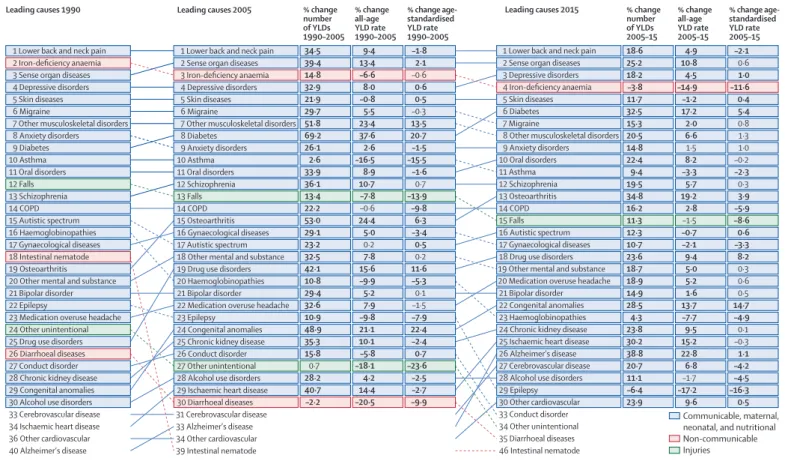
loss, and neck pain. Figure 2 compares the leading causes
of global YLDs in 2005 and 2015, using the cause
breakdowns at Level 3 of the GBD cause hierarchy. Among
the ten leading causes of YLDs, iron-defi ciency anaemia
and depressive disorders switched ranks to positions three
and four respectively, diabetes rose from the eighth to the
sixth position, migraine dropped from position six to
seven, and other musculoskeletal disorders dropped from
rank seven to eight (fi gure 2).
Estimates of prevalence and YLDs at the global level for
2005 and 2015 for each cause are presented in table 3 (see
results appendix pp 717–40 for full detail at the sequelae
level). Prevalence and age-standardised YLDs for
21 Group 1 diseases decreased signifi cantly and by more
than 10%, including measles, African trypanosomiasis,
diphtheria, lymphatic fi lariasis, and rabies.
Age-standardised YLD rates for all maternal causes and
sequelae combined decreased between 2005 and 2015,
whereas overall age-standardised YLDs for neonatal
disorders increased by 3·11% (–0·32–6·79%) since 2005 to
144 YLDs per 100 000 (109–185 YLDs per 100 000) in 2015,
and age-standardised YLD rates decreased and absolute
numbers of cases increased for nutritional defi ciencies.
Age-standardised YLD rates attributable to hepatitis A, B,
and C increased, and decreased for hepatitis E. The number
of individuals with chronic hepatitis C infection increased
from 121 million (108–133 million) in 2005 to 142 million
(127–157 million) in 2015.
Changes in age-standardised YLDs and YLLs over time
In 2005, non-communicable diseases (NCDs) accounted
for 23 of the leading 25 causes of age-standardised YLDs
worldwide and 23 of the 25 leading causes in 2015
(fi gure 2). Although diabetes rose only two ranks in the
list of leading cause of YLDs, from position eight to six
between 2005 and 2015, the increase in age-standardised
rate was 5·4% (3·2–7·5%). Musculoskeletal disorders
occupied three of the leading 25 causes of disability in
both 2005 and 2015; lower back and neck pain were the
single largest cause with little change in their rates.
Incidence (thousands) Percentage change (%)
2005 2015
(Continued from previous page)
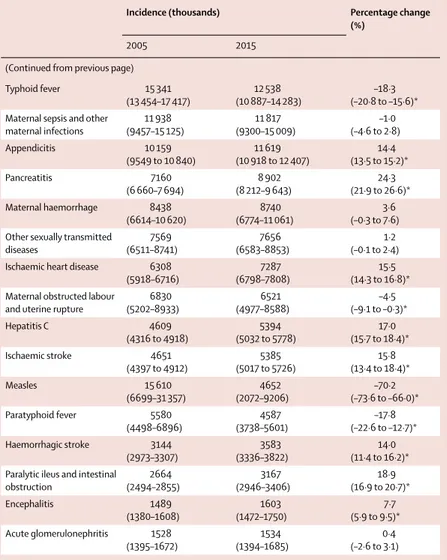
Typhoid fever 15 341 (13 454–17 417) 12 538 (10 887–14 283) –18·3 (–20·8 to –15·6)* Maternal sepsis and other
maternal infections 11 938 (9457–15 125) 11 817 (9300–15 009) –1·0 (–4·6 to 2·8) Appendicitis 10 159 (9549 to 10 840) 11 619 (10 918 to 12 407) 14·4 (13·5 to 15·2)* Pancreatitis 7160 (6 660–7 694) 8 902 (8 212–9 643) 24·3 (21·9 to 26·6)* Maternal haemorrhage 8438 (6614–10 620) 8740 (6774–11 061) 3·6 (–0·3 to 7·6) Other sexually transmitted
diseases 7569 (6511–8741) 7656 (6583–8853) 1·2 (–0·1 to 2·4) Ischaemic heart disease 6308
(5918–6716)
7287 (6798–7808)
15·5 (14·3 to 16·8)* Maternal obstructed labour
and uterine rupture
6830 (5202–8933) 6521 (4977–8588) –4·5 (–9·1 to –0·3)* Hepatitis C 4609 (4316 to 4918) 5394 (5032 to 5778) 17·0 (15·7 to 18·4)* Ischaemic stroke 4651 (4397 to 4912) 5385 (5017 to 5726) 15·8 (13·4 to 18·4)* Measles 15 610 (6699–31 357) 4652 (2072–9206) –70·2 (–73·6 to –66·0)* Paratyphoid fever 5580 (4498–6896) 4587 (3738–5601) –17·8 (–22·6 to –12·7)* Haemorrhagic stroke 3144 (2973–3307) 3583 (3336–3822) 14·0 (11·4 to 16·2)* Paralytic ileus and intestinal
obstruction 2664 (2494–2855) 3167 (2946–3406) 18·9 (16·9 to 20·7)* Encephalitis 1489 (1380–1608) 1603 (1472–1750) 7·7 (5·9 to 9·5)* Acute glomerulonephritis 1528 (1395–1672) 1534 (1394–1685) 0·4 (–2·6 to 3·1)
Data in parentheses are 95% UIs. *Percentage changes that are statistically signifi cant.
Table 1: Global incidence of short duration (less than 3 months) sequelae in 2005 and 2015 for all ages
and both sexes combined, with percentage change between 2005 and 2015 for level 4 causes with incidence greater than 1 million cases per year
However, age-standardised rates of YLDs increased for
osteoarthritis 3·90% (3·00–4·83%) by 2015. Depressive
disorders were the fourth leading cause of disability in
2005 and the third leading cause of disability in 2015,
and age-standardised YLD rates associated with the
disorder increased marginally (1·0% [0·5–1·5%]).
Age-standardised rates of YLDs from alcohol use disorders
decreased after 2005 (4·5% [2·3–6·4%]) whereas disability
due to drug use disorders increased by 8·2% (6·2–10·2%).
In contrast with global trends for NCDs, both relative
ranks and age-standardised YLD rates decreased for
most injuries. Falls, which were the 13th leading cause
of disability in 2005, dropped to the 15th rank,
and age-standardised YLD rates decreased (8·58%
[5·23–12·2%]). Other unintentional injuries decreased
in global rank from 27th in 2005 to 34th in 2015,
and age-standardiSed YLD rates decreased by 16·7%
(15·7–17·9%).
The leading causes of disability varied considerably with
age (fi gure 3). The leading cause in children younger than
5 years was iron-defi ciency anaemia followed by skin
diseases, protein-energy malnutrition, and diarrhoea. In
older children, iron-defi ciency anaemia, skin diseases,
asthma, and mental health disorders such as conduct,
autistic spectrum, and anxiety disorders were top ten
causes of disability. In adolescents and young adults (aged
between 15 and 39 years), iron-defi ciency anaemia, skin
diseases, depression, lower back and neck pain, and
migraine led the rankings. Other mental health disorders
such as anxiety disorders and schizophrenia were in the
top ten causes in this age group. In middle-aged adults,
musculoskeletal disorders dominated the top rankings
followed by mental health disorders, especially depression.
Diabetes and sense organ disorders were more prominent
causes of disability in middle-age. In older adults (older
than 65 years), sense organ disorders were the top-ranked
cause of disability. Musculoskeletal disorders remained a
dominant source of disability, and chronic obstructive
pulmonary disease entered the top ten. In the oldest age
groups, ischaemic heart disease and Alzheimer’s and
other dementias made their fi rst appearance in the top ten.
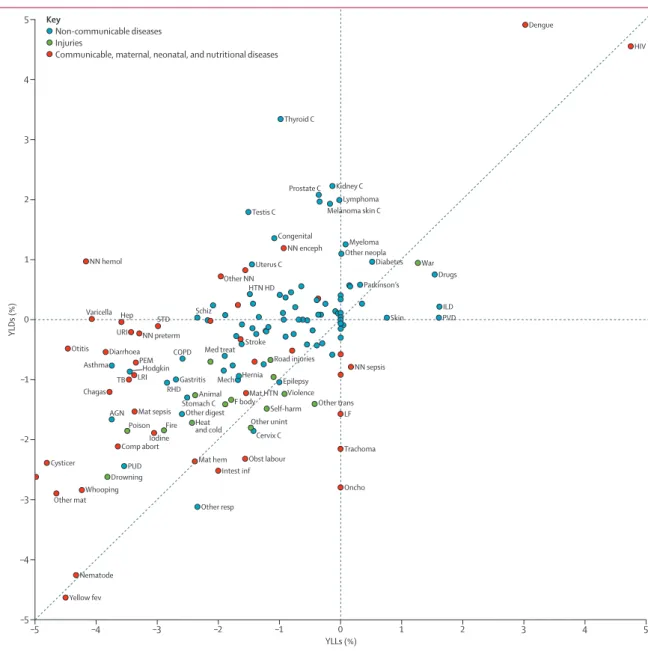
We examined the trends in YLDs and YLLs in a
scatterplot (fi gure 4). YLLs decreased for the majority of
causes. For Group 1
causes and injuries, the decrease in
YLLs was accompanied by a decrease in YLDs, albeit at a
slower pace. The exceptions were neonatal encephalopathy,
haemolytic disease and other neonatal jaundice,
leishmaniasis, meningitis, hepatitis, and sexually
trans-mitted diseases with increasing YLD rates between 1990
and 2015. A few Group 1 disorders and injuries had a
faster decrease in YLDs than in YLLs: intestinal infections,
obstructed labour, and neonatal sepsis. The only NCDs
with a faster decrease in YLDs compared with YLLs were
epilepsy and cervical cancer. Another small number of
NCDs saw an increase in YLDs and YLLs, including drug
Prevalence (thousands) Percentage change (%) 2005 2015 Permanent caries 2 045 859 (1 909 845–2 170 355) 2 344 628 (2 193 751–2 488 741) 14·6 (13·7 to 15·5)* Tension-type headache 1 306 390 (1 160 423–1 463 889) 1 505 892 (1 337 310–1 681 575) 15·3 (14·0 to 16·6)* Iron-defi ciency anaemia 1 456 387
(1 449 846–1 462 782)
1 477 531 (1 470 902–1 485 322)
1·5 (0·9 to 2·1)* Age-related and other
hearing loss 943 504 (886 325–995 403) 1 210 055 (1 140 224–1 274 665) 28·3 (27·4 to 29·2)* Migraine 831 726 (755 991–918 968) 958 789 (872 109–1 055 631) 15·3 (14·0 to 16·6)* Genital herpes 716 115 (626 987–817 387) 845 826 (736 724–968 066) 18·1 (16·4 to 19·9)* Refraction and accommodation disorders 672 165 (649 969–694 024) 819 307 (789 917–848 059) 21·9 (20·5 to 23·2)* Ascariasis 854 489 (790 000–924 895) 761 894 (682 558–861 031) –10·8 (–22·5 to 2·5) G6PD trait 663 704 (625 032–703 799) 728 549 (676 735–781 534) 9·8 (7·9 to 11·4)* Acne vulgaris 605 008 (568 577–642 061) 632 741 (595 242–671 249) 4·6 (3·5 to 5·6)* Other skin and
subcutaneous diseases 492 883 (480 852–505 426) 605 036 (589 500–619 676) 22·8 (22·1 to 23·4)* Deciduous caries 534 122 (449 525–635 866) 558 028 (462 649–669 027) 4·5 (2·3 to 6·1)*
Low back pain 460 164
(444 680–477 119) 539 907 (521 449–559 556) 17·3 (16·5 to 18·2)* Periodontal diseases 428 784 (372 953–498 682) 537 506 (465 114–625 889) 25·4 (24·1 to 26·5)* Fungal skin diseases 434 604
(395 512–475 904) 492 373 (448 951–538 232) 13·3 (12·5 to 14·1)* Trichuriasis 473 399 (443 689–505 928) 463 652 (426 621–502 939) –2·1 (–12·0 to 9·0) Diabetes 333 325 (310 773–355 510) 435 328 (404 736–468 562) 30·6 (28·0 to 33·0)* Premenstrual syndrome 391 207 (375 009–407 896) 430 697 (410 841–450 494) 10·1 (7·9 to 11·8)* Hookworm disease 462 111 (430 885–495 596) 428 246 (394 486–468 292) –7·3 (–16·9 to 3·5) Sickle-cell trait 338 756 (318 736–378 582) 404 566 (381 223–448 155) 19·4 (18·3 to 20·3)* Asthma 327 097 (296 406–358 060) 358 198 (323 134–393 466) 9·5 (7·6 to 11·6)* Neck pain 295 532 (258 878–338 138) 358 007 (313 408–409 411) 21·1 (19·0 to 23·3)* Hepatitis B 293 745 (284 478–303 036) 343 251 (330 541–357 195) 16·9 (15·3 to 18·4)* Other musculoskeletal disorders 283 317 (254 135–315 519) 342 068 (305 431–385 147) 20·7 (17·5 to 24·0)* Urolithiasis 259 567 (238 100–281 892) 318 763 (290 695 349 154) 22·8 (20·8 to 24·9)* Thalassaemias trait 252 798 (247 008–259 972) 279 451 (272 819–287 357) 10·5 (10·1 to 11·0)* Malaria 207 773 (186 530–230 942) 278 961 (240 158–320 921) 34·3 (26·8 to 42·3)* Edentulism and severe
tooth loss 216 473 (207 563–226 331) 275 619 (264 201–288 252) 27·3 (26·9 to 27·7)* Anxiety disorders 232 597 (204 165–264 445) 267 202 (234 064–306 318) 14·9 (13·0 to 16·8)*
cancers of the prostate, testis, uterus, kidney, colorectum,
and pancreas, melanoma, and congenital disorders. Some
cancers (stomach and Hodgkin’s lymphoma), rheumatic
heart disease, asthma, chronic obstructive pulmonary
disease, acute glomerulonephritis, peptic ulcer disease,
gastritis, hernia, and gallbladder disease had decreasing
YLLs and YLDs, but with a faster decrease in YLLs than in
YLDs. The rate of change in YLDs for the main drivers of
non-fatal health loss, musculoskeletal disorders, and
mental and substance use disorders was small.
Global distribution of disability weights across individuals
Figure 5 shows the global distribution of individuals from
our comorbidity microsimulation by six categories of
disability, age, and sex for the highest and lowest SDI
quintile. The six categories of disability are no disability,
very mild disability (disability weight less than or equal to
0·01), mild disability (from 0·01 to 0·05 inclusive),
moderate (from 0·05 to 0·1 inclusive), severe (from 0·1 to
0·3 inclusive), and profound (greater than 0·3). In 2015,
most of the world’s population experienced mild or
greater disability. Having no disability at all was most
common in children. After age 25 years, the proportion of
the population having no disability became progressively
smaller, and by age 55 years in low SDI countries and age
75 years in high SDI countries, nearly everyone had some
form of disability. Very mild to moderate disability (ie,
individuals with a disability weight of 0·1 or less) was
common in childhood and young adults, but was replaced
by more severe disability with increasing age. The
patterns were similar for both sexes, apart from a much
larger amount of disability in women older than 80 years
in the top SDI quintiles, refl ecting the much higher
average age of women in this age category. For policy
considerations around the age of retirement in ageing
populations, it is noteworthy that from age 60 years
onwards more than half of the population had severe or
worse disability. The extent to which this loss of health
limits or precludes the ability to work depends on the
nature of the impairments and the type of employment in
older workers with that level of disability.
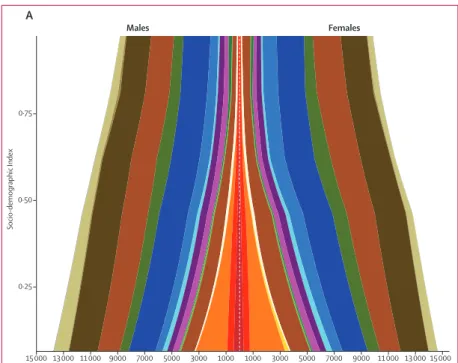
Expected changes in disease profi le with higher
Socio-demographic Index
Figure 6 depicts changes in patterns of disability by level of
SDI for age-standardised and all-age YLD rates per 100 000.
Age-standardised YLD rates gradually decreased with
increasing SDI in both sexes (fi gure 6A). The cause
composition of YLDs somewhat varied across levels of
SDI; these diff erences were largely derived from absolute
levels of disability due to communicable causes and
nutritional defi ciencies, and to a lesser extent, maternal
and neonatal disorders. Age-standardised YLD rates due to
NCDs and injuries were similar at all SDI levels.
Across levels of SDI, mental and substance use
disorders, musculoskeletal disorders, and other NCDs
were consistently among the leading causes of
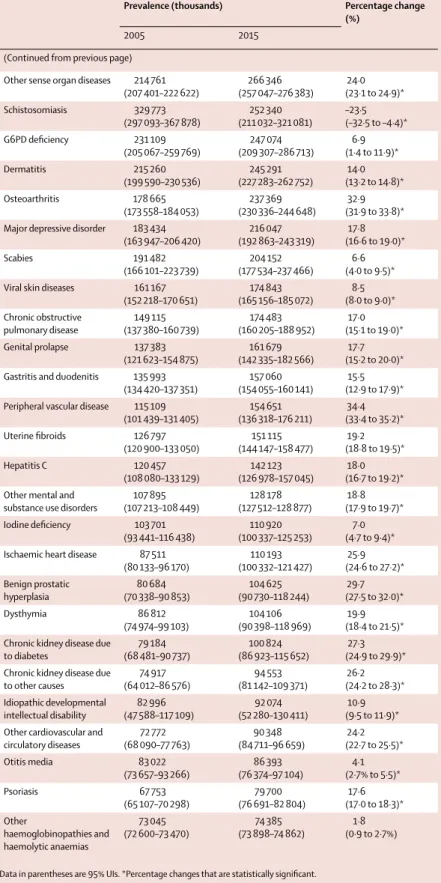
Prevalence (thousands) Percentage change (%)
2005 2015
(Continued from previous page) Other sense organ diseases 214 761
(207 401–222 622) 266 346 (257 047–276 383) 24·0 (23·1 to 24·9)* Schistosomiasis 329 773 (297 093–367 878) 252 340 (211 032–321 081) –23·5 (–32·5 to –4·4)* G6PD defi ciency 231 109 (205 067–259 769) 247 074 (209 307–286 713) 6·9 (1·4 to 11·9)* Dermatitis 215 260 (199 590–230 536) 245 291 (227 283–262 752) 14·0 (13·2 to 14·8)* Osteoarthritis 178 665 (173 558–184 053) 237 369 (230 336–244 648) 32·9 (31·9 to 33·8)* Major depressive disorder 183 434
(163 947–206 420) 216 047 (192 863–243 319) 17·8 (16·6 to 19·0)* Scabies 191 482 (166 101–223 739) 204 152 (177 534–237 466) 6·6 (4·0 to 9·5)*
Viral skin diseases 161 167
(152 218–170 651) 174 843 (165 156–185 072) 8·5 (8·0 to 9·0)* Chronic obstructive pulmonary disease 149 115 (137 380–160 739) 174 483 (160 205–188 952) 17·0 (15·1 to 19·0)* Genital prolapse 137 383 (121 623–154 875) 161 679 (142 335–182 566) 17·7 (15·2 to 20·0)* Gastritis and duodenitis 135 993
(134 420–137 351)
157 060 (154 055–160 141)
15·5 (12·9 to 17·9)* Peripheral vascular disease 115 109
(101 439–131 405) 154 651 (136 318–176 211) 34·4 (33·4 to 35·2)* Uterine fi broids 126 797 (120 900–133 050) 151 115 (144 147–158 477) 19·2 (18·8 to 19·5)* Hepatitis C 120 457 (108 080–133 129) 142 123 (126 978–157 045) 18·0 (16·7 to 19·2)* Other mental and
substance use disorders
107 895 (107 213–108 449) 128 178 (127 512–128 877) 18·8 (17·9 to 19·7)*
Iodine defi ciency 103 701
(93 441–116 438)
110 920 (100 337–125 253)
7·0 (4·7 to 9·4)* Ischaemic heart disease 87 511
(80 133–96 170) 110 193 (100 332–121 427) 25·9 (24·6 to 27·2)* Benign prostatic hyperplasia 80 684 (70 338–90 853) 104 625 (90 730–118 244) 29·7 (27·5 to 32·0)* Dysthymia 86 812 (74 974–99 103) 104 106 (90 398–118 969) 19·9 (18·4 to 21·5)* Chronic kidney disease due
to diabetes 79 184 (68 481–90 737) 100 824 (86 923–115 652) 27·3 (24·9 to 29·9)* Chronic kidney disease due
to other causes 74 917 (64 012–86 576) 94 553 (81 142–109 371) 26·2 (24·2 to 28·3)* Idiopathic developmental intellectual disability 82 996 (47 588–117 109) 92 074 (52 280–130 411) 10·9 (9·5 to 11·9)* Other cardiovascular and
circulatory diseases 72 772 (68 090–77 763) 90 348 (84 711–96 659) 24·2 (22·7 to 25·5)* Otitis media 83 022 (73 657–93 266) 86 393 (76 374–97 104) 4·1 (2·7% to 5·5)* Psoriasis 67 753 (65 107–70 298) 79 700 (76 691–82 804) 17·6 (17·0 to 18·3)* Other haemoglobinopathies and haemolytic anaemias 73 045 (72 600–73 470) 74 385 (73 898–74 862) 1·8 (0·9 to 2·7%)
Data in parentheses are 95% UIs. *Percentage changes that are statistically signifi cant.
Table 2: Global prevalence of longer duration (more than 3 months) sequelae in 2005 and 2015 for all
ages and both sexes combined, with percentage change between 2005 and 2015 for Level 4 causes with prevalence greater than 1%
age-standardised YLD rates. Anaemia led to generally
higher rates of age-standardised YLDs in women than in
men across levels of SDI, but the largest imbalance
occurred at SDI levels between 0·10 and 0·50. Disability
from injuries exacted a larger burden for men than for
women, particularly at lower levels of SDI.
Without adjustments for population age structure
(fi gure 6B), the eff ect of ageing populations and causes
of disability that disproportionately aff ect older
individuals become prominent. At all levels of SDI,
total YLDs per 100 000 did not notably diff er by sex;
instead, the cause composition of disability showed
greater diff erences. Below an SDI score of 0·25,
communicable causes accounted for 30–45% of total
disability, primarily due to nutritional defi ciencies,
malaria, and neglected tropical diseases. YLDs
per 100
000 due to musculoskeletal disorders,
particularly lower back and neck pain and other
mus-culo skeletal disorders, increased substantially from low
to high SDI, with a more pronounced increase
beginning at an SDI score of 0·6. This rise was
particularly evident in women.
Trends in age-standardised YLDs per capita
Globally, age-standardised YLDs per capita (an indicator
of overall disability experienced per person in a given
place) moderately decreased for both sexes between 1990
and 2015 (results appendix pp 714–16). Age-standardised
YLDs per capita were consistently higher for women
than for men at the global level. For both sexes, YLDs
per capita were generally higher for lower levels of SDI.
YLDs per capita were noticeably larger for low SDI and
low-middle SDI groups than for other SDI levels (ie,
high SDI, high-middle SDI, and middle SDI), which
were more similar to each other.
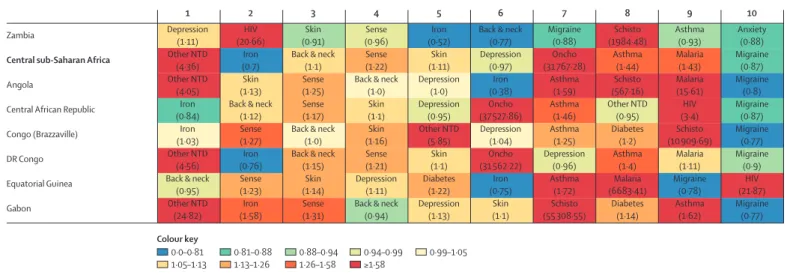
Leading causes of YLDs and deviations from expected levels
based on Socio-demographic Index
Clear, though varied, patterns emerged across and within
GBD regions in comparison of observed levels of YLDs
due to leading causes of disability with levels expected on
the basis of SDI. Figure 7 displays ratios of observed and
expected YLDs for the leading ten causes at level 3 of the
GBD hierarchy in 2015, colour coded by the magnitude
of diff erences between observed and expected YLDs.
Globally, lower back and neck pain was the leading
cause of disability in 2015. Two mental disorders, major
depressive and anxiety disorders, were the third and
ninth leading causes of global disability, and diabetes was
the sixth leading driver of disability. Iron-defi ciency
anaemia was the only Group 1 cause among the leading
ten causes for global YLDs (ranked fourth). Sensory
disorders ranked second and skin diseases ranked fi fth.
Lower back and neck pain was the leading global cause of
disability in 2015 in most countries. The leading cause of
African countries; depression in fi ve eastern sub-Saharan
Africa countries; other neglected tropical diseases in
Angola, Democratic Republic of the Congo, and Gabon;
sense organ disorders in Comoros and Myanmar;
diabetes in Fiji and Marshall Islands; war in Lebanon and
Syria; and onchocerciasis in Liberia.
Regional, country, territory, and selected subnational results
Lower back and neck pain was the leading cause of
disability in all high-income countries in 2015. However,
ratios of observed to expected YLDs from lower back and
neck pain ranged from 0·60 for Singapore to more than
1·59 in Norway. Most high-income countries experienced
higher than expected levels of disability due to depressive
disorders. The USA and Australia were the only two
high-income countries where drug use disorders were a top ten
cause of disability, and observed levels of YLDs were much
higher than expected. South Korea’s ratio of
observed-to-expected levels of YLDs due to diabetes exceeded 1·30,
whereas Japan’s diabetes-related disability was lower than
expected on the basis of SDI. In the UK, observed disability
due to asthma was well above expected levels.
In 2015, lower back and neck pain was the leading
cause of YLDs for all but two countries in Latin America
and the Caribbean; Haiti and Venezuela were the
exceptions, with iron-defi ciency anaemia as the leading
causes of disability for both countries. Disability due to
diabetes surpassed expected levels by at least a factor of
two for six countries and territories: Antigua, Barbados,
Dominica, Puerto Rico, Trinidad and Tobago, and the
Virgin Islands. Peru, however, had a ratio of less than 0·6
for observed and expected YLDs for diabetes.
In 2015, lower back and neck pain was the leading
cause of YLDs for 24 out of 28 countries and territories of
southeast Asia, east Asia, and Oceania. Other leading
causes of disability were sensory disorders in Myanmar,
diabetes in Fiji and the Marshall Islands, and
iron-defi ciency anaemia in Papua New Guinea. Although
lower back and neck pain was the primary cause of
disability, many countries had far lower levels of this
than expected given their SDI, including Thailand (0·73),
Indonesia (0·76), and Malaysia (0·75). Observed YLDs
due to depressive disorders were often lower than
expected, with 22 countries recording ratios below 0·80.
Conversely, numerous geographies recorded YLD ratios
exceeding 2·00 for diabetes (eg, 2·29 in Taiwan).
Beyond lower back and neck pain, which was the leading
cause of YLDs for three of fi ve countries in south Asia in
2015 (with India and Pakistan being the exception), a
mixture of causes accounted for the region’s main causes
of disability; this heterogeneity probably refl ects the
diversity of countries in the region and their places along
the development spectrum. Iron-defi ciency anaemia was
the fi rst leading cause and lower back and neck pain was
the second leading cause of YLDs in both India and
Pakistan, whereas sensory disorders, other musculoskeletal
Prevalence (thousands) YLDs (thousands)
2015 Percentage change in
counts between 2005 and 2015
Percentage change in ASR between 2005 and 2015 2015 Percentage change in counts between 2005 and 2015 Percentage change in ASR between 2005 and 2015 All causes ·· ·· ·· 792 004·7 (588 538·7–1 019 955·2) 15·1 (14·5 to 15·6)* –2·1 (–2·5 to –1·7)* Communicable, maternal,
neonatal, and nutritional diseases 4 133 822·3 (4 108 132·5 to 4 161 262·6) 8·0 (7·3 to 8·7)* –4·2 (–4·8 to –3·6)* 112 501·9 (80 347·4–156 270·9) –0·5 (–2·4 to 2·5) –9·7 (–11·4 to –7·0)*
HIV/AIDS and tuberculosis 46 005·2 (44 985·8 to 47 146·6) 18·6 (15·2 to 22·1)* 2·9 (–0·0 to 5·9) 6702·3 (4798·6–8863·5) 2·1 (–3·5 to 7·2) –12·2 (–17·0 to –7·8)* Tuberculosis 8861·2 (8076·3 to 9707·2) 9·2 (6·3 to 12·2)* –7·2 (–9·5 to –4·7)* 2712·4 (1829·9–3744·0) 9·4 (6·4 to 12·5)* –6·8 (–9·2 to –4·2)* HIV/AIDS 37 277·5 (36 279·9 to 38 339·1) 21·1 (16·9 to 25·5)* 5·6 (2·0 to 9·6)* 3989·9 (2891·2–5159·5) –2·4 (–10·5 to 5·5) –15·6 (–23·0 to –8·5)* HIV/AIDS—tuberculosis 1258·0 (1142·5 to 1386·9) –17·9 (–20·7 to –14·9)* –28·3 (–30·7 to –25·7)* 471·9 (316·0–645·6) –17·8 (–20·7 to –14·7)* –28·1 (–30·6 to –25·5)* HIV/AIDS resulting in other diseases 37 543·3 (36 350·0 to 39 028·4) 23·6 (20·5 to 26·7)* 7·9 (5·1 to 10·6)* 3518·0 (2 555·4–4 558·9) 0·2 (–9·3 to 9·3) –13·6 (–22·1 to –5·2)* HIV aggregate 21 149·0 (20 260·3 to 22 292·3) –19·5 (–22·5 to –16·3)* –29·7 (–32·3 to –26·9)* 1543·6 (1 107·2–2 025·2) –20·4 (–23·4 to –17·2)* –30·4 (–33·1 to –27·6)* AIDS aggregate 16 394·3 (15 747·0 to 17 154·2) 299·5 (251·4 to 355·5)* 232·9 (193·5 to 279·0)* 1974·4 (1432·0–2559·9) 25·5 (0·9 to 56·1)* 6·1 (–14·6 to 32·4)
Diarrhoea, lower respiratory infections, and other common infectious diseases
402 320·4 (393 746·5 to 408 994·2) 8·0 (7·2 to 8·8)* –2·9 (–3·7 to –2·3)* 14 865·0 (10 397·0–20 283·4) 6·2 (5·4 to 7·1)* –4·0 (–4·7 to –3·3)* Diarrhoeal diseases 35 820·6 (34 342·1 to 37 537·8) 6·4 (5·5 to 7·3)* –3·3 (–4·1 to –2·5)* 5731·7 (3 943·3–7 890·5) 6·4 (5·4 to 7·5)* –3·1 (–4·0 to –2·2)* Diarrhoea episodes aggregate 35 816·3 (34 337·5 to 37 534·1) 6·4 (5·5 to 7·3)* –3·3 (–4·1 to –2·5)* 5730·4 (3 942·2–7 889·0) 6·4 (5·4 to 7·5)* –3·1 (–4·0 to –2·2)* Guillain-Barré syndrome
due to diarrhoeal diseases
4·2 (3·2 to 5·5) 16·9 (14·7 to 19·5)* –0·2 (–0·9 to 0·4) 1·3 (0·8–1·9) 16·9 (14·7 to 19·5)* –0·2 (–0·9 to 0·4) Intestinal infectious diseases 1666·8
(1594·4 to 1 732·8) –23·3 (–25·6 to –20·6)* –28·2 (–30·4 to –25·8)* 220·3 (149·3–306·5) –18·6 (–22·8 to –13·8)* –24·2 (–28·1 to –19·8)* Typhoid fever 1446·7 (1256·2 to 1 648·1) –18·3 (–20·8 to –15·6)* –23·9 (–26·3 to –21·3)* 191·0 (129·5–267·8) –17·7 (–22·1 to –12·6)* –23·2 (–27·4 to –18·5)* Typhoid fever episodes
aggregate 1197·9 (1041·3 to 1366·6) –18·3 (–21·7 to –14·8)* –23·9 (–27·1 to –20·5)* 113·3 (75·8–162·5) –18·1 (–22·6 to –13·4)* –23·7 (–27·8 to –19·2)* Complications of
typhoid fever aggregate
248·8 (210·8 to 292·2) –18·2 (–28·6 to –5·4)* –23·8 (–33·5 to –12·1)* 77·8 (51·6–110·8) –17·0 (–28·5 to –3·0)* –22·6 (–33·1 to –9·9)* Paratyphoid fever 529·3 (431·3 to 646·3) –17·8 (–22·6 to –12·7)* –23·8 (–28·2 to –19·2)* 27·5 (17·5–40·7) –17·5 (–24·7 to –9·2)* –23·5 (–30·1 to –16·1)* Paratyphoid fever episodes aggregate 502·2 (409·6 to 612·7) –17·8 (–22·6 to –12·4)* –23·8 (–28·2 to –19·0)* 24·4 (15·5–36·4) –17·5 (–24·9 to –8·7)* –23·5 (–30·7 to –15·5)* Intestinal perforation due to paratyphoid 27·1 (20·9 to 34·5) –17·6 (–33·0 to 1·4) –23·7 (–37·8 to –6·1)* 3·1 (1·9–4·6) –17·5 (–32·8 to 1·6) –23·6 (–37·7 to –5·9)* Other intestinal infectious
diseases ·· ·· ·· 1·8 (0·6–4·1) –67·0 (–78·8 to –45·8)* –69·3 (–80·2 to –50·1)* Lower respiratory infections 8986·6
(8545·2 to 9393·7) 5·1 (4·0 to 6·2)* –8·2 (–9·1 to –7·3)* 540·4 (365·3–760·3) 4·9 (3·5 to 6·3)* –8·1 (–9·2 to –7·0)* Lower respiratory infection episodes aggregate 8982·2 (8539·8 to 9387·9) 5·1 (4·0 to 6·2)* –8·2 (–9·1 to –7·3)* 539·1 (364·5–759·5) 4·9 (3·5 to 6·3)* –8·1 (–9·2 to –7·0)* Guillain-Barré syndrome
due to lower respiratory infections 4·4 (2·5 to 6·9) 16·9 (14·7 to 19·5)* –0·2 (–0·9 to 0·4) 1·3 (0·7–2·2) 16·9 (14·7 to 19·5)* –0·2 (–0·9 to 0·4) Upper respiratory infections 233 470·3
(208 009·7 to 259 076·8) 10·2 (8·9 to 11·5)* –1·4 (–2·0 to –0·8)* 2738·4 (1538·6–4644·3) 10·1 (8·9 to 11·5)* –1·3 (–1·9 to –0·6)* Upper respiratory infection
episodes aggregate 233 458·2 (207 997·9 to 259 065·2) 10·2 (8·9 to 11·5)* –1·4 (–2·0 to –0·8)* 2734·8 (1 533·9–4 641·4) 10·1 (8·9 to 11·5)* –1·3 (–1·9 to –0·6)* Guillain-Barré syndrome
due to upper respiratory infections 12·1 (9·6 to 15·2) 16·9 (14·7 to 19·5)* –0·2 (–0·9 to 0·4) 3·6 (2·2–5·4) 17·0 (14·7 to 19·5)* –0·2 (–0·9 to 0·4) (Table 3 continues on next page)