Rapport 17 - 2012
Nordic Expert Survey
on Future Foodborne
and Waterborne Outbreaks
Nordic Expert Survey
on Future Foodborne
and Waterborne Outbreaks
Tom Andersson1, Åse Fulke2, Susanna Pesonen3, Jørgen Schlundt4
1 Livsmedelsverket (National Food Agency), Sweden, Tom.Andersson@slv.se
2 Mattilsynet (Norwegian Food Safety Authority), Norway, Ase.Fulke@mattilsynet.no 3 Evira (Finnish Food Safety Authority), Finland, Susanna.Pesonen@evira.fi
4 DTU Fødevareinstituttet (National Food Institute, Technical University of Denmark), Denmark,
Content
Sammanfattning ... 2 Summary ... 4 Background ... 6 Method ... 8 Selection of experts ... 8Questionnaire and platform ... 9
Statistical analyses ... 10
Results ... 12
Demographics ... 12
Change in foodborne outbreaks ... 14
Estimation of foodborne outbreaks ... 15
Causes of foodborne outbreaks ... 16
Foodborne pathways ... 17
Foodborne agents ... 17
Vehicles of foodborne outbreaks ... 20
Critical points in the food chain ... 21
Control measures in the food chain ... 22
Change in waterborne outbreaks ... 23
Estimaton of waterborne outbreaks ... 24
Causes of waterborne outbreaks ... 24
Waterborne agents ... 26
Drivers of change in outbreak numbers ... 28
Population change ... 29
Consumer behaviour ... 30
Drivers of change in consumption ... 30
Discussion ... 32
Acknowledgements ... 34
Bibliography ... 35
Sammanfattning
Under perioden december 2011 till maj 2012 genomfördes en nordisk expertenkät på internet om livsmedelsburna och vattenburna utbrott i framtiden. Syftet var att undersöka expertuppfattningar och nationella perspektiv på framtida
utbrottsrisker. Vi testade också en ny metod att validera experters riskskattningar (Belief Score J). Inbjudningar skickades till 248 experter på hälsorisker med livsmedel och dricksvatten i Danmark, Finland, Norge och Sverige. Enkäten besvarades av 110 respondenter, dvs. en svarsfrekvens på 44,4 %. Analyserna inriktades på samband mellan svarsfrekvenser med hjälp av Pearsons Chi-square.
Sammanfattningsvis förväntade sig respondenterna att livsmedelsburna och vattenburna utbrott kommer att öka till antalet med omkring 10-20 % under perioden 2011-2020 i jämförelse med 2001-2010. Respondenter med lång professionell erfarenhet av riskvärderingar förväntade sig en större ökning än respondenter med en mer begränsad erfarenhet. Uppfattningarna om orsaker och drivkrafter till framtida ökningar var både generella och varierande beroende på professionell erfarenhet av riskanalys, utbildningsbakgrund och nationalitet. Den generella bilden av en potentiell framtida ökning av antalet livsmedelsburna utbrott kan sammanfattas med följande scenario:
Importerade livsmedel, i synnerhet råa grönsaker, förorenade med oreglerade ämnen, virus eller bakterier, tillagade i offentliga miljöer där kunskapen om
livsmedelssäkerhet brister, serverade till grupper med hög andel äldre personer.
Experternas uppfattningar varierade till viss del beroende på professionell erfarenhet av riskanalys, utbildningsbakgrund och nationalitet. Lång erfarenhet av riskhantering var kopplad till starkare förväntningar på virus som livsmedelsburna agens, samt grönsaker som utbrottskälla. En bakgrund inom mikrobiologi var vidare kopplad till starkare förväntningar på importerade varor som utbrottskälla. Svenska respondenter valde oftare än andra respondenter örter och kryddor som trolig källa, kanske på grund av erfarenheterna av Ehec-utbrottet i Tyskland och Frankrike. Finska respondenter såg oftare fisk som utbrottskälla, något som kan bero på en större import av fiskprodukter i Finland.
Även om undersökningen visade på demografiska skillnader var likheterna (scenariot ovan) starkare än skillnaderna. Skillnaderna var dock tillräckliga för att väcka frågor om hur våra riskbedömningar påverkas av vår bakgrund. Till viss del är demografiska faktorer sammanflätade. Vem som anses vara en expert på
framtida risker beror på institutionella och organisatoriska frågor som till viss del är specifika för varje land. Hur det fungerar i praktiken förblir en obesvarad fråga, men som bör belysas i framtida forskning om risker och beslutsfattande.
Vem är egentligen expert på framtida risker? När vi siar om framtiden ställs vi alla inför osäkerhet, såväl experter som lekmän. Allas våra bedömningar färgas av personliga erfarenheter och värderingar, i någon mån. Inte ens en större grupp
och påverkar riskuppfattningar och bedömningar. Det är skäl nog att belysa och jämföra expertbedömningar inom och mellan länder.
Summary
An expert internet-based survey on future foodborne and waterborne outbreaks was conducted from December 2011 to May 2012 in Denmark, Finland, Norway and Sweden. Invitations were sent to 248 experts in the management and
assessment of food-related hazards and diseases. The survey was completed by 110 respondents (Denmark: 21; Finland: 21; Norway: 34; Sweden: 34), resulting in a response rate of 44.4%. The analyses consisted primarily of response
frequencies and Pearson’s Chi-square (χ2) statistics. A novelty was a new method of ranking likelihood, enabling evaluation of probability judgments.
Overall, the respondents expected the numbers of foodborne and waterborne outbreaks to increase by 10-20% in 2011-2020 compared with 2001-2010. Respondents with long professional experience of risk assessment tended to expect a larger increase than respondents with more limited experience. The opinions on the causes and drivers of such change showed general patterns, as well as variations depending on professional experience of risk analysis,
education and nationality. The general view of a future increase in the number of foodborne outbreaks related to the following scenario:
Imported food, particularly raw vegetables, contaminated with unregulated agents, viruses or bacteria, prepared in public food service facilities with deficient food safety knowledge, served to a population with an increasing share of elderly people.
The sources and causes selected as likely also varied depending on professional experience of risk analysis, as well as nationality and educational background. A background in microbiology was associated with stronger
expectations of imported goods as vehicles. Long experience of risk management experience went with stronger expectations of viruses as foodborne agents and of vegetables as vehicles. Swedish respondents selected more often than other respondents herbs and spices as likely vehicles of foodborne transmission, perhaps due to recent experience of the severe EHEC outbreak in Germany and France. In contrast, Finnish respondents selected more often than others fish as likely vehicles, perhaps due a larger share of imported fish products.
While the survey demonstrated some differences between professions and countries, the commonalities (the scenario above) were stronger than the
differences. However, the variation that exists raises questions about the relative contributions of professional experience and nationality to judgments of future risks. To some extent, these factors appear intertwined. The professions
considered to be expert on future risks may also depend on institutional and organisational issues that are specific to each country. This is too often a
neglected issue that needs to be addressed in future research and policy making on future risks.
When estimating potential changes in the future, we face uncertainty and must to some extent rely on personal knowledge and experiences. However, It is still not clear how a limited pool of experts can be used to disentangle the many
interacting factors that influence our perception of future risks. To evaluate the contributions of nationality, education and professional experience to expert risk perceptions, we need large and representative samples of experts in the food sector, which may in fact not exist. Who is actually an expert on future risks?
Background
The main objective of food safety authorities is to ensure healthy food commodities on the market. Their work involves the task of tracking and
assessing future changes in food safety risks, i.e. identifying so-called “emerging risks”. Within the European Union (EU), part of this task falls under the emerging risk unit (EMRISK) of the European Food Safety Authority (EFSA). At the national level, official organisational structures and resources for identifying “emerging risks” are usually lacking.
“Only a few countries have developed a dedicated horizon scanning or foresight program to identify future risks and opportunities for food and feed safety”. (1)
Emerging risk identification is more often than not an informal and distributed task among experts in risk analysis, i.e. risk assessment, risk
management and risk communication. It involves everyday intelligence work in diverse domains, e.g. food production and distribution, microbiology, toxicology and chemistry. The two organisational levels, i.e. EMRISK and national experts, are bridged by the Emerging Risks Exchange Network (EREN), which consists of member state representatives exchanging information on emerging issues and risks. Within this institutional framework, the representatives of the Nordic countries (Denmark, Finland, Norway and Sweden) decided to conduct an expert survey on future foodborne and waterborne outbreaks, the aim being to develop and test methods for identification of emerging risks, and to map and compare national and professional differences in the perception of emerging risks.
“Overall, our experience shows that ERI [Emerging Risks Identification] requires a high level of expertise due to major data gaps and uncertainties in the evaluation process”. (2)
Expert knowledge and judgments are considered essential for emerging risk identification (ERI), i.e. identifying new or increased threats against or within the food chain. Identification is then strongly related to scientific validation,
subordinating ERI to separate scientific domains. This makes it difficult to integrate and compare risk observations across different fields of expertise, or to carry out broad trend analysis of emerging risks. To get a broader picture of uncertain futures, we must go beyond given facts and rely on systematic pooling of expert opinions and perceptions (3).
The purpose of the Nordic expert survey was to map and compare expert opinions and perceptions on future foodborne and waterborne outbreaks. Instead of relying on scientific classifications of hazards, threats or agents, we allowed the survey to be guided by a topic of general concern, i.e. future foodborne and
topic. First, it is an important and relevant emerging issue for food safety authorities and the general public. Second, in contrast to long-term food safety issues, e.g. cancer, the topic refers to single events, outbreaks, making it easier to rely on everyday observations and experiences. Third, the topic goes beyond any single area of expertise, motivating a survey among experts in different areas of expertise. Thus, it is a good starting point for developing and testing a Nordic panel on emerging issues and risks.
Method
Selection of experts
Designing an expert survey may come close to being a paradox. A survey is often meant to capture representative opinions or perceptions among people in a larger population, but experts are neither a homogeneous population nor a large
population. In fact, it is far from clear who actually belongs to the group “food safety experts”. The group represents a loosely defined professional culture, rather than a well-defined population. Therefore, expert surveys should not be confused with statistical samples. Care must be taken in extrapolating to other experts beyond the selection of experts in question.
Another difficulty in using experts for comparative studies is the national differences that exist in institutional and organisational structures. On the one hand, an optimal selection of experts would be one that controls for national differences in professional roles and structures. On the other hand, being
interested in national differences, we should allow for differences in experts, and account for the national variation by background questions.
In the current study, the selection of experts involved two sampling strategies, expert sampling and snowball sampling, with expert sampling dominating in Norway and Finland and snowball sampling in Denmark and Sweden, particularly in Sweden. Expert sampling involves the selection of people according to well-defined knowledge criteria, i.e. belonging to a specific list or group of experts, e.g. an outbreak expert group. In contrast, snowball sampling involves step-by-step recruitment, by having experts already recruited recommend other experts to be invited.
In Denmark, survey invitations were sent to the Central Outbreak Management Group (COMG), which is made up of representatives from the Danish Veterinary and Food Administration, the National Food Institute, the Technical University of Denmark and Statens Seruminstitut. This sampling was supplemented with snowball sampling of central, regional and local experts in foodborne and waterborne hazards, i.e. the selected participants in the COMG were asked to recommend one or more other experts relevant for enrolment in the study.
In Finland, the national representative opted to select experts one by one based on their knowledge of, and experience in, foodborne and waterborne diseases, which resulted in a restricted pool of experts.
In Norway, the food safety authority makes use of an external science committee, with experts in science and medicine. We sent survey invitations by mail to all members of this science committee.
recommend experts relevant for the survey. The choice of initial experts was made on the basis of expertise concerning foodborne hazards and diseases, including drinking water.
Questionnaire and platform
During autumn 2011, we developed an internet-based expert questionnaire in English on the platform SurveyMonkey, addressing the issue of potential changes in future outbreaks of human foodborne and waterborne diseases. The future in this case referred to the decade 2011-2020, compared with the previous decade, 2001-2010. The questionnaire is fully reproduced in the Appendix. It consisted of 19 questions covering expert beliefs about outbreak trends, the outbreak
characteristics of a potential positive trend, the drivers of such a potentially increasing number of outbreaks, and background questions on nationality, education and professional experience of risk management, risk assessment and risk communication. The overall structure was: (1) Likely outbreak trends, (2) likely outbreak ingredients and characteristics, and (3) likely global drivers and forces. The questionnaire began with two questions about the respondents’ personal beliefs concerning the future number of foodborne outbreaks. It then proceeded to questions about likely causes, agents and vehicles. This was followed by similar questions about waterborne outbreaks. Finally, forces and drivers of change were addressed with questions about more complex factors and requests for explanations for increasing numbers of outbreaks.
The questionnaire was designed to capture and represent what respondents believe are likely future scenarios of increasing numbers of outbreaks. Even if an expert did not believe in a positive trend, he or she was asked about what would create such a trend. In principle, the number of future scenarios is unlimited. In practice, it was limited due to various considerations. The time needed to complete the questionnaire was one important factor, since when dealing with experts’ time is highly limited. The time frame was set to 20-30 minutes, allowing for 20-30 questions. To secure efficient coding of answers, the question format was mostly closed, but additional free comments were allowed. Answer options to a single survey question were presented in random order.
The specific design of questions and answer options was guided by the concept of risk and its three components: (1) Hazards, e.g. foodborne or
waterborne agents, (2) forms of exposure, i.e. quantitative and qualitative patterns of consumption, e.g. agent concentrations in different vehicles, and (3)
susceptibility of different age and consumer groups to different hazards. Our starting hypothesis was that future changes in outbreak frequencies are primarily perceived as extrinsic rather than intrinsic, i.e. causes and drivers are foreign rather than domestic, e.g. new agents and vehicles rather than an increasingly susceptible ageing population. However, the study was primarily explorative, rather than being directed by specific hypotheses.
The final questionnaire was the result of a process of deliberation over time involving discussions and pilot testing, with the aim of representing general
outbreak characteristics, causes and drivers of change. Inspiration was also derived from previous research reports on expert elicitation (4, 5, 6, 7, 8, 9, 10, 11, 12). The survey was initially tested on pilot scale and then revised. The final version was ready in January 2012. Answers were collected until May 2012.
Statistical analyses
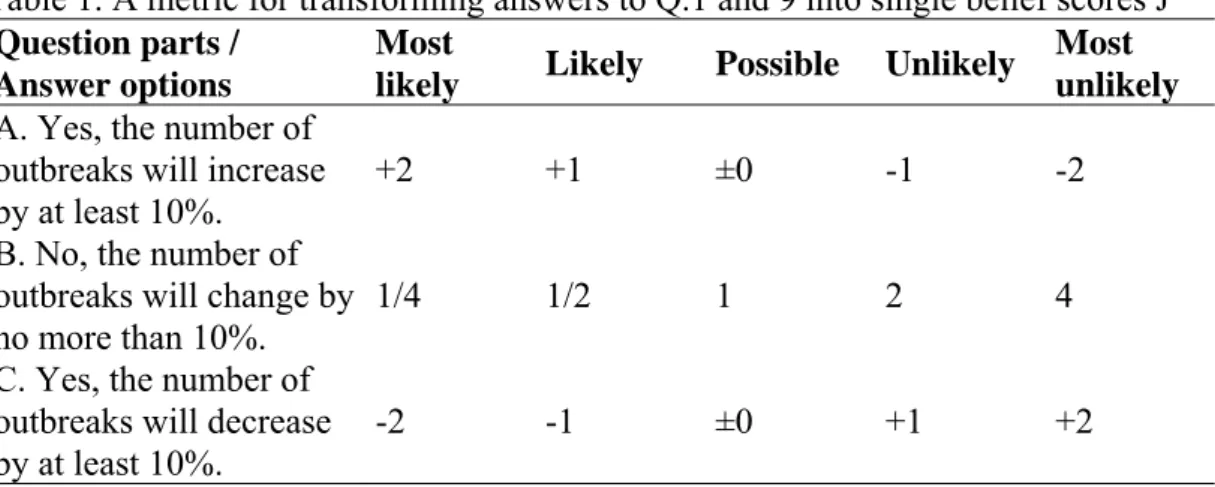
The questionnaire included four questions about the direction and magnitude of future change in the number of foodborne and waterborne outbreaks (Q.1, 2, 9 and 10). Two of these questions were qualitative in nature (Q.1 and 9) and the other two were quantitative (Q.2 and 10). To enable comparisons between the different types of answers, we constructed a metric that transformed the two qualitative questions (Q.1 and 9) into a single measure of expert belief in change. The qualitative questions comprised three parts (A, B and C in Table 1), with five answer options to each part (Most likely, Likely, Possible, Unlikely, Most
unlikely). The answers to the three question parts were then combined and integrated into a single belief score ‘J’ using the equation:
J= (A+C)*B
Table 1. A metric for transforming answers to Q.1 and 9 into single belief scores J
Question parts / Answer options
Most
likely Likely Possible Unlikely Most unlikely
A. Yes, the number of outbreaks will increase by at least 10%.
+2 +1 ±0 -1 -2 B. No, the number of
outbreaks will change by no more than 10%.
1/4 1/2 1 2 4 C. Yes, the number of
outbreaks will decrease by at least 10%.
-2 -1 ±0 +1 +2 The values for the question parts A and C, ‘An increase by at least 10%’ and ‘A decrease by at least 10%’, were added and multiplied by the values for the question part B, ‘No change’. At one extreme, we had a strong belief in an increased number of outbreaks (+2), which was added to a strong disbelief in a decrease in the number of outbreaks (+2). The sum was multiplied by a strong disbelief in no change (4), resulting in a maximum score of +16 for a belief in a positive outbreak trend. The reverse, i.e. maximum disbelief in an increase, maximum belief in a decrease and maximum disbelief in the status quo, resulted in a minimum score of -16. Between these two extremes, there were weaker beliefs and higher uncertainty regarding future outbreak trends. By correlating belief scores and expert estimates of future change, we were able to check for consistency.
We conducted an ANOVA (Analysis of Variance) of the J scores, using country name, experience group (high or low experience in risk management, risk assessment and risk communication) and educational background as factors. Due to the limited number of participants and factor correlations we did not include all factors at once, but conducted an ANOVA on each country and then controlled for each experience group and educational background in turn.
For the remaining outbreak questions, we summarised the answers in the form of frequency tables. Due to the limited number of respondents, we avoided rendering the results as percentages. For the purpose of testing associations between variables (questions) using Chi-square statistics, the number of answer options is often reduced, merging the responses ‘Most likely’ and ‘Likely’ into one class ‘Likely’, and the responses ‘Possible’, ‘Unlikely’ and ‘Most unlikely’ into another class ‘Not likely’. This re-coding is meant to stress the contrast between beliefs versus non-beliefs. Re-coding the option ‘Possible’ together with ‘Likely’ and ‘Most likely’ would instead put the emphasis on the contrast between doubt (‘Unlikely’ and ‘Most unlikely’) versus non-doubt.
To allow for cross-tabulations, answers to one background question, i.e. the number of years of professional experience of risk analysis, were re-coded into high and low experience. The median was used as the coding criterion. For each variable – risk management, assessment and communication – a respondent was classified as ‘high’ or ‘low’ in experience depending on whether his or her
estimate was above or below the median of the variable in question. We then used these categorisations rather than the original categories. In general, we used cross-tabulation and Chi-square statistics to analyse associations between discrete variables and correlation and ANOVA to analyse associations between continuous variables. The presentation of test results is limited to the strongest associations for each question, to avoid too many details.
Results
Demographics
Invitations were sent to 248 experts in Denmark, Finland, Norway and Sweden. By the end of May, 110 respondents had completed the questionnaire, giving a response rate of 44.4%. The rate varied among countries, with a higher rate for Finland and a lower rate for Norway (Table 2). This variation may in part be explained by the different recruitment strategies. In Norway, we turned to a broad group of risk assessors in the science committee, for which the relevance of outbreak issues is not transparent. In Finland, invitations were more selective, from one expert to another, which may have increased the relevance of the study for prospective participants.
Table 2. Number of participants, number of invitations issued, and response rate for each of the four countries in the survey
Country No. of Participants
No. of
Invitations Response rate
Denmark 21 51 41.2%
Finland 21 38 55.3% Norway 34 86 39.5% Sweden 34 73 46.6%
The average number of years of professional experience of risk analysis reported by the respondents is shown in Table 3. However, this is a rather unclear estimate, as we did not know how the respondents interpreted ‘Years of
experience’ and what it implies in practice. Nevertheless, any large difference in professional experience between countries provides a frame of reference for interpreting other national differences.
As Table 3 indicates, the Norwegian respondents had longer experience of risk assessment than risk management, unlike the other nationalities. The opposite tendency applied for the Finnish respondents. ANOVA revealed that the
difference in experience of risk management and assessment was statistically significant, F(3,106)=7.505, p<0.001. A more detailed analysis showed that the difference was only significant for Norway. The variation among respondents was large. There was no significant difference between countries in professional experience of risk communication, F(3,106)<1.
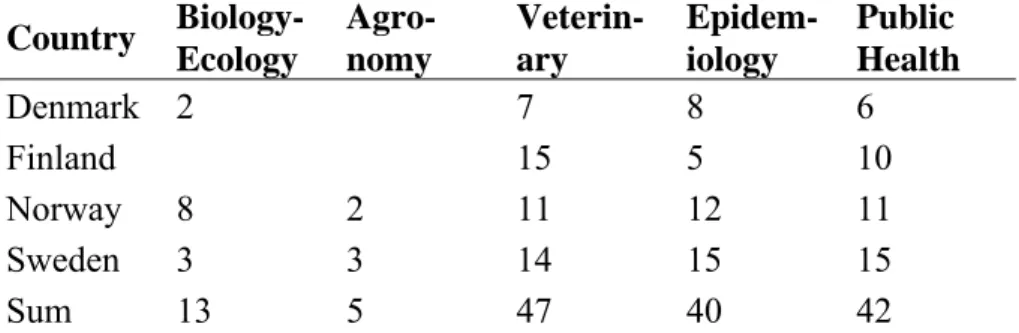
The educational background of the respondents added to the contrast between Finland and Norway, with the educational profile for Finland comparatively characterised by veterinary medicine and the profile for Norway by nutrition,
characterised the Swedish respondents, whereas food technology was relatively strong among the Danish respondents. Consequently, any national differences in expert opinions on future outbreak risks may be due to different professional experiences of risk analysis or educational background among respondents, rather than true general differences.
Table 3. Professional experience of risk analysis in the different countries (standard error of the mean in brackets – SEM)
Country
Professional experience of risk analysis (mean number of years)
Management Assessment Communication
Denmark 11.6 (1.5) 9.0 (1.1) 8.8 (1.1) Finland 12.9 (1.8) 6.6 (1.3) 8.4 (1.2) Norway 4.9 (1.4) 12.1 (2.3) 7.2 (1.3) Sweden 7.4 (1.5) 6.9 (1.2) 4.0 (1.0) All countries 8.4 (0.8) 9.0 (0.9) 6.9 (0.6)
Table 4. Educational background of respondents I (multiple choices possible for each respondent) Country Water Techno-logy Food Techno-logy Nutrition Chem-istry Toxico-logy Micro-biology Denmark 1 5 5 2 1 8 Finland 1 2 1 1 11 Norway 1 2 12 7 14 13 Sweden 5 5 2 5 20 Sum 8 14 20 15 15 52
Table 5. Educational backgrounds of respondents II (multiple choices possible for each respondent) Country Biology-Ecology Agro-nomy Veterin-ary Epidem-iology Public Health Denmark 2 7 8 6 Finland 15 5 10 Norway 8 2 11 12 11 Sweden 3 3 14 15 15 Sum 13 5 47 40 42
In the remaining presentation of results, the response data and the analyses of each question are described in turn, from Question 1 to Question 16.
Change in foodborne outbreaks
Question 1. Will the number of foodborne outbreaks change in your country for the period 2011-2020 compared with the period 2001-2010?
The general opinion of the respondents on the change in the number of outbreaks was slightly in favour of an increase (Table 6). The number of ‘Most likely’ and ‘Likely’ responses was higher for an increase than for a decrease and the number of ‘Most unlikely’ and ‘Unlikely’ responses was clearly higher for a decrease than for an increase.
Table 6. Response frequencies for future changes in foodborne outbreaks
Answer options chosen by: no. of respondents
Most
likely Likely Possible Unlikely
Most
unlikely Sum
No, the number of outbreaks will change by no more than 10%.
9 39 45 16 1 110 Yes, the number of
outbreaks will increase by at least 10%.
5 31 47 25 2 110 Yes, the number of
outbreaks will decrease by at least 10%.
0 8 26 61 15 110
The belief score J combined and integrated the respondents’ answers to the three question parts. It was defined to produce a single measure of the
respondents’ belief in change (see the Method section for an operational definition). The majority of the respondents (n=63, 57.3%) had J scores > 0, indicating an opinion in favour of an increase in the number of foodborne outbreaks. Table 7 shows the mean score per country. The score was higher for Norway, in particular compared with Denmark, although the variation (SEM) was high. Among Norwegian respondents, 23 had J scores larger than 0 (67.6%). The corresponding figure among Danish respondents was 8 (38.1%).
ANOVA of the J scores identified one significant factor, experience of risk assessment (F(1,108)=4.83, MSE=3.93, p=0.03). High experience of risk
assessment was accompanied by higher J scores. The trend for Norway was close to being statistically significant, but the experience factor explained the variance better than the country factor. The same results were obtained by Chi-squaretests of frequency tables for the responses ‘Most likely’ and ‘Likely’ to the statement
“Yes, the number of outbreaks will increase by at least 10%”, cross-tabulated by country and experience (‘high’ versus ‘low’).
Table 7. Belief score J for foodborne outbreaks according to respondents from the different countries
Country Mean J SEM*
Denmark 0.46 0.32
Finland 0.95 0.31
Norway 1.59 0.48
Sweden 1.03 0.26
All 1.08 0.19 *Standard Error of the Mean
Estimation of foodborne outbreaks
Question 2. Please give your estimate of the change in the number of foodborne outbreaks in your country.
Four respondents did not provide any estimate. Furthermore, some answers were probably due to a misunderstanding of the question format, i.e. estimation of the relative change in the number of outbreaks. The J score allowed the
consistency of the estimates provided to be checked. In Figure 1, the estimates are plotted against the belief scores J. The correlation was modest (0.34), indicating a need for closer evaluation.
Two respondents appeared to have given their estimates in percentage terms, instead of relative numbers as required. Furthermore, six respondents gave estimates that were impossible to reconcile with their answers to question 1. For example, despite having evaluated an increase as unlikely and a decrease as likely, one respondent estimated the relative increase as 5 (500%). In cases where a mistake was obvious, we treated the estimate as a missing value. In one case, we adjusted an estimate in agreement with the belief score J, from 10 to 1.1. After these adjustments, the correlation between estimates and J scores rose from 0.34 to 0.62. Another 20 estimates were incompatible with the J scores, but not inconsistent in direction, e.g. judging all scenarios as equally likely, giving 0 in J score, but still estimating the change as 1.05. Incompatible estimate and J score values were left unadjusted.
The overall mean of adjusted estimates was 1.17, i.e. an increase of 17%. The contrast between Norway and Denmark was weaker for estimates (Table 8) than for J scores (Table 7), but the variance was also lower for estimates. When conducting ANOVAs of estimates, Norway was the only significant factor (F(1,98)=10.04, MSE=0.064, p=0.002). Neither education nor experience of risk analysis made a difference when controlling for country. Without control, a background in toxicology was related to higher estimates, β=0.195, t(98)=2.46, p=0.016.
Figure 1. Expert opinion on change. Two measures of the change in the future number of foodborne outbreaks, i.e. estimate of relative change with respect to belief score J.
Table 8. Estimates of relative numbers of foodborne outbreaks made by respondents in the different countries
Country No. of Estimates Mean SEM*
Denmark 18 1.07 0.04
Finland 17 1.12 0.04
Norway 29 1.3 0.07
Sweden 34 1.15 0.04
All 98 1.17 0.03 *Standard Error of the Mean
Causes of foodborne outbreaks
Question 3. Which causes are likely or unlikely to lead to an increase in the number of foodborne outbreaks in your country?
Increasing exposure to known agents, followed by new agents, were more often considered likely causes for an increasing number of outbreaks (Table 9). Exhaustive Chi-square tests of frequency tables of response counts with respect to
belief and demographics (country, experience level and educational background) did not reveal any co-variation.
Table 9. Response frequencies for prospective causes of a change in foodborne outbreaks Number of affirmative responses per answer option Likelihood level Most
likely Likely Possible Unlikely
Most unlikely Sum Increasing exposure to known foodborne disease agents. 15 51 34 10 0 110 The emergence of new foodborne disease agents, or new variants of known agents. 14 44 43 9 0 110 Increasing susceptibility to known foodborne disease agents. 9 15 28 51 7 110
Foodborne pathways
Question 4. Which exposures are likely or not to contribute to an increasing number of foodborne outbreaks in your country during 2011-2020 compared with 2001-2010?
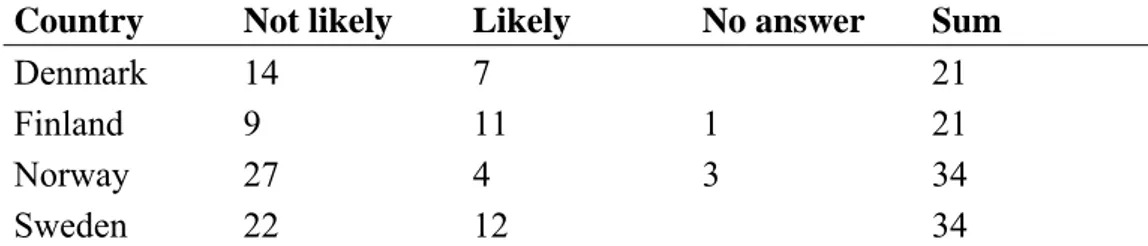
The spread of non-regulated agents through new food vehicles was more often considered a likely route (Table 10). Finnish respondents selected regulated agents in new vehicles more often as a likely pathway, whereas Norwegian respondents chose this alternative more often as unlikely, χ2(3)= 10.2, p=0.017 (Table 11). Finally, a background in microbiology favoured unregulated agents in known vehicles as a likely pathway, χ2(1)= 7.12, p=0.008 (Table 12).
Foodborne agents
Question 5. Which agents of foodborne diseases are likely to contribute to a significant increase in the number of outbreaks in your country during 2011-2020 compared with 2001-2010?
Bacteria and viruses were more often than other agents indicated as likely agents of an increasing number of outbreaks (Table 13). Swedish respondents selected parasites more often as likely agents, χ2(3)= 12.2, p=0.007, while
Norwegian respondents selected viruses less often as likely, χ2(3)= 17.8, p<0.001, and mycotoxins more often as likely, χ2(3)= 11.9, p=0.008 (Table 14).
Management experience was related to more likely responses to viruses, χ2(1)= 7.25, p=0.007 (Table 15).
Table 10. Response frequencies for prospective exposure pathways
Number of affirmative responses per answer option
Likelihood level
Likely Possible Unlikely Sum
Increased exposure through new food vehicles to agents not subject to food safety regulations.
48 48 9 105 Increased exposure through
known food vehicles to agents not subject to food safety regulations.
38 59 9 106 Increased exposure through
new food vehicles to agents subject to food safety regulations.
34 57 15 106 Increased exposure through
known food vehicles to agents subject to food safety regulations.
28 49 29 106
Table 11. Response frequencies for the pathway “Regulated agents and new vehicles” by country
Country Not likely Likely No answer Sum
Denmark 14 7 21
Finland 9 11 1 21
Norway 27 4 3 34
Table 12. Response frequencies for the pathway “Unregulated agents and known vehicles” by background
Microbiology Not likely Likely No answer Sum
No 43 13 2 58
Yes 25 25 2 52
Table 13. Response frequencies for prospective foodborne agents
Agent Likely Possible Unlikely Sum
Bacteria 77 29 4 110
Viruses 73 33 4 110
Allergens 33 45 32 110
Parasites 32 43 35 110
Microbial toxins in food 30 65 14 109 Mycotoxins 28 46 36 110 Marine toxins 18 62 29 109 Plant toxins 16 42 52 110 Environmental chemicals 12 45 53 110 Processing chemicals 10 44 56 110 Infectious proteins (prions) 2 27 80 109 Other foodborne agents 6 72 22 100 Table 14. Opinions on prospective agents by country
Country
Parasites Viruses Mycotoxins Not likely Likely Not likely Likely Not likely Likely Denmark 19 2 5 16 19 2 Finland 17 4 5 16 19 2 Norway 25 9 21 13 19 15 Sweden 17 17 6 28 25 9
Table 15. Opinions on prospective viruses by management experience
Management experience
Viruses
Not likely Likely Sum
Low 26 30 56
Vehicles of foodborne outbreaks
Question 6. Which food commodities are likely disease agent vehicles for an increasing number of foodborne outbreaks in your country during 2011-2020 compared with 2001-2010?
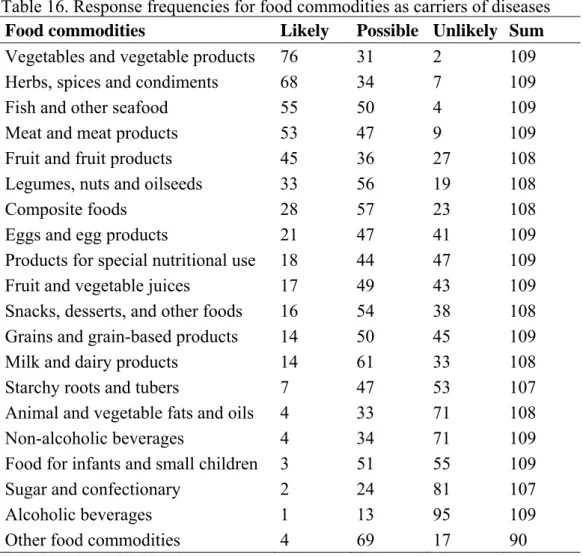
The majority of respondents indicated vegetables and herbs as a likely vehicle for a future increase in the number of foodborne outbreaks (Table 16). About half the respondents opted for meat and seafood as likely vehicles. Several national differences were noted.
Table 16. Response frequencies for food commodities as carriers of diseases
Food commodities Likely Possible Unlikely Sum
Vegetables and vegetable products 76 31 2 109 Herbs, spices and condiments 68 34 7 109 Fish and other seafood 55 50 4 109 Meat and meat products 53 47 9 109 Fruit and fruit products 45 36 27 108 Legumes, nuts and oilseeds 33 56 19 108
Composite foods 28 57 23 108 Eggs and egg products 21 47 41 109
Products for special nutritional use 18 44 47 109 Fruit and vegetable juices 17 49 43 109 Snacks, desserts, and other foods 16 54 38 108 Grains and grain-based products 14 50 45 109 Milk and dairy products 14 61 33 108 Starchy roots and tubers 7 47 53 107 Animal and vegetable fats and oils 4 33 71 108
Non-alcoholic beverages 4 34 71 109 Food for infants and small children 3 51 55 109
Sugar and confectionary 2 24 81 107
Alcoholic beverages 1 13 95 109 Other food commodities 4 69 17 90
Vegetables evoked fewer ‘Likely’ responses among Norwegians, χ2(1)= 5.49, p=0.019 (Table 17), but management experience was an equally strong
explanatory factor, χ2(1)= 5.95, p=0.015 (Table 18), with more ‘Likely’ responses among respondents with long experience. This is in line with Norwegian
respondents having longer assessment experience, but shorter management experience. Furthermore, Swedish respondents considered herbs more often as a likely vehicle, whereas Norwegian respondents did the opposite, ticking herbs less
often as a likely vehicle, χ2(3)= 15.7, p=0.001. Finnish respondents selected fish more often as a likely vehicle, χ2(3)= 15.0, p=0.002. An educational background in toxicology reduced the number of likely responses to herbs as vehicles, χ2(1)= 7.77, p=0.005 (Table 19).
Table 17. Opinions on vegetables, herbs and fish as prospective carriers by country
Country
Vegetables Herbs Fish Not likely Likely Not likely Likely Not likely Likely Denmark 6 15 7 14 15 6 Finland 4 17 8 13 5 16 Norway 16 18 21 13 22 12 Sweden 7 26 5 28 12 21
Table 18. Opinions on prospective vegetable carriers by management experience
Management experience Vegetables
Not likely Likely Sum
Low 23 32 55
High 10 44 54
Table 19. Opinions on prospective herb carriers by background in toxicology
Education in toxicology Herbs
Not likely Likely Sum
No 30 64 94
Yes 11 4 15
Critical points in the food chain
Question 7. Which points in the food chain are likely or unlikely points of agent proliferation generating an increasing number of foodborne outbreaks in your country during 2011-2020 compared with 2001-2010?
A clear majority of the respondents selected imports and food service facilities (restaurants and catering) as likely points of agent proliferation (Table 20). Only one demographic factor interacted with the likelihood estimations. A background in microbiology favoured households as points of proliferation, χ2(1)= 5.88, p=0.015 (Table 21).
Table 20. Response frequencies for likely critical points of agent proliferation
Critical point Likely Possible Unlikely Sum
Imports 86 24 0 110
Primary production 38 60 11 109 Food processing industry 32 62 15 109 Food transport 17 56 36 109 Restaurants and catering 72 37 1 110
Health care institutions 24 54 32 110
Households 47 54 9 110
Other critical point 2 64 17 83 Table 21. Opinion on households as prospective points of proliferation by background in microbiology
Education in microbiology
Households
Not likely Likely Sum
No 40 18 58
Yes 23 29 52
Control measures in the food chain
Question 8. Which control measures in food production are likely or unlikely to enable mitigation of an increasing number of foodborne outbreaks in your country during 2011-2020 compared with 2001-2010?
Food safety knowledge was most frequently selected as a likely measure for mitigation (Table 22). All respondents with background in water technology considered a change in processing technology to be a likely measure of hazard control, χ2(1)=7.97, p=0.005 (Table 23). A veterinary background favoured the purchase of raw material as a likely measure for mitigation, χ2(1)=6.48, p=0.011. Table 22. Response frequencies for future effective hazard controls
Hazard controls Likely Possible Unlikely Sum
Food safety knowledge 78 22 9 109 Water, soil and air management 52 40 16 108 Purchase of raw material 52 50 7 109
Food storage 51 49 9 109
Change of processing technology 50 55 4 109 Other control measures 11 65 7 83
Table 23. Opinions on resource management and raw material as likely control measures by background Education in water technology Processing technology Education in veterinary medicine Raw material Not likely Likely Not likely Likely No 59 42 No 40 23 Yes 0 8 Yes 17 29
Change in waterborne outbreaks
Question 9. Will the number of waterborne outbreaks change in your country for the period 2011-2020 compared with the period 2001-2010?
The responses to future changes in waterborne outbreaks demonstrated similar patterns to the responses regarding future changes in foodborne outbreaks. Thus the responses favoured an increase in the number of waterborne outbreaks (Table 24), but national contrasts were weaker (Table 25), with no significant differences in J scores. Matched-pair t-tests of the difference in J scores for foodborne and waterborne outbreaks showed that this was not significant. Educational background in nutrition provided the only significant factor, favouring higher J scores, i.e. a stronger belief in an increasing number of outbreaks, β=1.34, t(108)=2.44, p=0.016.
Table 24. Response frequencies for future changes in the number of waterborne outbreaks
Answer option / no. of responses
Most
likely Likely Possible Unlikely
Most
unlikely Sum
Yes, the number of outbreaks will increase by at least 10%.
8 31 33 32 6 110 No, the number of
outbreaks will change by no more than 10%.
13 30 52 14 1 110 Yes, the number of
outbreaks will decrease by at least 10%.
Table 25. Belief score J for waterborne outbreaks
Country Mean J SEM*
Denmark 0.99 0.38
Finland 0.67 0.24
Norway 1.04 0.52
Sweden 1.38 0.37
All 1.06 0.22
*Standard Error of the Mean
Estimaton of waterborne outbreaks
Question 10. Please give your estimate of the change in the number of waterborne outbreaks in your country.
As for foodborne outbreaks, we used the J scores for waterborne outbreaks to adjust the estimates of relative change in the number of waterborne outbreaks. The correlation between J scores and estimates was 0.39 before adjustment and 0.44 after adjustment.
The mean estimate of the relative change in the number of outbreaks was 1.22, i.e. an increase of 22% (Table 26). The only demographic factor that made a difference in estimates of change was an educational background in chemistry, favouring higher estimates, β=0.26, t(105)=2.13, p=0.036. The difference in estimates of change between foodborne and waterborne outbreaks was not significant (matched-pair t-test).
Table 26. Estimates of relative numbers of waterborne outbreaks
Country # Estimates Mean SEM*
Denmark 21 1.18 0.09
Finland 20 1.09 0.06
Norway 32 1.22 0.09
Sweden 34 1.33 0.08
All 107 1.22 0.04 *Standard Error of the Mean
Causes of waterborne outbreaks
Question 11. Which causes are likely or unlikely to lead to an increase in the number of waterborne outbreaks in your country?
Compared with the causes selected for foodborne outbreaks, the cause “New agent” was not chosen as frequently in the attribution of waterborne outbreaks, χ2(1)=5.60, p=0.018. More often it was the second choice of cause, “Increasing
exposure to previously known agents”, that was chosen, χ2(1)=3.87, p=0.049 (Tables 9, 27 and 28).
Table 27. Response frequencies for causes of change in waterborne outbreaks
Number of affirmative responses per answer option Likelihood level Most
likely Likely Possible Unlikely
Most unlikely Sum Increasing exposure to known foodborne disease agents. 38 42 19 9 2 110 The emergence of new foodborne disease agents, or new variants of known agents. 5 27 49 28 1 110 Increasing susceptibility to known foodborne disease agents. 6 12 32 51 9 110
Table 28. Response frequencies for causes of future foodborne and waterborne outbreaks Foodborne agent likely cause Waterborne agent likely cause Food exposure likely cause
Water exposure likely cause
No Yes Sum No Yes Sum
No 43 9 52 No 17 27 44
Yes 35 23 58 Yes 13 53 66
Sum 78 32 110 Sum 30 80 110
The causes selected for an increasing number of waterborne outbreaks interacted with nationality, with Swedish and Norwegian respondents more often selecting new agents as likely causes, χ2(3)=10.5, p=0.015 (Table 29).
Respondents with a background in microbiology more often selected increasing exposure, χ2(1)=4.03, p=0.045 (Table 30).
Table 29. Response frequencies for new agents as likely causes of change in waterborne outbreaks
Country Not likely Likely Sum
Denmark 18 3 21
Finland 19 2 21
Norway 19 15 34
Sweden 22 12 34
Table 30. Opinions on increasing exposure as a likely cause of change in waterborne outbreaks by education in microbiology
Education in microbiology
Increasing exposure
Not likely Likely Sum
No 21 37 58
Yes 9 43 52
Waterborne agents
Question 12. Which agents of waterborne diseases are likely or unlikely to contribute to a significant increase in the number of outbreaks in your country during 2011-2020 compared with 2001-2010?
The two most likely agents of an increasing number of waterborne outbreaks were the same as the two most likely agents of foodborne outbreaks, e.g. bacteria and viruses, although in reverse order (Tables 13 and 31). Parasites and
environmental chemicals were also more frequently selected as likely agents of waterborne outbreaks. Compared with Danish and Finnish respondents, Swedish and Norwegian respondents more often selected parasites as likely agents, χ2(3)=22.26, p<0.001 (Table 32). Furthermore, Norwegian respondents selected viruses less often as likely agents, χ2(3)=9.60, p=0.022, whereas Danish
respondents more often opted for environmental chemicals as likely agents, χ2(3)=9.61, p=0.022 (Table 33). A background in epidemiology increased the frequency of likely responses to parasites, χ2(1)=5.24, p=0.022 (Table 34).
Table 31. Response frequencies for waterborne agents
Agent Likely Possible Unlikely Sum
Viruses 71 30 9 110 Bacteria 61 45 4 110 Parasites 57 40 13 110 Environmental chemicals 21 52 36 109 Marine toxins 13 33 62 108 Microbial toxins 9 47 51 107 Plant toxins 3 29 76 108 Mycotoxins 2 23 84 109 Processing chemicals 2 40 67 109 Allergens 1 25 81 107
Infectious proteins (prions) 0 12 96 108 Other foodborne agents 2 49 32 83 Table 32. Opinions on parasites as likely waterborne agents by country
Country Not likely Likely Sum
Denmark 17 4 21
Finland 15 6 21
Norway 12 22 34
Sweden 9 25 34
Table 33. Opinions on viruses and environmental chemicals as likely waterborne agents by country
Country Viruses Environmental chemicals Not likely Likely Not likely Likely
Denmark 7 14 12 9 Finland 5 16 19 2 Norway 19 15 28 5 Sweden 8 26 29 5 Table 34. Opinions on parasites as likely waterborne agents by education in epidemiology
Education in epidemiology
Parasites as likely agents
Not likely Likely Sum
No 40 30 70 Yes 13 27 40 Sum 53 57 110
Drivers of change in outbreak numbers
Question 13. Which environmental, social or economic changes are likely or unlikely drivers of an increasing spread of foodborne or waterborne diseases in your country during 2011-2020 compared with 2001-2010?
Global trade, human travel and new patterns of food consumption were most frequently selected as likely global drivers of change (Table 35). Danish
respondents also considered weather-climate change as a likely driver, χ2(3)=8.23, p<0.042, whereas Finnish respondents more often selected types of food
production as a likely driver, χ2(3)=22.26, p<0.001 (Table 36). An educational background in water technology favoured more ‘Likely’ responses to water consumption as driver, χ2(1)=7.48, p<0.006 (Table 37). However, the last result should not be overstated considering the limited number of respondents with the background in question (n=8).
Table 35. Response frequencies for global drivers of change in foodborne or waterborne diseases
Global drivers of change Likely Possible Unlikely Sum
Global trade/transportation 76 26 8 110 Human travel/migration 74 30 6 110 Weather or climate 65 32 13 110 New patterns of food consumption 62 36 12 110
New patterns of food production 39 47 23 109
Fraud and crime 16 55 39 110 New water consumption 14 40 56 110 New water production 8 50 51 109
Other changes 8 65 14 87
Table 36. Opinions on weather-climate and food production as drivers of change by country
Country Weather or climate Food production Not likely Likely Not likely Likely
Denmark 4 17 16 5
Finland 13 8 7 14
Norway 13 21 23 10
Table 37. Opinions on water consumption as a driver of change by background
Education in water technology
Water consumption as driver
Not likely Likely Sum
No 92 10 102
Yes 4 4 8
Sum 96 14 110
Population change
Question 14. Which changes in the consumer population are likely or unlikely explanations for an increasing human susceptibility to foodborne and waterborne diseases?
The majority of the respondents considered food consumer behaviour and an ageing population likely factors in changing human susceptibility to foodborne and waterborne diseases (Table 38). Education in public health was associated with a tendency to select environmental stress as a likely driver of increasing susceptibility, χ2(1)=7.48, p<0.006 (Table 39).
Table 38. Response frequencies for changes in consumer populations as drivers of susceptibility
Changes in consumer
populations Likely Possible Unlikely Sum
An ageing consumer population 62 36 12 110 Changes in food consumer
behaviour 61 38 11 110
Health issues in specific
consumer groups 40 57 13 110 Increasing environmental stress
on public health 28 52 30 110 Population growth 16 40 54 110
Other changes 3 66 9 78
Table 39. Opinions on environmental stress as a driver of change by background
Education in public health
Environmental stress as driver
Not likely Likely Sum
No 57 11 68
Yes 25 17 42
Consumer behaviour
Question 15. Which changes in food consumer behaviour are likely or unlikely to contribute to an increase in the number of foodborne and waterborne outbreaks in your country during 2011-2020 compared with 2001-2010?
A clear majority of the respondents considered increased consumption of imported and raw food to be a likely source of an increasing number of outbreaks in the future (Table 40).
Table 40. Response frequencies for changes in consumer behaviour as drivers of outbreak numbers
Changes in consumer behaviour Likely Possible Unlikely Sum
Increased import of foreign food 85 23 2 110 Increased consumption of raw food 70 33 7 110
Deteriorating food hygiene 34 55 21 110 Increased consumption of ready meals 32 53 25 110
Increased consumption of mixed foods 29 62 18 109
Other changes 2 64 0 66
Respondents with a background in microbiology were more prone to consider imported goods as a likely contributor to the change, χ2(1)=5.87, p=0.015.
Respondents with a background in public health more often selected mixed foods as a source of the change, χ2(1)=5.63, p=0.018 (Table 41).
Table 41. Opinions on imports and mixed foods as sources of increasing outbreak numbers by background Education in Microbiology Imported food consumption Education in Public Health Mixed food consumption Not likely Likely Not likely Likely
No 19 39 No 55 12
Yes 6 46 Yes 25 17
Drivers of change in consumption
Question 16. Which are the more likely or unlikely explanations for changes in food consumer behaviours that may contribute to an increasing number of foodborne and waterborne outbreaks?
There was high uncertainty regarding likely contributors to changes in food consumer behaviours. No explanation was considered likely by a majority of the respondents. Consumer preferences and an ageing population were more often considered likely than other explanations (Table 42). An ageing population was
more frequently selected by Finnish respondents, χ2(1)=14.42, p=0.002 (Table 43).
Table 42. Response frequencies for drivers of change in consumer behaviour as drivers of outbreak numbers
Drivers of change in
consumer behaviour Likely Possible Unlikely Sum
Food consumer preferences 48 52 9 109 An ageing consumer
population 41 45 24 110
Economic conditions of
food production 35 59 16 110 Population change due to
migration 31 61 18 110
Other changes 3 68 10 81 Table 43. Opinions on an ageing population as a driver of change by country
Country Not likely Likely Sum
Denmark 17 4 21
Finland 6 15 21
Norway 24 10 34
Discussion
The survey respondents considered an increasing number of foodborne and waterborne disease outbreaks to be a more likely scenario than not. However, the respondents used multiple formats when estimating the relative increase in 2011-2020 compared with 2001-2010 and the estimates they gave did not always agree with the qualitative judgments of change (Question 1). The belief score J provided support for evaluating the expert estimates. It can be considered a ranking of expert beliefs in change. The initial multiple qualitative judgments of change were transformed into a single measure of change, allowing for validation and
adjustment of the expert estimates. Thus, the belief score bridged two types of expert judgments of change, qualitative and quantitative. More research is needed to explore its potential as a qualitative control in expert judgments of probability. One line of inquiry is to use it in studies of biases in estimates of probability (13).
After adjustment, the expert estimates indicated a 10%-20% increase in foodborne and waterborne outbreaks of disease. The remaining questions, with the exception of demographics, concerned likely causes, drivers and explanations of change. Taken together, the answers to these questions can be re-phrased as a scenario of likely factors and forces that will lead to a future increase in the number of outbreaks.
Imported food, particularly raw vegetables, contaminated with unregulated agents, viruses or bacteria, prepared in public food service facilities with deficient food safety knowledge, served to a population with an increasing share of elderly people.
This set of factors could provide us with a scenario template in future research on crisis planning. By collecting data of relevance for the template, we can elaborate it into multiple crisis scenarios that examine e.g. which countries of origin are of concern, which viruses and bacteria and which types of food service facilities. These questions need to be addressed to transform the scenario template into an operational scenario for analysis and planning that can serve in crisis preparedness and management.
Besides these general patterns of expert opinion and perception, the survey also revealed variations depending on demographics. Nationality influenced appraisals of outbreak agents and vehicles. For example, parasites and herbs were more frequently selected as likely options among Swedish respondents. The causes of prospective outbreaks selected by Norwegian respondents were less in tune with mainstream answers. The Norwegian respondents also gave
significantly higher estimates of the relative increase in outbreak numbers. The reason for the variations observed is unclear. One hypothesis is that
background influenced the answers, rather than nationality. The Norwegian respondents had longer experience of risk assessment and represented a broader area of expertise. This non-homogeneous mixing of nationality, analytical experience and education makes it difficult to disentangle the factors and this must be left to future research.
In particular, it is important to determine whether the observed differences between countries in organisational structures of food safety experts also
represent cultures and risk perceptions, or whether the national differences in risk perceptions in the current survey can be reduced to professional and/or
educational differences, e.g. microbiologists stressing changes in agent exposures and public health professionals stressing changes in lifestyle factors.
Acknowledgements
This study is part of a research and development project funded by the Swedish Civil Contingencies Agency entitled “Cross-sector Risk and Vulnerability Analysis of the Food Chain” (sRSA). The aim of the project is to develop and apply methods of risk analysis and crisis planning, including methods for efficient information exchange between state agencies.
Bibliography
1. EFSA. Annual report on the Emerging Risks Exchange Network 2011 Technical report. Parma, Italy: EFSA EMRISK 2012.
2. EFSA. Piloting a process for Emerging Risks Identification: Lessons learnt and next steps Technical report. Parma, Italy: EFSA EMRISK 2012.
3. Hofer E. (1986). On surveys of expert opinion. Nuclear Engineering and Design, 93(2-3), 153-160.
4. Davidson V J, Ravel A, Nguyen T N, Fazil A, & Ruzante J M. Food-Specific Attribution of Selected Gastrointestinal Illnesses: Estimates from a Canadian Expert Elicitation Survey. Foodborne Pathogens and Disease 2011;8(9), 983-995. 5. Gale P, Brouwer A, Ramnial V, Kelly L, Kosmider R, Fooks A R & Snary E L. Assessing the impact of climate change on vector-borne viruses in the EU through the elicitation of expert opinion. Epidemiol Infect 2010; 138(2), 214-225.
6. Hameri A P & Hintsa J. Assessing the drivers of change for cross-border supply chains. International Journal of Physical Distribution & Logistics Management 2009;39(9-10), 741-761.
7. Havelaar A H, Galindo A V, Kurowicka D, & Cooke R M. Attribution of Foodborne Pathogens Using Structured Expert Elicitation. Foodborne Pathogens and Disease 2008;5(5), 649-659.
8. Hoffmann S, Fischbeck P, Krupnick A & McWilliams M. Using expert elicitation to link foodborne illnesses in the United States to foods. Journal of Food Protection 2007;70(5), 1220-1229.
9. Mangen M J J, Batz M B, Kasbohrer A, Hald T, Morris J G, Taylor M, & Havelaar A H. Integrated Approaches for the Public Health Prioritization of Foodborne and Zoonotic Pathogens. Risk Analysis 2010;30(5), 782-797.
10. Pires S M, Evers E G, van Pelt W, Ayers T, Scallan E, Angulo F J, Havelaar A, Hald T. Attributing the Human Disease Burden of Foodborne Infections to Specific Sources. Foodborne Pathogens and Disease 2009;6(4), 417-424. 11. Ravel A, Davidson V J, Ruzante J M & Fazil A. Foodborne Proportion of Gastrointestinal Illness: Estimates from a Canadian Expert Elicitation Survey. Foodborne Pathogens and Disease 2010;7(12), 1463-1472.
12. Wentholt M T A, Fischer A R H, Rowe G, Marvin H J P & Frewer L J. Effective identification and management of emerging food risks: Results of an international Delphi survey. Food Control 2010;21(12), 1731-1738.
13. Kynn M. The 'heuristics and biases' bias in expert elicitation. Journal of the Royal Statistical Society Series a-Statistics in Society 2008;171, 239-264.
Appendix
BACKGROUND This is a survey of expert perceptions of future foodborne and waterborne outbreaks. It is addressed to a selected group of experts in Denmark, Finland, Iceland, Norway and Sweden. The survey is a joint venture by the Nordic food authorities. The purpose is to identify common and different concerns. The survey takes about 30 minutes to complete. It must be carried out during a single online session. Please share your beliefs. CONFIDENTIALITY We ask you to share your opinions and judgements for statistical purposes only. The survey is confidential. The statistical analysis will be carried out by Tom Andersson at the National Food Agency in Sweden. Only he and the head of the Division for Evaluation, Cecilia Svärd, will have access to digital response files. To receive a copy of the results, we kindly ask you to provide us with an email address at the end of the survey. After separating the email address from the response file, the original server file will be deleted to make it impossible to trace answers back to individuals. For further information or questions, please contact Tom Andersson: tom.andersson(at)slv.se.
1. Number of foodborne outbreaks
Will the number of foodborne outbreaks change in your country for the period 20112020 compared with the period 20012010?
A 'foodborne outbreak' is here defined as at least two cases of disease due to food contamination, excluding drinking water contamination.
Please specify your beliefs by marking one of the five choices 'most likely', 'likely', 'possible', 'unlikely' or 'most unlikely' for each outcome.
This question is mandatory to complete the survey. Most
likely Likely Possible Unlikely Most unlikely Yes, the number of outbreaks will decrease by at least 10%. n m l k j mlkjn kjlmn nmlkj nmlkj Yes, the number of outbreaks will increase by at least 10%. n m l k j mlkjn kjlmn nmlkj nmlkj No, the number of outbreaks will change by no more than 10%. n m l k j mlkjn kjlmn nmlkj nmlkj
2. Your estimate
Please give your estimate of the change in the number of foodborne outbreaks in your country.
Please specify a number representing the proportion (ratio) of number of
outbreaks for 20112020 compared with 20012010. Use decimal points for decimal numbers.
For example, '2' represents twice the number of outbreaks. '0.5' represents half the number. '1' represents no change.
3. Cause of change
Irrespective of previous questions and answers, let us assume that the number of foodborne outbreaks will increase by at least 10% during 20112020 compared with 20012010.
Which causes are likely or unlikely to lead to an increase in the number of foodborne outbreaks in your country? Please specify your beliefs by marking one of the five choices 'most likely', 'likely', 'possible', 'unlikely' or 'most unlikely' for each outcome.
This question is mandatory to complete the survey. Most
likely Likely Possible Unlikely Most unlikely Increasing exposure to known foodborne disease agents. n m l k j mlkjn kjlmn nmlkj nmlkj The emergence of new foodborne disease agents, or new variants of known agents. n m l k j mlkjn kjlmn nmlkj nmlkj Increasing susceptibility to known foodborne disease agents. n m l k j mlkjn kjlmn nmlkj nmlkj
4. Exposure to known disease agents
Let us assume that your country is facing a significant increase in the number of foodborne outbreaks due to increasing exposure to known disease agents.
Which exposures are likely or not to contribute to an
increasing number of foodborne outbreaks in your country during 20112020 compared with 20012010?
Please specify your beliefs regarding the likelihood of the four types pf exposure by marking them as 'likely', 'possible' or 'unlikely'.
Likely Possible Unlikely Increased exposure through known food vehicles to agents subject to food safety regulations. n m l k j nmlkj nmlkj Increased exposure through new food vehicles to agents subject to food safety regulations. n m l k j nmlkj nmlkj Increased exposure through known food vehicles to agents not subject to food safety regulations. n m l k j nmlkj nmlkj Increased exposure through new food vehicles to agents not subject to food safety regulations. n m l k j nmlkj nmlkj
5. Foodborne disease agents
Which agents of foodborne diseases are likely to contribute to a significant increase in the number of outbreaks in your country during 20112020 compared with 20012010? Please specify your beliefs regarding the likelihood of the disease agents by marking them as 'likely', 'possible' or 'unlikely'.
For clarification, the term 'microbial toxins in food' refers here to toxins generated before consumption.
Likely Possible Unlikely
Allergens nmlkj nmlkj nmlkj Microbial toxins in food nmlkj nmlkj nmlkj Marine toxins nmlkj nmlkj nmlkj Mycotoxins nmlkj nmlkj nmlkj Plant toxins nmlkj nmlkj nmlkj Bacteria nmlkj nmlkj nmlkj Viruses nmlkj nmlkj nmlkj Infectious proteins (prions) nmlkj nmlkj nmlkj Environmental chemicals (pesticides, residues and metals) n m l k j nmlkj nmlkj Parasites nmlkj nmlkj nmlkj Processing chemicals (additives and packaging materials) n m l k j nmlkj nmlkj Other foodborne agents nmlkj nmlkj nmlkj If you have other or specific agents in mind, please specify. 5 5 6 6
6. Food commodities
Which food commodities are likely disease agent vehicles for an increasing number of foodborne outbreaks in your
country during 20112020 compared with 20012010? Please specify your beliefs regarding the likelihood of the following commodities by marking them as 'likely', 'possible' or 'unlikely'.
Likely Possible Unlikely Meat and meat products (including edible offal) nmlkj nmlkj nmlkj Herbs, spices and condiments nmlkj nmlkj nmlkj Alcoholic beverages nmlkj nmlkj nmlkj Fruit and vegetable juices nmlkj nmlkj nmlkj Nonalcoholic beverages (excepting milk based beverages) n m l k j nmlkj nmlkj Composite foods (including frozen products) nmlkj nmlkj nmlkj Products for special nutritional use nmlkj nmlkj nmlkj Snacks, desserts, and other foods nmlkj nmlkj nmlkj Grains and grainbased products nmlkj nmlkj nmlkj Food for infants and small children nmlkj nmlkj nmlkj Fish and other seafood (including amphibians, reptiles, snails and insects) n m l k j nmlkj nmlkj Vegetables and vegetable products (including fungi) n m l k j nmlkj nmlkj Starchy roots and tubers nmlkj nmlkj nmlkj Legumes, nuts and oilseeds nmlkj nmlkj nmlkj Eggs and egg products nmlkj nmlkj nmlkj Milk and dairy products nmlkj nmlkj nmlkj Sugar and confectionary nmlkj nmlkj nmlkj Animal and vegetable fats and oils nmlkj nmlkj nmlkj Fruit and fruit products nmlkj nmlkj nmlkj Other food commodities nmlkj nmlkj nmlkj If you have other or specific commodities in mind, please specify. 5 5 6 6