Discussing the role of Interaction
design within design for
Sustainability
Stephanie Neumann
Interaktionsdesign Bachelor 22.5HP VT 2020Abstract
This paper describes a research through design project for reducing student’s food waste in a Swedish high school canteen. It was found that the design outcome is influenced by how a designer approaches the chosen problem space of sustainability. Building only on the existing perspectives of eco-feedback technologies and persuasive frameworks within interaction design, immensely constrains the role interaction design could take in working with sustainability issues. The complexities of sustainability related problems should be seen as a rich opportunity space to approach by design. Ethnographic research methods should be used when designing for sustainability. Found strengths of interaction design within design for sustainability were the data measurement of consumption and change. Together with the communication possibilities of digital and connected devices. The design outcome became a digital tool for kitchen staff to use when evaluating the lunch menu. The research also led to four suggestions for future design projects.
Key Words: interaction design, design for sustainability, food waste, plate waste, intervention design, behaviour intervention, eco-feedback technologies, service design
Acknowledgements
Thanks to my Supervisor Lizette Reitsma for giving me good advice and encouragements when needed. A huge thank you to Samuel Lindgren at Matomatic, who has donated much of his time for discussing the plate waste topic with me and for evaluations during my design process. Thanks to Jesper Björkman at Matomatic. Thanks to Christopher Malefors researcher at SLU for good discussions on the food waste topic and for giving feedback on my final design solution. Thanks to the school personnel who enabled my field research and the kitchen staff and students participating in it. Thanks to Karin Fritz at Livsmedelsverket who gave me advice on the direction of my research project. Thanks to Josefine Hansson for sending me the news links and providing moral support and good company. Thank you, mum, for all the discussions about sustainability and the excellent home office.
Table of contents
ABSTRACT 2
ACKNOWLEDGEMENTS 3
1 INTRODUCTION 6
1.1 FOOD WASTE 6
1.2 FOOD WASTE IN SWEDISH PUBLIC SECTOR 7
1.3 RESEARCH GAP AND APPROACH 8
1.4 RESEARCH QUESTIONS 8
1.5 PROJECT PARTNER 8
2 BACKGROUND 9
2.1 SUSTAINABILITY AND DESIGN 9
2.1.1 SUSTAINABLE DEVELOPMENT 9
2.1.2 ECO-FEEDBACK TECHNOLOGIES AND PERSUASIVE TECHNOLOGIES 10
2.2 PLATE WASTE 10
2.2.1 WHAT BEHAVIOURS ARE CAUSING PLATE WASTE? 10
2.2.2 FACTORS INFLUENCING WASTE BEHAVIOUR 11
2.3 OVERSERVING INTERVENTIONS 11
2.3.1 PLATE SIZE INTERVENTION 11
2.3.2 PROMPTS 11
2.4 ADVICE FROM LIVSMEDELSVERKET 12
2.5 ADVICE FROM SCHOOL KITCHENS 13
2.6 RELATED WORK 14
2.6.1 SCALES WITH WASTE DATA AND FEEDBACK 14
2.6.2 SVINNKOLLEN – CONSUPEDIA APP 15
2.6.3 MITTKÄK 16
2.6.4 KLIMATRÄTT 16
2.6.5 REDUCING HOUSEHOLD WASTE 17
2.7 ANALYSIS OF RELATED WORKS 18
3 METHODS 20
3.1 THE DOUBLE DIAMOND MODEL 20
3.2 FIELD WORK 20
3.3 ETHICS 21
4 FIELD WORK 22
4.1 VISIT AT A SWEDISH HIGH SCHOOL 22
4.2 INTERVIEW WITH KITCHEN PERSONNEL 22
4.3 INTERVIEW WITH STUDENT 23
4.4 E-MAIL CONVERSATION WITH STUDENT 24
4.5 RESULTS OF FIELD WORK 24
4.5.1 MISMATCH IN FOOD PREFERENCES 24
4.5.2 SERVING BEHAVIOUR 25
4.5.3 REFRAMING THE PROBLEM 26
5 DESIGN PHASE 26
5.1 IDENTIFIED DESIGN OPPORTUNITIES 26
5.1.1 CHANGE THE SOCIAL PRACTICE OF EATING AT SCHOOL 26
5.1.2 TASTE FIRST INTERVENTION 27
5.1.3 OVERSERVING INTERVENTION 27
5.1.4 MATCH FOOD PREFERENCES 28
5.1.5 CREATE MORE DIALOG 28
5.1.6 MEASURING THE EATEN FOOD AND PLATE WASTE 28
5.2 IDEATION AND CONCEPT DEVELOPMENT 29
5.2.1 FIRST IDEATION SESSION 29
30
5.2.2 HOW MUCH FOOD WASTE IS OK PER PERSON? 31
5.2.3 IOT DATA TRACKING AND SERVICE DESIGN SOLUTION 32 5.2.4 IDEATION: PRESENTING DATA TO THE KITCHEN STAFF 35
5.2.5 FINAL DESIGN OF THE CANTEEN APPLICATION 37
6 DISCUSSION 40
7 CONCLUSIONS 43
7.1 WHY CHILDREN ARE THROWING AWAY FOOD 43
7.2 WHAT COULD BE DONE TO REDUCE PLATE WASTE 44
7.3 LEARNINGS FOR INTERACTION DESIGN PRACTICE 44
8 FUTURE WORK 44
9 REFERENCES 45
1 Introduction
This paper discusses working with behavioural change within design for sustainable behaviours in interaction design practise. The chosen sustainability problem to work with is food waste and the field of research is the school canteen. Partner for this project is a company specialised in digital tools for the measurement of food waste in Swedish public sector kitchens, primarily schools.
1.1 Food waste
Approximately 30% of the total emissions of greenhouse gases in Europe are due to food consumption (Röös, 2013). During the different stages of food production resources such as land, water and energy are used (Malefors, Callewaert, Hansson, Hartikainen, Pietiläinen, & Eriksson, 2019). The wasting of food means these resources have been used in vain. Out of all food produced for human consumption, it is estimated that approximately one-third is lost or wasted (Röös, 2013). The Food and Agriculture Organization (FAO) estimated in 2011 that about 1.3 billion tons of food are wasted every year, seen globally (Eriksson, Persson, Malefors, Björkman, & Eriksson, 2017). FAO also suggest that it will be necessary with a 70% increase in food production due to growing income levels and an estimated growth of the population globally to 9 billion in 2050 (Röös, 2013). Hence it is important to better manage food as a valuable resource and here is also an opportunity to reduce unnecessary CO2 emissions and negative impact on the environment.
There is a distinction between food waste and food loss. Food losses occur from production up to the retail level, and it’s called food waste during the retail and consumption levels (Food and agricultural organization of the united nations, 2020). In developing countries food loss is more common due to inefficiencies during production, storage and transportation, compared to the developed world, where food is mainly wasted in the consumption phase (Röös, 2013). In this paper,” food waste” is referred to as avoidable food waste, meaning food which could have been eaten by humans. In comparison to potato peels and chicken bones, which also could be called food waste. In Swedish the terms matsvinn and matavfall are commonly used to distinguish between avoidable and unavoidable food waste.
There is currently a political interest on an international, European and Swedish level, in reducing avoidable food waste. The United Nations have emphasized in their sustainable development goals, the Agenda 2030, target 12.3:” By 2030, halve per capita global food waste at the retail and consumer levels and reduce food losses along production and supply chains, including post-harvest losses.” (Food and agricultural organization of the united nations, 2020). The European Commission supports the achievement
of the Agenda 2030 targets for food waste reduction in the EU by an action plan and food waste legislation (European Commission). Accordingly, the Swedish government has given the mission of reducing food waste to the Swedish authorities The Swedish food agency (Livsmedelsverket), The Swedish environmental protection agency (Naturvårdsverket) and The Swedish board of agriculture (Jordbruksverket) (Livsmedelesverket 2020).
1.2 Food waste in Swedish public sector
In Sweden the schools, pre- schools, elderly care homes, hospitals etc., are producing approximately 70,000 tons of food waste each year (Steen, Malefors, Röös & Eriksson, 2018). For measuring purposes, the food waste in public kitchens is divided in several categories (Fig.1). Commonly included categories are preparation waste, serving waste and plate waste (Malefors et al., 2019). Preparation waste is waste from the preparation and/or trimming of food, such as peel, bones, and fat. Serving waste regards the food served that did not reach the plates of guests. Plate waste is all waste from the plates of guests, this waste might also contain unavoidable food waste such as napkins and/or bones.
In Swedish schools and pre-schools, the serving waste and plate waste contribute to most of the wasted food (Malefors et al., 2019). In Swedish High Schools the plate waste is on average higher than the serving waste and in elementary school the plate waste has a little lower ratio to serving waste (Malefors et al., 2019). In pre-schools the plate waste is a lot lower in relation to the serving waste and they have less plate waste per person compared to the other types of schools (Malefors et al., 2019). Findings suggest plate waste in schools and pre-schools increases with children’s age (Steen et al., 2018). Less plate waste in pre-school is ascribed to children eating together with the carers who can monitor and encourage them to minimize food waste (Malefors et al., 2019). More factors influencing plate waste will be described later.
1.3 Research gap and approach
In theliterature review of influencing factors and successful interventions for reducing plate waste, the studies were mainly focused on measuring the effects of interventions or looking at the causalities related to increased or decreased waste. These studies offered an “outside perspective” on a structural and systemic level but were not describing the situation from the user’s point of view and experiences. Therefore, they were not offering a qualitative understanding of what behaviours, goals and needs are leading to plate waste. In addition, there were no explanation and investigation to why some of the interventions had effects and how they influenced underlying behaviours at hand. Therefor it was estimated that the qualitative and ethnographic methods of design research, would add new perspectives for understanding food waste. Reducing plate waste was chosen as the main focus of the project, assuming this type of waste was mainly caused by behaviours (in contrast to organizational aspects). Hence the research and design presented here, also shares a perspective of how to work with behaviour interventions, in designing for sustainability.
The literature review describes the eco-feedback technologies and persuasive designs commonly used in interaction design within design for sustainability. This design project has purposely not been building on these existing practises and frameworks since the paper is critiquing them. It was then proven that the chosen approach when designing for sustainability is influencing the design outcome, which made this decision most relevant. The literature review and desk research instead focused on what is known about plate waste behaviour and what has already been done to reduce plate waste. Thereby contributing in answering the research questions here below.
1.4 Research questions
Why are children throwing away food?
What design solutions could be used to reduce plate waste in a school canteen?
1.5 Project partner
The project partner for this project is the company Matomatic, which is specialized in offering digital waste measurement tools (hardware and software) to the public sector in Sweden, mainly school canteens. The company and their products sprung from research projects on measuring food waste in public kitchens, conducted by a team of researchers at SLU in Uppsala. Whose work has been cited here in the introduction. The outcomes of the research and design process presented here, will possibly be used for making improvements to Matomatics product for measuring plate waste (which will be described further in the related work section).
2 Background
2.1 Sustainability and design
2.1.1 Sustainable development
The term Sustainable development was coined in 1987 in a report from the World Commission on Environment and Development, called Our common future (UN sustainable development goals knowledge platform, 2020). There Sustainable development was defined as broadly as a development which satisfies the contemporary needs without endangering future generations possibilities to meet their needs (Lunds Universitets Hållbarhetsforum, 2020). Sustainable development is here defined as more than a concern for the environment since it encompasses ecological, social and economic sustainability (ibid.). These three aspects are believed to interplay and support each other in creating Sustainable development. In the Swedish governments strategy these aspects are divided into the areas called health, sustainable consumption and production, economic development, social
unity, global development, environment and climate (ibid.).
Another view on sustainability is that it concerns a responsible management of our planet’s resources. This is referred to as humans Ecological Footprint by The Global Footprint Network, a non-profit organization of researchers, which are calculating the Earth overshoot day of each year. The day marks when we have used more of nature’s resources than our planet can renew in one year (measured in 1.63 gha per capita). In 2019 the global overshoot day was on July 29. In 2019 Sweden we exceeded our individual “budget” of using the planets nature resources on the 2 of April. The resources of concern are the productive land and sea area required to produce all we consume, and the area needed to absorb our waste. Carbon emissions have gained much attention since it is the fastest-growing part of the human Ecological Footprint and today stands for 60% of humanity’s total Ecological Footprint. An effect of the ecological overspending is also that it is destroying and diminishing the existing resources by, desertification, reduced cropland productivity, deforestation, overfishing, global warming and pollution. The overshoot is influenced by how much nature’s ecosystems are able to produce, the efficiency in producing products, consumption and how many we are on the planet consuming. Since the seventies (when we started to overconsume the earth’s resources) there has been a 104% growth of the world population and on average the overshoot day has arrived 3 days earlier each year. The last three years the increased use of nature resources has slowed down and the overshoot day is reached 1 day earlier on average. To solve the overshoot problem The Global Footprint Network suggests the key areas to focus on are energy use and its effect on carbon emissions, food, decrease the earth’s population growth by improving gender equality, transportation and city planning.
2.1.2 Eco-feedback technologies and persuasive technologies
Eco-feedback technology aims at changing or reducing consumption behaviour which has impact on the environment (Froehlich, Findlater & Landay, 2010). Consumption is measured and visualized to provide feedback on individual or group behaviours (ibid.). There is an implied assumption that people do not have an awareness about the consequences their behaviour has on the environment and that the presentation of information is enough to promote environmentally responsible behaviours (ibid.). It is not defined what behaviours the designs aim to change but it is hoped a raised awareness, will lead to an altered behaviour. (Brynjarsdottir, Håkansson, Pierce, Baumer, DiSalvo, & Sengers, 2012). Persuasive technologies more directly aim at shaping behaviour and attitudes (Brynjarsdottir et al. (2012). They originate
from Fogg’s framework “computers as persuasive technologies” which is built on psychology theory of persuasion (ibid.). In these products the designers are defining what behaviours are desired and not.
2.2 Plate waste
2.2.1 What behaviours are causing plate waste?
What are the behaviours which need to be changed to prevent food getting wasted at the waste bin? Karin Fritz is working as project manager regarding reducing food waste at the Swedish food agency called Livsmedelsverket and explained during an interview that the problem with plate waste could be looked at from two directions. One side of the problem is the wasting of food, the other is that the food was supposed to have ended up in the schoolchildren’s stomach and not in the bin. The wasting of food also entails a concern that children do not eat enough. It is often assumed that food is thrown away because it does not taste good. A school in Helsingborg measured their plate waste and it was found that more waste was produced during the days when the children’s favourite food was served (SVT 2020: Högastensskolan i Helsingborg – det goda exemplet för minskat matsvinn). Samuel Lindgren at Matomatic also confirms that this is a common experience and view on food waste in Swedish school kitchens. It seems there is also a problem in that the children take more food than they can eat. Why do the children take more food than they will eat and why are they not eating
enough (fig. 2)? In the sections below I have tried to answer these questions through a literature review on plate waste and serving behaviour.
2.2.2 Factors influencing waste behaviour
Martins et. al. (2016) suggest that children’s eating behaviour at school lunch is extremely complex and that there are many factors that can influence food rejection: 1. Personal anxiety about eating and a lack of appetite 2. Peer pressure and attention on free time to socialize during the lunchbreak 3. The relationship too food and familiarity with foods. 4. The appearance and taste of food. 5. Unsuitability too food preferences. 6. Portions’ inadequacy to children’s nutritional needs. 7. Insufficient time to eat. The factors described here in this section seem to mainly address the second problem mentioned in the user journey (fig. 2) that children eat too little at school. The leisure aspect of the lunch break competes with the aspect of eating and too short lunch breaks and the attention to socializing, could possibly also be linked to the other problem mentioned that children take too much food since they are not prioritizing time for taking first and second servings. The research of Martins, et. al. (2016) show direct connection of how longer lunch breaks or scheduling leisure time before eating were linked to reduced food waste. Plate waste is also found to increase in relation to the dining hall capacity and it’s suggested it is influenced by more stress and noise in the surrounding environment (Steen, et al., 2018). As discussed in the introduction, plate waste is also increasing in relation to the ageing of schoolchildren (ibid.).
2.3 Overserving interventions
In the previous section, it is suggested that behaviours which lead to plate waste are: 1. taking too much food and 2. eating too little food. It is also suggested that children tend to overserve their favourite food, but it is not concluded why they do this. In this section we will take a look at interventions which have already been tested for reducing plate waste due to overserving. Although, these interventions were not situated in a school environment.
2.3.1 Plate size intervention
In the previous chapter it was stated plate size influences our estimation of portion size. Kallbekken & Sælen (2013) performed an experiment to reduce plate waste from a hotel buffet. They reduced the sizes of plates from 24 to 21 cm, which lead to reducing food waste by 19.5%.
2.3.2 Prompts
Prompts are messages, either visual or auditory, which remind people to perform a behaviour. They are most effective when they address a clearly defined behaviour which is easy to perform, and which occurs repeatedly (Stöckli et. al., 2018). The prompts should be placed at the location where the target behaviour occurs and are more efficient if they are expressed politely than demanding (ibid.).
In Kallbekken & Sælen’s (2013) experiment at hotel breakfast buffet they wanted to reduce food waste by encouraging re-serving behaviour. They put up a sign at the buffet table with the text:‘‘Welcome back! Again! And again! Visit our buffet many times. That’s better than taking a lot once’’ (p. 326), and it resulted in reducing food waste by 20.5%. Whitehair, Shanklin & Brannon (2013) conducted an experiment in a university dining facility,
where they placed posters at several locations both at serving lines and by dish return carousel. The message was short so the students could quickly read it: “Eat what you take don’t waste food” (Whitehair et al., 2013 p. 65), and a 15% reduction in food waste was observed.
As by these examples there is evidence for the short-term effects of prompts on behaviour in public places, but there are no insights to what the underlying psychological mechanisms and motivations are that make these prompts efficient (Stöckli et. al., 2018). Kallbekken & Sælen, (2013) suggest their sign at the hotel buffet contributed to make it socially acceptable to help yourself more than once from the buffet. Whitehair et al. (2013)ascribe the decrease in waste behaviours triggered by an awareness of the food waste topic.The prompts mentioned here tell people what behaviour is undesirable before they serve themselves: “do not take a lot at once” and “don’t waste food” and instead suggest a replacement behaviour: “visit buffet many times” and “eat what you take” (which could be phrased “take what you will eat“). It seems theses prompts consist of procedural and normative information. The long-term effects of these prompts were not measured. So it cannot be concluded if the messages will fade into the background over time or if the desired behaviours become established routines.
2.4 Advice from Livsmedelsverket
The Swedish food Agency, Livsmedelsverket, was given the task by the Swedish government to reduce food waste within Swedish households and public kitchens. As part of this mission Livsmedelsverket published a manual for reducing food waste in public kitchens (Livsmedelsverket, 2020: Handbok för minskat matsvinn). Livsmedelsverket emphasizes the importance of a calmer, more orderly and pleasant eating environment with enough time to eat, for the reduction of plate waste. Collaborate with the personnel responsible for the scheduling of lunches to create a successful lunch schedule. By a good eating environment and palatable meals there are better conditions for the food to be eaten then for them to end up in the waste bin. It is suggested to calculate how much the students are eating on average, by measuring the served food and subtracting it by the amount of wasted food. The students should be encouraged in taking second helpings and the school staff should eat at the canteen for a positive influence on students’ behaviour. The work for reducing food waste should not create a fear of trying new dishes or in influencing students in taking too little food, to ensure they
will not waste food. (Livsmedelsverket, 2020 Handbok för minskat matsvinn).
Livsmedelsverket also gives advice for reducing the serving waste and improved menu planning. Good routines for serving and refilling the buffet is encouraged (Livsmedelsverket, 2019) and serving one food tray at the time. By counting the plates at the serving station, it is possible to estimate how many students will still be arriving and only serve the food predicted to be consumed. It is suggested to label the dishes with names which clearly describe what they contain (so the right expectations are set). Get to know the guests for estimation of portion sizes and adapt cooking to how much they usually consume. Adapt meals to the guests needs and give feedback to the personnel in charge of recipes. (Livsmedelsverket, 2020 Handbok för minskat matsvinn).
2.5 Advice from school kitchens
A kitchen chef states in a Swedish newscast that reducing plate waste is about getting to know the students and what ingredients and recipes they like and do not like (Korsgren, M 2020). This could be done by reviewing on what days most food is wasted. She says she wants to reduce plate waste by improving their meal planning.
Reporting from another Swedish school which has started a food council consisting of four students in year eight (Korsgren, M 2020). The students have gained knowledge about plate waste from the kitchen staff and have engaged other students at the school which has significantly decreased the plate waste.
2.6 Related Work
2.6.1 Scales with waste data and feedback
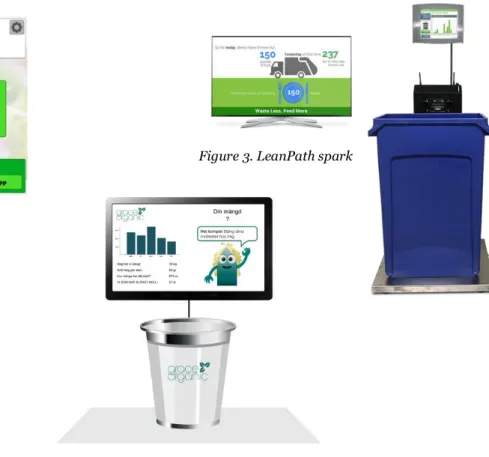
These products (fig. 3-5) consist of a scale underneath the waste bin, combined with a graphical interface on a tablet or touchscreen computer, which gives information about the discarded food. Displayed in slightly different ways are the collective results of measured food waste compared over time and two solutions show what the wasted food represents in other values. LeanPath’s (fig. 3) product shows how many portions of food, the weight of today’s food waste represents. Matomatic’s Plate waste scale (fig. 4) presents the average daily waste in values, such as the equivalent carbon emission in miles driven by car, cinnamon buns, etc. Two of the products give comments on the individual waste behaviour. On the display of Grace Organic’s Food waste tracker (fig. 5) an animated character gives comments when food is wasted. Your comment changes depending how much you throw in the bin, so it has increasing levels:” Now you did really well” or” Now I feel really bad in my tummy”. Matomatic’s graphical user interface (fig. 4)
comments on your waste in several levels with a written message in a coloured box. The colours are changing from green, to yellow, to red, depending on how much is wasted. Unique for Matomatic’s product is that users can compare the waste statistics to a predefined goal. There is also the
Figure 3. LeanPath spark
Figure 4. Matomatic Plate waste scale
opportunity for the student to give feedback on why food was wasted. The predefined answers revolve around three themes: “I did not like it/it was not my taste”, “I took too much food” and “I did not have time to finish my meal”. Grace Organic’s Food waste tracker is unique in that they state how many have finished eating today and how many did not waste anything at all. LeanPath’s product is meant to educate consumers about their environmental impact. The provided waste data is suggested to drive the behaviour change which reduces consumer food waste. The company Grace Organic states that restaurant guests get increased awareness of their waste behaviour and there is up to 40% in decrease of food waste measured in school restaurants.
2.6.2 Svinnkollen – Consupedia app
This is a research project waiting to happen, postponed until the autumn of 2020, due to the Convid-19 outbreak. During a week, school children will receive information about the climate effects of the daily school menu through an app made by Consupedia (fig. 6). They will be asked to take a photo of their plate before and after eating. AI technology within the app calculates the climate effect of wasted food. The school children’s individual waste data will only be shared for private monitoring, but the total waste of a school class can be followed and compared to other classes participating in the project.
2.6.3 MittKäk
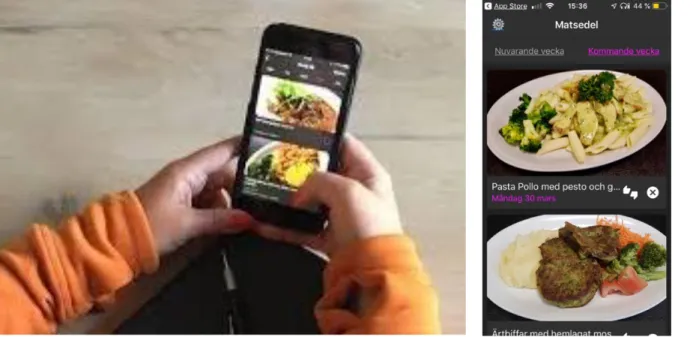
This is an app (fig. 7) where students can pre-order a customized menu for what they will be served at the school canteen next week (fig. 8). They can choose among several food options for every day and then rate and give feedback on the dishes (fig. 9). This makes students eat more food and waste has been reduced as a side-effect. The creator of the app has a background of working in Swedish school kitchens and the app was created in dialog with students on their needs and desires, during a 2-year period through workshops with student councils.
2.6.4 Klimaträtt
The app Klimaträtt (Kamb, Hedenus, & Larsson, 2015) measures the daily CO2 footprint due to private consumption choices in the categories living, food, transport, and other. By relating climate effects to individual consumption, the participants would get more aware about their consumption and lifestyle choices and the effects they have on CO2 emissions. The app also has an interface with a gamification feature where the size of an iceberg would mirror the status of the participants CO2 emissions. In interviews participants reported it influenced them to acquire a competitive spirit in competing with oneself and reaching goals. They described an emergence of a climate consciousness regarding every action, feeling bad or better, which created incentive and motivation to change their behaviour. Observing the effects of their choices and feeling personally responsible created motivation. It also made them gain self-knowledge, since the app allowed the participants evaluate and reflect upon their behaviours and choices. One of the participants contemplated if there is a sort of narcissism in being interested in oneself and one’s lifestyle.
2.6.5 Reducing household waste
In the project We’ve Bin Watching you (Thieme, Comber, Miebach, Weeden, Kraemer, Lawson, & Olivier, 2012) the householdwaste bin takes a photo twith a smartphone placed in the lid (fig 10). The photo is then automatically posted to an application on facebook (fig 11).
The project explores normative social influences to drive behaviour change through imposing a feeling of guilt in the user. User studies showed an increased awareness, reflection and motivation to improve waste management skills.
The Grumpy bin (Altarriba, Lanzani, Torralba & Funk, 2017) takes a photo every time food is wasted and sends it to all members of the house hold through an app notification.They will then through the app (fig. 12). answer if the wasted food is a problem, place blame and suggest a cause of why it happened. Based on the received answers Grumpy Bin decides who was responsible for the food waste and then posts a sarcastic message on his/her
Figure 10. Smartphone placed in the lid
Figure 11. Photo of waste posted on facebook
Instagram account. Learning about who wastes what in the family or household and why they do it.
The application EUPHORIA encourages social collaboration to reduce food waste (Yalvaç, Lim, Hu, Funk, & Rauterberg, 2014). The app registers the type of bought food, the consumption, waste and the reasons for food to be wasted. It recommends recipes for the left-over foods and food sharing can be initiated. The food sharing feature is hoped to encourage the logging of food and that foods are remembered to be taken care of before becoming bad. The Save the Kiwi application also targets the consumption of food before they expire (Aydin, Micallef, Lovelace, Cheung & Girouard, 2017).
This is done by information of food stocks during grocery shopping and suggesting recipes based on the left-over food. The users are alerted before food expires by a graphic figure personalizing the food product getting old. They also created an achievement system based on Fogg’s framework where the user profile could turn bad or good depending on how well food was managed. It was found that negative reinforcement and punishment were more effective for motivating behaviour change than positive reinforcement. Yet positive reinforcement seemed to motivate a maintenance of good behaviour.
2.7 Analysis of related works
Comparing these solutions, it can be seen how different the design outcome can be depending on how the experienced problem is approached. The issue of food waste in private households was addressed by the designers as either a waste issue or a food management issue. The EUPHORIA app suggested solutions in taking care of the food and included collaborative features which were suggested to motivate the food management. In contrary the design projects targeting the waste issue were focused on making the users reflect on why they were wasting and leaving it up to the users to solve the problem. Although it can be argued that these solutions in a way are recognizing that there might be complexity, diversity and individual reasons for people to waste food and therefore designers are leaving it to the users to be creative in solving their problem. The designs are there to assist them in reflection and by motivating them to change their behaviour. The motivations used here are the social aspects of creating shame around undesired behaviours and bringing an attention to waste behaviour. The Save the Kiwi was a hybrid between providing preventive measures but then used Fogg’s framework in their design for motivating these measures to be taken. This suggests the users are not motivated themselves in reducing their waste but need motivation to come from the design. What motivates users to change their behaviours is deriving from the designer’s own assumptions in all of these projects. There seems to be a varying scale between addressing behaviours preventive and supportive or by scolding. The designs also have different approaches to how social interactions should be used in the process.
The eco-feedback solutions for the public eating establishment or school presented here aim at increase awareness and attract attention to people’s waste behaviour. They display the negative effects of the wasted food by what it represents in carbon footprint or as wasted meals. It is shown how the individuals behaviour contributes to the collective result and the results can be compared over time. Two solutions evaluate if the amount of wasted food is ok or not and gives a personal feedback comment, depending on what weight has been programmed to pass as an acceptable amount of food waste. These attributes combined is expected to make people feel responsible for their behaviours and take action to change them. Grace organic also shows how many have not wasted, setting a god example to compare with. This solution is the only one measuring and recognizing the non-wasting behaviour, which is ultimately the goal of all the products. Matomatics product differentiates by setting a goal for motivation, this is also the only of the solutions which offers a possibility to communicate back and give an explanation to the waste behaviour. Two of the answers recognizes that food was wasted because of external factors influencing the children’s behaviour. One answer is placing responsibility of waste behaviour on the child, since it regards the overserving behaviour. The MittKäk app is quite different in design approach since it does not teach or comment on behaviour but offers a service. The reduced food waste was a side effect to solving the schoolchildren’s underlying need of meals better adapted to their food preferences. The app also allows the children to comment on the food options for further improvements. Accordingly, no one has producing food waste as their main goal of behaviour. Food waste behaviour is an effect caused by other behaviours. Many of the solutions presented here are aiming at creating behaviour change by targeting this consequence behaviour. This is suggested to be done by showing the negative effect of the food waste behaviour, place responsibility and invoke a wish to take action. The designs mirror certain behaviour as bad which makes the waste situation revolve around questions of moral. The same might be said for other areas within sustainable behaviour such as the Klimaträtt app which is designed for another use case and other environmental problems. The interviewed participants describe how an emergence of environmental consciousness motivated behaviour change, by feeling personally responsible for actions and monitoring the effects of choices. For the Klimaträtt project the participants were already motivated to change their behaviour before the project started which aligns with Stöckli et. al. (2018) statement that feedback strategies work best when people are already motivated to adapt a target behaviour. This contradicts the assumption within persuasive feed-back technologies that people need to be made motivated, by guilt or other negative reinforcement techniques. Combining feedback with other motivators, such as competition or goals is also deemed efficient (Stöckli et. al., 2018). The Consupedia app enables comparison and thereby competition with other school classes and Matomatic uses collective goals.
All of the designs, except MittKäk, somehow propose reflection and self-improvement for reducing waste behaviour. Some of them assume people are interested in self-improvement and some assume they will be made interested in self-improvement if they are told their behaviour is bad. There is a notable difference in how far the designs are supporting the users in their improvement process and in how far their approach is to impose blame and judgement.
3 Methods
3.1 The Double Diamond model
Field work and design process were planned according to The Double Diamond model (British design council, 2005) and a user-centered, generative design process (Sanders & Stappers 2012). In practice the design process was not very linear, and the first diamond of design research and the second diamond of design process were largely overlapping. The first design concepts and ideations became a tool for understanding what had been learned about the problem space during research and helped organizing thoughts by converging them into solutions. Which can be described as thinking and analysing by doing (Sanders & Stappers 2012). Afterward the problems and design opportunities were more clearly defined and developed upon in parallel. The concept developments during the design phase also deepened the understanding of the field, informing the design process and linking the design phase back to the research phase.
3.2 Field work
The purpose of conducting ethnographic field work was to further investigate the underlying reasons to why school children waste food. Also, to explore what possible constraints and factors might lie in the environment to explain why there might be an overserving behaviour. Therefore, a Swedish high school and their school canteen was visited during the research phase. Semi structured interviews (Kvale, 2007) were conducted with a student, who had recently made a school project on reducing plate waste at this school, and with a kitchen chef to learn from the kitchen staff’s experiences and observations regarding plate waste behaviours.
Originally a series of three workshop sessions with a group of high school students were planned and two cultural probes prepared. With the purpose to learn about the students eating experience at the school, and the role of school lunch during their day. Gaining knowledge from the students about plate waste and the serving situation in the canteen. One of the planned workshops aimed at exploring the serving situation through provoking the
necessity to reserve food by using really small plates. To see if there were any experienced obstacles in taking second servings and more generally exploring what constitutes the serving situation at the canteen. Due to the Covid-19 crisis, the High School was closed down and the student group was not interested in pursuing the workshops online. Instead the topic of plate waste was discussed per e-mail with one of the students.
3.3 Ethics
Conducting field research and qualitative research in a school environment could be of a sensitive nature. In Kristen Larson’s list of potential risks for a research participant (Muratovski, 2016, p. 41) are some situations that were considered during my thesis project. The sense of obligation to participate is suggested to be more common among children, students in classes and employees in their work setting. It was made clear to the interviewees in our communication that participation in the study is a non-compulsory choice and that they could decide to terminate their participation at any given time. Children are also a ”member of the vulnerable population” (Muratovski, 2016, p. 41) which further stressed the selection to work with an older age group thus collaborating with high school students.
3.4 Designprocess
The choice of design opportunity to pursue and direction of design process was influenced by the limited access to the research field, due to the Covid-19 outbreak.
Paper sketching was the main prototyping medium used during the ideation process, for idea generation, concept development and reflection while working towards a design solution. All concept sketches and ideas where evaluated in discussions with Samuel Lindgren at Matomatic. The evaluations informed the design process about the contextual constraints of implementing the concepts and deepened the understanding of the field. During one ideation session food was weighed which created a more tangible understanding of plate waste. This enabled reflections to go further than allowed by the abstract mathematical notion of food waste in gram and kilogrammes. For the final design solution an interactive prototype was built with Adobe Illustrator and Adobe XD. The prototype was evaluated, and user tested by a school kitchen chef and per e-mail by a student.
4 Field work
4.1 Visit at a Swedish high school
The Swedish high school I visited was a UN certified school which means they have competence and high interest in global issues and promote UN goals and principles. They also incorporate a sustainability perspective in the teaching of all of their courses. There are 1000 students going to this school and there are around 130 members in the staff.
After the main entrance was the school cafeteria which adjoined to the canteen. Students were flooding in and out of the canteen and it was very noisy. The cafeteria was well taken care of and had nice and modern interior design and there were students hanging out there. In the corridor outside the canteen there were posters expressing concern towards the students on themes such as health and wellbeing. There was also a weekly menu printed on sheets of paper. Showing that there are always two food options per day, and one of them a vegetarian option. Two days per week are entirely vegetarian. Quarter past twelve the canteen suddenly was very calm and harmonic and there were a few empty tables to sit down at. The canteen was also taken care of with interior design details and more accommodating than first expected.
4.2 Interview with kitchen personnel
Talking to a chef working in the kitchen. Information posters on how much is wasted placed next to the waste bin. The average wasted food is 15-20kg per day. Strong reaction among students and other school personnel, but no effect in reduced food waste. Has observed how some students systematically take more then they eat: “You would think that by taking 5 fish sticks last time you ate and then throw away 2 of them, you would serve yourself 3 fish sticks next time. But this is not the case”. He has gotten the impression that students throw away more food on days where favourite food options are served, presumably due to overserving. He meets students at the end of a lunch break on days when Chicken stew is served, which are upset that the kitchen is out of this food option. And at the same time, he sees how the waste bin is full of Chicken stew: “If their fellow students would have taken less food there would have been enough for everyone”. In addition, the students take large portion sizes of something they have not tasted first and throw it away if it then turns out they do not like it. Since the school kitchen chef has previously worked in commercial eating establishments and restaurants, he has also observed how adults are throwing away a lot of food. He suggests there might be a buffet-culture at base of behaviour regarding buffet serving situations in general. The involvement of kitchen personnel in reducing food waste is high at this school. They have made many adjustments and initiatives to reduce waste during preparation stages, they take care of leftovers and use
them for new dishes and there is the new initiative called Klimatlådan where a food box can be purchased for a reduced price after the serving of lunch is finished. The plate waste is still an issue and there is a feeling of resignation in how to tackle this problem and in getting the students more involved in changing the situation.
4.3 Interview with student
I had a meeting with a student at the school who had made a project regarding the plate waste at the school. She had placed brochures at the serving station with information about that the students throw away 100kg food every week. She heard reactions from fellow students while standing in the serving que, such as “wow, is there so much thrown away”. The food waste measurement system was changed in the kitchen during her project, so she could not compare if there were results from her intervention with her base-line data. She also had wanted to change the plates in the canteen to a smaller size, since she had heard of this being a successful intervention at other schools, but it was not possible for her to order plates for her project. She thinks the problem with food waste occurs due to students take a large portion without tasting first and then discover they do not like it. She does not think the food waste is caused by overserving and satiety. She also thinks that the approach to food has an influence. She describes a friend who does not eat vegetables and dislikes stews, which are frequently served. He prefers “divided” foods, which are not blended together. Therefore, he’s strategy is to take a lot of stew and then poke out the meat and throw away the sauce. The student I interviewed remembers a competition initiated at her primary school, for reducing plate waste. It created focus and incentive during the period for the competition, but she did not get the impression it had lasting effects on behaviour. She believes there is a lack of reasons and incentives to think about and care about reducing food waste in the everyday. Their lunchbreaks are 30-40 minutes long. She thinks this is good they are no longer since then the entire day at school is over quicker. The stressful part of eating is that there are too few tables in the canteen, which makes her feel that someone soon might need her seat. She has experienced an occasion where students have had to bring their plates and eat in the cafeteria area outside the canteen, since there were not enough seating places for all the students at that occasion.
My interviewee is active in the newly founded student council and experiences it gives more consequence to share viewpoints on different matters regarding the school through the student council than it would if teachers were approached directly. She experiences the student council as a good tool for making your voice heard at school and get your opinions taken more seriously, yet the participation of students in student council meetings
has been a bit slow. She thinks the interest in participating would be higher when students experience that the council can influence changes at school and if it would be more high-status and a merit to be a member of the student council, which she sees is the case at other schools. Otherwise the communication with students is today one way directed through information screens, posters and the school email. The student council also uses Instagram to reach students who do not check their e-mail often. The student council has been organizing small events to make school more fun, “so there are not only duties at school”.
4.4 E-mail conversation with student
I discussed the reasons for plate waste in an e-mail conversation with a student. He wanted to add that the” wrong” food is served. If you are vegetarian/vegan or following other diets, it is usual to pick out small pieces of a dish and then throw away the rest. This could also cause students to go and buy food outside school instead. Regarding Livsmedelsverkets suggestion about encouraging students about re-serving food, this is something he has already experienced is done throughout his years at school, but yet there is a lot of food thrown away anyway. Food will be thrown away if the students do not think it tastes good. Therefore, he believes the action with the most impact would be to make the food served better and tastier.” How much nutrition calculations there might be, calculating the nutrition benefit of dishes, it’s not useful if the food is not eaten”. Therefor he thinks the effort should be put in making the food more inviting and tastier. ”How do you know what students like? Ask them! Ask them about what dishes they want and side dishes”. To know what students, want, he suggests to also look which days there is most thrown away, it should be a wakeup call. He compliments that there is always a vegetarian option on the menu, since then it is always at least two courses on the menu. He tries to waste as little as possible himself but the times he does it is because he did not like the food.
4.5 Results of field work
Both the student and kitchen staff shared an understanding of that plate waste is caused due to that students overserve in relation to not liking the food. Both suggest this could be avoided if students tasted the food first before overserving. An alternative to reserving in this case could be to introduce a solution where students are allowed to taste the food options on the menu, before they go and fill their plates with a portion sized helping.
4.5.1 Mismatch in food preferences
The students find that the main problem of food waste could be solved by adapting the menu more to the students’ food preferences and taste. Considering not only the quality of food but taking into account the individual food preferences and the customization strategies the students perform by themselves today which is observed to contribute to food waste. This
perspective is also supported by the design solution MittKäk (described in the related work chapter), which is the solution created in collaboration with students and what they see as a problem to be solved, namely more adaption of the menu to their preferences and more influence and choice regarding the menu.
Both of the interviewed students have observed that students adopt some sort of customization of the food options served, where they pick out the pieces of the dishes they like and then throw away the rest. This could explain the staff’s observation of how chicken stew is a favourite dish which is also wasted a lot, since it is possible that students only eat the chicken and waste the rest of the stew.
4.5.2 Serving behaviour
It is a common understanding among kitchen staff that the students’ favourite dishes generate increased or high plate waste, so the overserving favourite foods cannot be ruled out. Possibly this could be explained by that students “eat with their eyes” when they serve their favourite foods or expect that they want to eat a lot and therefore serve themselves a lot to achieve that goal. In the theory section called How do we serve food? It is stated that we lean on our previous experiences of eating when we estimate our portion size. Perhaps students instead mindlessly lean on their previous experience of overserving certain dishes. The kitchen chef had at least observed overserving patterns, so there are reasons to assume there might be some behavioural patterns and possibly some automatic habitual behaviours at hand. Here might be an opportunity to interrupt and increase the awareness of serving behaviours, possibly by using prompts asking: How much did you eat last time? An automatized overserving behaviour was recounted of by a University teacher which overserved salad in a habitually engrained manner. Despite this, overserving behaviours need to be further researched to be properly accounted for.
There seems to be a lack of intrinsic motivation for reserving in the school canteen, since this behaviour is still suggested to be promoted by the staff. The field work cannot account for what other goals or obstacles might interfere for better introducing this behaviour, but some assumptions can be made. In combination with time pressure, it would seem likely to rather overserve instead of aiming at re-serving, as the preferred strategy used to achieve the goal of eating a lot within a given time frame. It is faster and rational from an individual point of view to serve a lot of food and waste some, then to aim at re-serving as the primary option. Interrupting conversations and leaving your company at the dining table while reserving might also be an unwanted effect. Adults eating at buffet have intrinsic motivation to reserve themselves due to their own goals of trying more food options which seems to be encouraged by the many food options. Perhaps offering more food options at the school canteen could lead to more intrinsic motivation for
reserving food. Yet this might also lead to an overproduction of served foods which can increase the serving waste instead. The MittKäk app is offering several food options per day to the students but the system builds on students pre-ordering their meals, so kitchen staff can estimate the interest in different food options. Additionally, other types of interventions might still be needed for the overserving problem, given adults reserving in buffet settings still may overserve and waste food. Thus, promoting re-serving behaviour is a remaining challenge and question to be answered.
It was found that there is a lot of deliberate thinking and decision-making both when serving food in the canteen and at the buffet in restaurants. Some results hints at the existence of automatic behaviours in the serving situation.
4.5.3 Reframing the problem
Instead of a waste problem, the problem space could be framed as an overserving problem or a problem of not matching food preferences.
5 Design phase
5.1 Identified design opportunities
5.1.1 Change the social practice of eating at school
In the school canteen the social practice of serving food seems to have emerged from values of efficiency which has created a fast-paced functional eating environment, where many students can eat during a short time period. There is also a large focus on the nutrition calculations of dishes rather than on adapting them to the student’s food preferences. This social practice could also be seen as part of the public sector, funded by tax money, in comparison with private eating establishments where a pleasurable experience is at centre for making guests return and for the company’s economic survival.
A to small seating area may increase the feeling that other students need your seat and make the eating experience less relaxed. This could be approached by adding more seats and by a bigger canteen size, perhaps combined with an improved scheduling of lunchbreaks. Yet the noisiness and stress may also increase by more people, so textiles or other means of reducing the noise and create a calmer atmosphere might be needed. Stress can also be caused by peer pressure, if peers are finishing their meal before you and want to leave. This could be approached by making it organizationally possible and pleasant to hang out at the canteen after eating. Allowing other activities than eating, such as boardgames and creating a social atmosphere resembling a school cafeteria.
There are collective behaviours for the procedure of taking food smoothly and fast and individuals become part of this pattern of practice since they do not wish holding up the cue. Therefore, the inherent feeling of time-pressure and fast paced serving flow in the canteen could be remodelled by changing the interior design. At the canteen I visited, the food is placed directly at the entrance of the canteen. There seems to be descriptive norms of taking food first and then take a seating. Placing serving stations differently in the room might change the way students interact with them and might lead to facilitate a re-serving behaviour. The ability of physical surroundings in influencing behaviours is recognized within the field of Service Design by the Servicescape model (Bitner, 1992). The model describes how physical environments represent a subset of social rules, conventions and expectations and has impact on how social relationships are formed. It recognizes that individuals have goals when approaching a service experience and investigates how well an organization accommodates these goals by the physical environment.
5.1.2 Taste first intervention
If the students were given the opportunity to taste the dishes first, they might not overserve and waste dishes they do not like. A concept called Smakskedar, ”tasting spoons” is suggested by Livsmedelsverket (2019) to encourage kids to try new dishes, could also be used to reduce plate waste. Some ideas of a “taste station” arose, where the school children can taste the food on today’s menu and then through digital means leave comments and feedback on the dishes, and thereby become involved in an ongoing conversation about food preferences. Adding a new touchpoint into the serving flow at the canteen would only be meaningful if it was tested in the reel context during the design process. Since the serving situation is fast paced and this type of intervention might hold up the cue or possible be ignored, other arrangements such as placements of the other serving stations in the specific room might be part of the design process. Changing the social context of the canteen to become calmer and reducing the serving pace might also correlate for a “taste station” to work out in the given setting. Introducing tasting spoons, choosing their placement in relation to the food trays and then the disposal of used spoons, combined with making it socially acceptable to add an extra step in the serving procedure could also be an interesting design project.
5.1.3 Overserving intervention
Instead of increasing the awareness of waste behaviours at the waste bin, a design approach could be to increase the awareness of serving behaviours instead. Here might be a design opportunity to interrupt serving behaviours, possibly by using prompts asking: How much did you eat last time? The kitchen chef and high school student interviewed during field research have tried informational prompts which stirred emotional reactions, but their effects could not be concluded. Prompts telling food guests which behaviours
should be avoided and suggesting alternative actions, have already successfully influenced overserving behaviour (the section Overserving interventions) although their long-term effects were not evaluated. Additionally, it has not been tested if they have an effect on automatic and mindless serving behaviour and are prompts exclusively reminders and instructions of (normative) procedural information? To what extent do they interrupt unaware and automatic behaviour? This needs to be tested in the field. In addition, the serving behaviours have not been sufficiently researched here to inspire the design of another type of intervention.
5.1.4 Match food preferences
Both theory and field research points at the need of adapting the lunch menu more to school children’s’ food preferences. As suggested by Livsmedelsverket, there is also an opportunity of including students in menu planning and in creating a dialog around food preferences. Within the scope of this project I have chosen the opportunity of measuring what students have eaten. To gain more quantitative data on food preferences and hopefully this data would also support a later qualitative project of discussing food preferences and the reasons for why some dishes are liked or disliked.
5.1.5 Create more dialog
By my first visit at the school I could observe a large involvement from the staff there in expressing concern of their students. Manifested in investments in the interior design and posters concerning student health. Yet I could also conclude from my interview with the student that the communication with students at the school was mainly top-down. The students are seemingly having a lack of interest and involvement in issues regarding the school, yet there seems to be a lack of dialog with and listening to the students.
5.1.6 Measuring the eaten food and plate waste
Due to a suggested overserving pattern, leading to more food waste of preferred foods. It would not be fruitful to have the amount of plate waste as only indicator of the students’ food preferences. An indicator of food preferences could therefore instead be to measure how much the students have eaten, by measuring the amount of food served and subtracting the wasted food (this is also suggested by Livsmedelsverket 2020). The data provided would show if students have eaten a lot and wasted a lot, or not eaten a lot and wasted a lot.
The discussion around food waste seems to be of a sensitive matter, and there is a possible conflict space regarding it. Since on the one hand students have critique on the served food, and therefore critiquing the kitchen staff on their work and on the other hand the kitchen staff observe the students’ behaviour of over-serving and wasting food and their lack of taking responsibility regarding this. This scenario makes it possible for both stakeholders to shove
the responsibility of the existence of plate waste onto each other and seeing the solution as being at the hands of the other part.
More detailed plate waste data will hopefully also be used to further the dialog between staff and students on the reasons for why plate waste and over-serving behaviours exist. Assuming the data will be able to account for how the students waste behaviour is due to a mismatch in food preferences or due to overserving issues. A data collection solution is estimated to be useful as an evaluation tool for future plate waste interventions, including the evaluation of the long-term effects of interventions.
5.2 Ideation and concept development
5.2.1 First ideation session
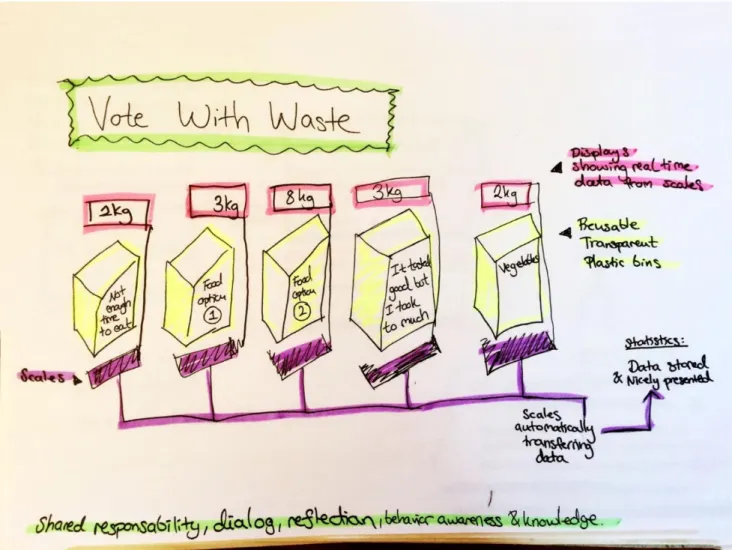
In the Vote with waste concept (fig. 13) school children may both reflect on their reasons for wasting food and communicate them to the staff. There is also a detailed measurement of which food options are wasted. This type of construction would not fit into the often-limited physical space at the dish return and waste disposal.
The impressions from desk research and field research were gathered in a sketch, resulting in a data tracking and Service Design concept (fig. 14).
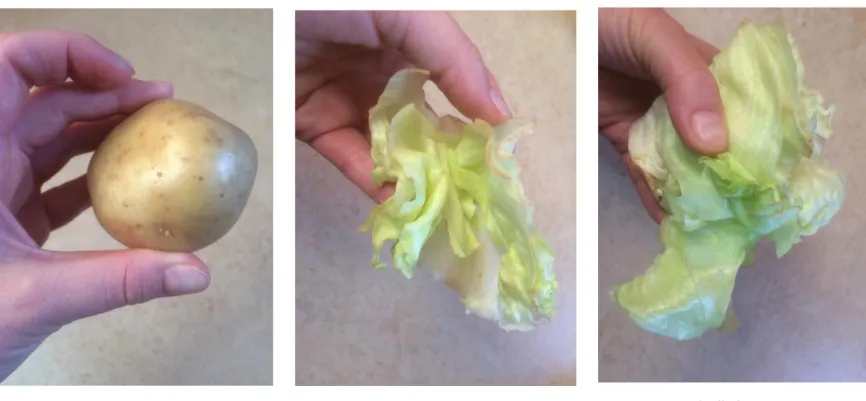
5.2.2 How much food waste is ok per person?
The school I visited had 20kg plate waste among 1000 students. 20kg is a lot of unnecessary food waste. Yet if everybody wasted some of their meal, the average plate waste would be 20g per person, which is the same amount of salad shown in figure 16. Many companies and food waste interventions state that plate waste was reduced by 30 or 40%. Reducing plate waste by 40% at this school would mean the average waste is 12g (half of the salad shown in figure 16) per person. The other pictures present a 120g potato (fig 15) and 50g of salad (fig. 17). Since the eco-feedback technologies described in the related work chapter communicate personal feedback when food is wasted, these messages also evaluate and decide how much food waste is acceptable per person.
Are there a few ”waste villains” operating or are the 20 kilos caused by a little food wasted by the many? In the case of 1000 students’ each wasting 20 g salad, they might find their own individual waste contribution neglectable. If a smaller and varying group of students are responsible for the accumulated plate waste, what would it imply for a design solution to hold them responsible for changing their behaviour? This experiment raised an interest in measuring how many of the students are wasting food.
Figure 16. 20g of sallad
This design is a tool for the kitchen staff, for logging both the plate waste and the meal consumption more efficiently and automatically. In this solution the arrival of students is logged every time a plate is removed from the pile of plates, since a scale detects a weight difference when a plate has been removed. This makes it possible to count the number of students eating and logging a time stamp for their arrival. Counting the arrival of students at the canteen serves making the data measurement of plate waste more reliable, since otherwise it might be forgotten when done manually. Measuring the arrival time of students in the canteen can make it visible for staff responsible for scheduling how well the visiting pressure is distributed during lunch hours. It would also show if the flow of students arriving for lunch is matching the seating possibilities. The number of students arriving at the canteen could vary dependant on if students are on sick leave or are on excursion with their class etc. It could also be the case that students choose to go out and buy food (or candy) somewhere else if they do not like the food served at the canteen. Therefor the headcount of students could also be seen as a form of success rate in attracting students to the canteen.
The served food is measured every time the kitchen staff carry out a new tray to the serving station. The plate waste is then measured and logged at the bin. Since there is a time stamp registered every time new weight is measured by the waste bin scale, it is possible to count the number of students wasting and what time they are wasting. This design solution is meant to facilitate some work which kitchen staff already do manually today. For logging the headcount of students per day, it is common the trays with used plates are counted by the staff and registered manually. This manual registration can easily be forgotten at the end of a stressful workday, which then ruins the statistics for waste measurement that day. Registering the trays of served food is also done manually yet weighing them is only done occasionally (perhaps during one week per year dedicated for measurements) since it is experienced as too much work to carry out on a daily basis. In this solution the weighing, counting and registering of served food trays is automatically incorporated in the action of serving food.
A main objective of the design is to continually learn about what students eat and what they waste. The continuous measurement of how much students eat and waste, makes it possible to use as a tool for following up the long-term effects of interventions done at individual schools to reduce the plate waste and increase the students’ food consumption. Measuring what students eat, by measuring the served food and subtracting the wasted food, has previously not been done in this automatic way. It has been possible to connect waste data with a grocery ordering service, to see how much of the ordered foods have been used or wasted. Yet the plate waste is measured when the edibles
have been cooked, which makes it more precise to measure the served food, when the edibles have been cooked as well.
Logging data of the student’s arrival and what food option they take, could also be sent for real time monitoring from the kitchen, as seen in fig. 18. This could help with refilling the buffet and only serve one food tray at the time, as recommended by Livsmedelsverket (2020). The usefulness of this feature was evaluated with a Kitchen chef working at a small school with a little more than 300 students. Since the kitchen staff at this school are out in the canteen with the students during the entire lunch they will see if food needs refilling. With time they develop a gut feeling regarding how many students have eaten and are still expected to arrive. She thought this functionality might be more useful in bigger schools where there is a much larger number of students which might be harder to estimate by a gut feeling. In larger schools a service to use from the kitchen might also still be relevant, since she observed there are some chefs which are spending all of their time in the kitchen and not meeting the students at all. There was some ambiguity to this sketch, since the percentage of the food options could be interpreted as the percentage of all prepared food for the day. The Kitchen chef said they would never prepare more food during lunch if they were running out, since it is too busy then and it takes preparation time for cooking a meal. They would rather complement by serving leftovers. Although the ambition is to guarantee that the children will have the food options on the daily menu available until the end of lunch. Perhaps this functionality could be useful in a big kitchen which is