ZAHRA EL-SCHICH
NOVEL IMAGING TECHNOLOGY
AND TOOLS FOR BIOMARKER
DETECTION IN CANCER
MALMÖ UNIVERSIT Y HEAL TH AND SOCIET Y DOCT OR AL DISSERT A TION 20 1 6:3 ZAHR A EL -SC HIC H MALMÖ UNIVERSIT Y 20 1 6 N O VEL IMA GIN G TEC HN OL OG Y AND T OOL S FOR BIOMARKER DETECTION IN C AN CERNOVEL IMAGING TECHNOLOGY AND TOOLS FOR BIOMARKER DETECTION IN CANCER
Malmö University
Health and Society, Doctoral Dissertation 2016:3
© Copyright Zahra El-Schich 2016
Front illustration: Dying cells captured with digital holography microscopy. www.phiab.se
ISBN 978-91-7104-660-4 (print) ISBN 978-91-7104-661-1 (pdf) ISSN 1653-5383
Malmö University, Sweden, 2016
Faculty of Health and Society
Department of Biomedical Science
ZAHRA EL-SCHICH
NOVEL IMAGING
TECHNOLOGY AND TOOLS
FOR BIOMARKER DETECTION
IN CANCER
Till min familj
”Research is to see what everybody else has seen, and to think what nobody else has thought”
CONTENTS
CONTENTS ... 6
ABBREVIATIONS ... 8
ABSTRACT ... 10
LIST OF ORIGINAL PAPERS ... 11
Authors ‘contributions... 11
INTRODUCTION ... 13
Apoptosis ... 15
B cell development ... 17
Leukemia and lymphoma ... 20
Molecular Imprinting Polymers ... 24
Digital Holographic Microscopy ... 26
AIMS OF THE THESIS ... 32
Paper I ... 32 Paper II ... 32 Paper III ... 32 Paper IV ... 32 METHODS ... 33 Patient samples ... 33 Ethics ... 33 Cell lines ... 33 Quantitative PCR ... 34
Western blot analysis ... 34
Immunoprecipitation and protein tyrosine phosphatase assay ... 34
Flow cytometry analysis ... 35
Fluorescence microscopy ... 35
Reagents ... 36
Cell viability measurements ... 36
Antibody-based microarrays ... 36
DH microscopy analysis ... 37
Statistical analysis ... 37
BCR signaling suppressor SHP-1 is active in CLL lymph node and
peripheral blood (Paper I) ... 38
Different expression levels of glycans on leukemic cells - a novel screening method with molecularly imprinted polymers (MIP) targeting sialic acid (Paper II) ... 39
Induction of morphological changes in death-induced cancer cells monitored by holographic microscopy (Paper III) ... 40
Interfacing antibody-based microarrays and digital holography enables label-free detection for loss of cell volume (Paper IV) ... 41
CONCLUDING REMARKS ... 42 Paper I ... 42 Paper II ... 42 Paper III ... 42 Paper IV ... 43 POPULÄRVETENSKAPLIG SAMMANFATTNING ... 44 ACKNOWLEDGMENTS ... 47 REFERENCES ... 49 PAPER I-IV ... 63
8
ABBREVIATIONS
ALL Acute lymphoblastic leukemia
AML Acute myeloid leukemia
Apaf-1 Apoptotic protease activating factor 1
Bcl-2 B cell lymphoma 2
Bcl-XL B cell lymphoma extra large
BCR B cell receptor
BM Bone marrow
Pre-B cell Precursor B cell
Pro-B cell Progenitor B cell
Caspase Cysteine aspartyl-specific protease
CD Cluster of differentiation
CDKs Cyclin dependent kinases
CLL Chronic lymphocytic leukemia
CML Chronic myeloid leukemia
DH Digital holography
DLBCL Diffuse large B cell lymphoma
FADD FAS associated death domain containing protein
FL Follicular lymphoma
Ig Immunoglobulin
IGHV Immunoglobulin heavy chain variable
LN Lymph nodes
LYN Lck/Yes novel protein tyrosine kinase
MCL Mantle cell lymphoma
MIP Molecular imprinting polymer
Neu5Ac N-acetylneuraminic acid
Neu5Gc N-glycolylneuraminic acid
9
PB Peripheral blood
PTK Protein Tyrosine Kinase
PTP Protein Tyrosine Phosphatase
SA Sialic acid
ScFv single-chain variable antibody fragments
SHP-1 SH2-domain containing phosphatase 1
SYK Spleen tyrosine kinase
TNFR Tumor necrosis factor receptor
10
ABSTRACT
Cancer is a leading cause of death worldwide. Normally the balance between cell growth and cell death is strongly controlled. Chronic lymphocytic leukemia is an indolent disease that has a highly variable clinical course and is the most common hematological malignancy amongst adults in the Western countries. The protein tyrosine phosphatase SHP-1 is a key regulator that controls the intracellular phosphotyrosine level in lymphocytes by inhibiting the B cell re-ceptor signals. We have compared the expression and activity of SHP-1 in chronic lymphocytic leukemia cells from lymph nodes with matched peripheral blood samples. The expression levels of SHP-1 were higher in peripheral blood, but the phosphatase activity in lymph nodes and peripheral blood did not differ significantly. All cells in the body normally present glycans on the cell surface, which are involved in cellular communication and in processes like cell differ-entiation, proliferation and infection, including protecting the cells from in-vaders and in cell-cell contacts. Sialic acid occurs on the terminal end of glycans, and the frequency of sialic acid expression is increased on metastatic cancer cells and overexpression controls tumor cell growth and cell differentiation. The availability of specific antibodies against sialic acid is limited. We have been screening sialic acid on cancer cells by using a molecular imprinting polymer technique. Our results show that sialic acid is expressed on chronic lymphocytic leukemia cell lines at different levels at the plasma membrane. Higher expres-sion of sialic acid in the more aggressive chronic lymphocytic leukemia cell lines was observed. To analyze morphological changes of death cells, digital holo-graphic microscopy was used. Digital holoholo-graphic microscopy is an approach for label-free non-invasive 3D imaging of cultured cells. We have analyzed cell death of adherent cancer cells using digital holographic microscopy and devel-oped it to analyze suspension cells by combining this technique with antibody based microassays. Digital holographic microscopy can be used for cell-death induced cell analysis of both adherent cells and suspension cells. This thesis takes us one step further in cancer research as regards developing techniques for screening circulating cancer cells in blood as well as for individualized treatment of cancer patients.
11
LIST OF ORIGINAL PAPERS
I. I.I.
I. Bergh A.C., ElElEl----Schich ZElSchich ZSchich ZSchich Z., Delfani P., Ohlsson L., Rósen A., Gjörloff Wingren A. B cell receptor signaling suppressor SHP-1 is active in CLL
lymph node and peripheral blood. Manuscript in preparation.
II. II.II.
II. ElElEl----Schich ZElSchich ZSchich ZSchich Z., Mohammad A., Shinde S., Dizeyi N., Rosén A., Sellergren B., Gjörloff Wingren A. Different expression of glycans on leukemic cells - a screening with molecularly imprinted polymers targeting sialic
acid. Manuscript submitted for publication.
III. III.III.
III. ElElEl----Schich ZElSchich ZSchich ZSchich Z, Mölder A, Tassidis H, Härkönen P, Falck Miniotis M, Gjörloff Wingren A. Induction of morphological changes in
death-in-duced cancer cells monitored by holographic microscopy. Journal of
Structural Biology. 2015 3;189(3):207-12.
IV. IV.IV.
IV. ElElEl----Schich ZElSchich ZSchich ZSchich Z, Nilsson E, Gerdtsson AS, Wingren C, Gjörloff Wingren A. Interfacing antibody-based microarrays and digital holography enables
label-free detection for loss of cell volume. Future Science OA.
2015(0):1-11.
Authors ‘contributions
In paper I ZE designed the study, performed the experiments and analyzed the data. In paper II ZE designed the study, performed the experiments, analyzed the data and wrote the manuscript with contributions from the other authors. In paper III ZE designed the study, performed all the experiments, analyzed the data and wrote the paper with contributions from the other authors. In paper IV ZE performed the experiments, analyzed the data and wrote the paper with contributions from the other authors.
13
INTRODUCTION
Cancer is a leading cause of death worldwide (Torre et al. 2015). There are more than 100 types of human malignancies found in different organs (Hana-han & Weinberg 2000). Cancer is involved in morphological cellular transfor-mation, uncontrolled cell proliferation, metastasis, dysregulation of apoptosis,
invasion and angiogenesis (Fischer-Fodor et al. 2015; Lin & Karin 2007).
Metastasis is a complex multi-step process, were primary tumor cells migrate and metastasize to other organs in the body by the blood system and form sec-ondary tumors (Chaffer & Weinberg 2011; Zimmer & Steeg 2015). However, metastasizing tumors lose their adhesion to other cells; they destroy and degrade the extracellular matrix and basement membrane and enter the blood system.
Figure 1 shows a schematic drawing of tumor metastasis (Fidler 2003; Lu et al.
2012; van Horssen et al. 2013).
Figure 1. Schematic drawing of tumor metastasis. Modified from (Fidler 2003)
14
The balance between cell growth and cell death is strongly controlled (Gérard & Goldbeter 2014). Cell death occurs in different ways, through apoptosis or necrosis. Apoptosis is a thoroughly investigated mechanism that occurs nor-mally in the body and plays a central role in development as well as in homeo-stasis and is necessary for removal of dysfunctional, mutated or tumor cells
(Alibek et al. 2014; Taylor et al. 2008). Mutations of apoptotic genes promote
disorders such as autoimmune diseases and cancer. Dying cells differ from via-ble cells in several aspects (Ashkenazi & Salvesen 2014). Apoptosis characterize a variety of morphological changes such as loss of cell membrane asymmetry and attachment, cell shrinkage, formation of small blebs, nuclear fragmenta-tion, chromatin condensafragmenta-tion, chromosomal DNA fragmentation and finally breakdown of the cell into several apoptotic bodies (Debatin 2004; Elmore 2007; Wong 2011).
15
Apoptosis
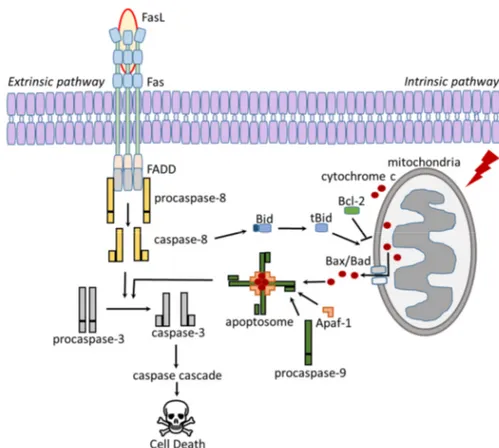
Apoptosis can be realized according to two different mechanisms, the intrinsic pathway and the extrinsic pathway (Figure 2). Apoptosis is mediated by multi-protein complexes called cysteine aspartyl-specific protease (caspases) (Logue
& Martin 2008; Nair et al. 2014). The intrinsic pathway, which is also known
as the mitochondrial pathway, can be activated by various stimuli, including cellular stress, viral infections, toxins, free radicals, or radiation. Damage to the
cellular DNA can also induce the activation of the intrinsic pathway (Baig et al.
2016; Khan et al. 2014).
Mitochondria release cytochrome c, which binds to and activate Apaf-1. Acti-vated Apaf-1 binds to procaspase-9 to form the apoptosome complex. The apoptosome cleaves and activates caspase-9, which leads to activation of
caspase 3 and the caspase cascade (Langlais et al. 2015; Reubold & Eschenburg
2012).
Figure 2. Schematic overview over the apoptotic path-ways. Modified from (Sessler et al. 2013).
16
The extrinsic pathway, also known as the death receptor pathway, can be in-duced through the activation of death receptors such as Fas (known as CD95)
and the tumor necrosis factor receptor (TNFR) (Ashkenazi 2015; Tchikov et al.
2011). Binding of the Fas ligand (FasL) induces Fas trimerization, and the Fas trimer recruits the initiator procaspase-8 via the FAS associated death domain (FADD) containing protein. Activated caspase-8 can directly activate caspase-3
which leads to cell death (Fulda & Debatin 2006; Galluzzi et al. 2012a;
Kauf-mann et al. 2012).
Apoptosis is expressly regulated by the Bcl-2 protein family. The Bcl-2 family
functions both as pro-apoptotic and anti-apoptotic proteins. Bid is cleaved and
activated by caspase-8, which activate the pro-apoptotic Bcl-2 proteins Bax and
Bad to form mega channels in mitochondrial membranes for cytochrome c
re-lease (Goldar et al. 2015; Westphal et al. 2011). Anti-apoptotic Bcl-2 proteins,
such as Bcl-2 itself and Bcl-XL inhibit Bax/Bad activation leading to inhibition
of cytochrome c release (Kvansakul & Hinds 2013; Sessler et al. 2013).
In contrast to apoptosis, necrosis is cell death in living tissue characterized by
cytoplasmic swelling that induce an inflammatory response (Kroemer et al.
2009). Specific morphological features, in particular volume changes, accom-pany cell death processes and are often used to define the different cell death
pathways (Krysko et al. 2008). A regulated necrotic pathway, also known as
necroptosis, is necessary for non-apoptotic signaling and is occurs when caspase-8 is inactive or inhibited. Receptor interacting proteins will instead be
activated by FADD (Ouyang et al. 2012) and interact with other proteins to
form a necrosome complex (Pasparakis & Vandenabeele 2015). Necrosomes stimulate regulated necrosis by activating other proteins followed by
necropto-sis, and by promoting mitochondrial fragmentation (Galluzzi et al. 2012b;
17
B cell development
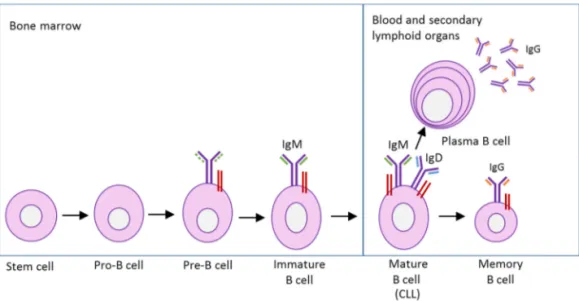
Hematopoietic stem cells are produced in the bone marrow and have the unique ability to give rise to all of the different blood cell types and tissues (Wilkinson & Göttgens 2013). Normal B cells express the antigen receptor (BCR) on the surface, which binds antigens and transmits signals that regulate B cell activa-tion, growth and differentiation. The B cell differentiation is a tightly regulated process starting in the bone marrow from a lymphoid stem cell progenitor, the (pro)-B cell (Melchers 2015). In a pro-B cell (Figure 3), the immunoglobulin (Ig) heavy chain genes start to rearrange and when the heavy chain is expressed, the pro-B cell develop to a precursor (pre)-B cell (LeBien & Tedder 2008). The pre-B cell continue the development and rearrange the Ig light chain genes express-ing a functional membrane-bound IgM and will then be classified as an imma-ture B cell in the developmental stage. Immaimma-ture B cells enter a checkpoint, where autoantigens are presented. B cells expressing high-affinity autoreactive
BCRs are deleted via a mechanism called negative selection (Köhler et al. 2008;
Victora & Nussenzweig 2012). B cells expressing low-affinity autoreactive BCRs are positively selected to exit the bone marrow and migrate to the sec-ondary lymphoid organs to produce mature B cells that are characterized by the co-expression of IgM and IgD on the surface together with two signal proteins, Ig-α and Ig-α heterodimers (Dylke et al. 2007; Reth & Nielsen 2014).
18
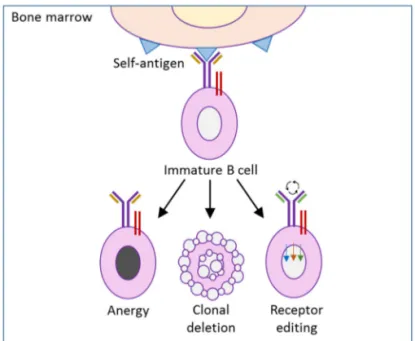
Normally the body produces autoreactive B cells at high frequency in the bone
marrow (Cambier et al. 2007). Over 85% of the newly formed immature B cells
die in the bone marrow, probably as a consequence of the negative selection (Melchers 2015). Autoreactive B cells must be silenced to prevent autoimmune disease (Nemazee 2006). The silencing occurs by the tolerance mechanisms, clonal deletion, receptor editing and anergy (Figure 4) (Rosenspire & Chen
2015; Yarkoni et al. 2010). Clonal deletion is induced cell death by apoptosis.
Receptor editing is when the B cell undergoes a second rearrangement forming a receptor specificity for a non-self-antigen instead of the self-antigen (Halver-son et al. 2004). Finally, anergy is when B cells become tolerant to autoantigens. Anergy can be defined as the functional long term inactivation of autoreactive B cells to further signals through the BCR and it occurs normally when the B
cell expresses low affinity for the self-antigen (Hippen et al. 2005; Phan et al.
2003).
The B cells have to bind to their specific antigen to become activated and start to proliferate when the activating signals are provided from either the T helper cells or when the B cell binds to an antigen via its BCR (Buchner & Muschen
19
2014; Cerutti et al. 2011). Germinal centers are structures in the lymphoid
or-gans where the mature B cells proliferate and class switches take place (Eibel et
al. 2014; Klein & Dalla-Favera 2008). B cells can change their BCR isotype form to IgG, IgE or IgA, depending on the provided signal (Lanasa & Weinberg 2011; Pieper et al. 2013). In the germinal center, the B cells will undergo another checkpoint and cells expressing BCRs with high affinity against the activating antigen will be selected and differentiated into plasma cells or IgG expressing memory B cells. Plasma cells can survive for extended periods of time without
20
Leukemia and lymphoma
During development of hematopoiesis, different disruptions of cell division, dif-ferentiation and apoptosis may lead to mutations and disorders that can case
leukemia or lymphoma (Packham et al. 2014). Leukemia and lymphoma are the
classifications of tumors of the blood, bone marrow or lymphoid system. Leu-kemia’s are single cells proliferating in the blood or lymph and lymphomas are tumors in the lymphoid tissues proliferating as solid tumors (Goldsby et al.
2000). There are different subtypes of leukemia and lymphomas (Jaffe 2009). Examples of the leukemia types include acute lymphoblastic leukemia (ALL); acute myeloid leukemia (AML), chronic lymphocytic leukemia (CLL) and chronic myeloid leukemia (CML). Examples of the lymphomas types include diffuse large B cell lymphoma (DLBCL), follicular lymphoma (FL) and mantle cell lymphoma (MCL) (Jaffe 2001).
Chronic Lymphocytic Leukemia
CLL is the most common hematological malignancy amongst adults in the Western countries. In Sweden, about 400 people are diagnosed with CLL yearly, according to the Swedish Cancer Society, and the median age at diagnosis is 72 years (Baliakas et al. 2015).
CLL is characterized by a clonal expansion of neoplastic CD5+, CD19+ and
CD23+ B-cells in the peripheral blood (PB), bone marrow (BM), lymph nodes
(LN) and spleen (Chiorazzi et al. 2005; Hallek et al. 2008; Rozman &
Mont-serrat 1995). CLL cells with unmutated Ig heavy chain variable (IGHV) genes are associated with high cell proliferation and a more aggressive form of disease,
compared to CLL cells with mutated IGHV genes (Rosenwald et al. 2001).
Pa-tients with unmutated Ig genes have a median survival of 8 years (Hamblin 2011), while those with mutated Ig genes have an indolent disease with up to
more than 25 years survival (Dighiero & Binet 2000; Siddon et al. 2013).
Her-ishanu et al. showed that CLL cells proliferate highly in the BM and the LN
compared to CLL cells in PB, and genes significant for BCR signaling are up-regulated in the BM and the LN CLL cells, compared with circulating PB cells (Herishanu et al. 2011).
21
Protein Tyrosine Phosphatases and Kinases
Protein tyrosine phosphorylation is a key mechanism regulating cell signaling
and occurs in every physiological process (Alonso et al. 2004). Protein tyrosine
phosphorylation controls different signaling pathways, and will affect cell pro-liferation, differentiation and apoptosis as well as cell activation, motility and
morphology (Mustelin et al. 2005).
The protein tyrosine phosphatase (PTP) SH2-domain containing phosphatase 1 (1) is a non-receptor tyrosine phosphatase located in the cytoplasm. SHP-1 is a key regulator that controls the intracellular phosphotyrosine level in
lym-phocytes (Wu et al. 2003). SHP-1 acts as a negative regulator of cell signaling
in several hematopoietic cells and epithelial cells (Neel et al. 2003). SHP-1 mRNA levels are shown to be decreased in lymphoma and leukemia cell lines and tissue, and therefore SHP-1 is proposed to function as a tumor suppressor
gene (Amin et al. 2007; Khoury et al. 2004; Koyama et al. 2003; Oka et al.
2001).
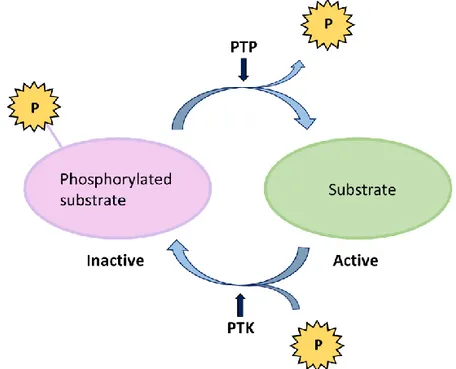
Figure 5. PTP dephosphorylate the tyrosine residues while PTK phosphorylate the tyrosine residues in tar-get substrates. Modified from (Tonks 2013).
22
Protein tyrosine kinases (PTKs) are enzymes that specifically activate proteins by phosphorylation (Figure 5) and play a key role in cell development and lym-phocyte activation (Chakraborty & Weiss 2014). Abnormal PTK expression or activity can lead to malignant transformation and tumor development (Blume-Jensen & Hunter 2001). Figure 6 shows a schematic overview of the BCR and the different proteins involved in the phosphorylation and dephosphorylation of the receptor. SHP-1 is the substrate for various PTKs, such as the
Lck/Yes novel protein tyrosine kinase (LYN), Spleen tyrosine kinase (SYK) and
the 70 kDa zeta chain associated protein kinase (ZAP70) (Brockdorff et al.
1999; Neel et al. 2003; Poole & Jones 2005); the PTKs function as suppressors
of BCR activation and downregulate the cell proliferation, for example by acti-vation of SHP-1 (Neel et al. 2003).
Figure 6. Schematic overview of the SHP-1 activation in CLL. The BCR is activated by binding of the antigen and LYN and SYK phorylate the transmembrane proteins Ig-α and Ig-β. LYN phos-phorylates CD5 that in turn work as a docking site for SHP-1.
23 ZAP70 is normally expressed in T cells, thymocytes and natural killer (NK) cells. ZAP70 is overexpressed in CLL cells and ZAP70 positive cells with
un-mutated Ig genes are correlated with aggressiveness of the disease (Sivina et al.
2011; Wiestner et al. 2003). The SHP-1 protein has a central role in normal cell
growth by regulating the activity of PTKs (Delfani & Wingren 2012), and is
similarly expressed in CLL PB cells and normal B cells (Negro et al. 2012). In
CLL, LYN phosphorylates CD5, which in turn serves as a docking site for SHP-1. When recruited to the plasma membrane, SHP-1 is phosphorylated (Tibaldi
et al. 2011).
CLL is known to be unresponsive to BCR stimulation because of anergy
(Mockridge et al. 2007; Muzio et al. 2008). Anergized B cells are characterized
by a lower sIgM and sIgD expression compared to normal mature B cells
(Apol-lonio et al. 2013; Quach et al. 2011; Slupsky 2014). CLL with mutated Ig genes
(Guarini et al. 2008; Herve et al. 2005) and with low expression or absence of
ZAP70 are correlated with anergy and with unresponsiveness to BCR
stimula-tion (Chen et al. 2002; Packham et al. 2014). Anergic CLL cells are difficult to
treat through BCR signaling pathways. However, the new treatments specifi-cally targeting the BCR signaling pathways are showing promising results on the aggressive form of the CLL and may lead to successful treatment (Friedberg
et al. 2010; Hoellenriegel et al. 2011; Ponader et al. 2012).
Treatment
Patients with CLL have longer survival rates due to the large number of
prom-ising new therapeutic agents and cellular therapies (Mato et al. 2015). New
bi-ological markers and improved prognosis may allow for a more targeted
indi-vidualized therapy (Vaque et al. 2014). CLL is an indolent disease that has a
highly variable clinical course. Two prognostic staging systems exist, the Rai classification (Rai et al. 1975) and the Binet classification (Binet et al. 1981). One of the main challenges in cancer treatment today is to choose the proper individual treatment for each cancer patient. The three main treatment strate-gies presently used are chemotherapy, targeted therapy, and monoclonal anti-body therapy. When the patient does not show any symptoms, normally the “watch and wait” policy is used and in those cases no treatment is needed (Else
24
Molecular Imprinting Polymers
Glycans are polysaccharides that are present on the surface of all cells. Glycans are involved in cellular communication and in processes such as cell differenti-ation, proliferation and infection, including protecting the cells from invaders and in cell-cell contacts (Adamczyk et al. 2012; Varki & Lowe 2009). Sialic acid (SA) is a monosaccharide, terminally expressed at the end of glycan chains, which functions as a cell marker, and can be recognized by a variety of receptors (Ohtsubo & Marth 2006). SA plays an important role in immunity regulation
and may have an inhibitory effect on immune activation (Fujita et al. 1999).
The two main common forms of SA in nature are human N-Acetylneuraminic
acid (Neu5Ac) and nonhuman N-glycolylneuraminic acid (Neu5Gc).
Nonhu-man Neu5Gc has been found in normal huNonhu-man cells, where it has been absorbed
from the food intake, especially from red meat (Samraj et al. 2014;
Tangvora-nuntakul et al. 2003).
In the late 1980s, researchers started to realize an association between SA and
cancer, especially in metastatic cancer (Dennis et al. 1989; Hoff et al. 1989).
The SA expression is increased in metastatic cancer cells (Cui et al. 2011; Varki
& Varki 2002) and overexpression is reported to affect tumor cell growth and cell differentiation (Ferreira et al. 2013; Seidenfaden et al. 2003).
A common detection method for analyzing glycans is using labelled lectins (Cho
et al. 2014). The availability of specific antibodies against SA is limited due to difficulties to discriminate between various glycan species in combination with
low specificity and affinity to SA (Cummings 2009; Fujitani et al. 2013).
Mo-lecular imprinting polymers (MIP) is a technique to design selective artificial receptors produced by allowing a polymer to form in presence of a template. After removing the template, the resulting MIP can be used as a plastic antibody
(Vasapollo et al. 2011). Recently, different monosaccharide imprinting
proce-dures have been used to produce fluorescently labeled probe nanoparticles dis-playing an unprecedented affinity for the targeted terminal monosaccharides in
cell staining experiments (Kunath et al. 2015). Based on a ternary complex
im-printing approach we developed SA-imprinted core-shell nanoparticles,
conju-gated with a fluorescent reporter group (Shinde et al. 2015); the SA-MIP binds
specifically to SA on the cell surface (Figure 7). The main advantage of this
technique is that it displays a high affinity and selectivity for SA (Alexander et
25
2011).We have recently shown that SA-MIPs selectively targeted prostate
can-cer and leukemia cell lines, using flow cytometry and fluorescence microscopy (Shinde et al. 2015).
Figure 7. Principle of using MIPs as “plastic antibod-ies” for imaging of sialic acid terminated glycan mo-tifs. Modified from (Shinde et al. 2015).
26
Digital Holographic Microscopy
Dennis Gabor discovered the fundamentals of holography in the late 1940s and in 1971 he received the Nobel Prize in Physics for this development (Gabor 1949). Since then, holography has become a well-established imaging technique. Digital holographic (DH) microscopy is a digital high resolution holographic imaging technique with the capacity of quantification of cellular conditions
without any staining or labeling of cells (Alm et al. 2011; Marquet et al. 2005;
Rappaz et al. 2005).
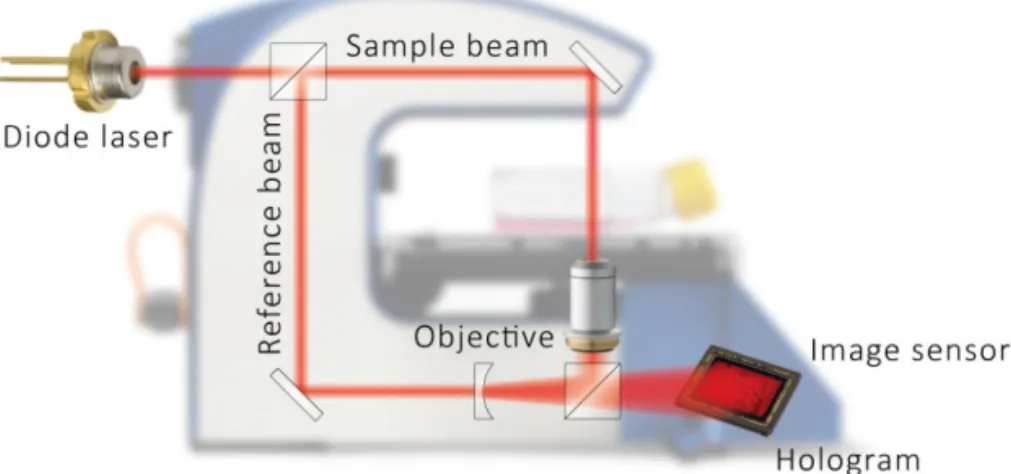
DH microscopy builds on red coherent laser light, from a diode laser. The pri-mary light beam is split into two beams, an object beam and a reference beam. The object beam will pass through the sample, which in this case are living cells, and then merge with the reference beam, thus creating an interference pattern
(Figure 8). The interference pattern will be captured by a light detector (e.g., a
CCD-sensor) and computer algorithms convert the signal into a holographic image based on the light phase shifting properties of the cells (Xiao & Puri 2002). The three-dimensional holographic image is then an impression of the real cells (Sebesta & Gustafsson 2005).
Various cellular parameters can be visualized and calculated from the particular hologram, including the area, thickness, volume, confluence, and the number of cells (Carl et al. 2004; Chalut et al. 2012; Ferraro et al. 2005; Kemper et al.
2006; Lenart et al. 2008; Mann et al. 2005). Traditional fluorescence and light
microscopy may cause phototoxicity, and therefore researchers have attempted
to develop non-damaging microscopy methods (Frigault et al. 2009; Hoebe et
al. 2007). As only very low light intensity is needed, the DH technique is a
non-destructive and non-phototoxic method (Logg et al. 2009) allowing for both
qualitative and quantitative measurements of living cells (Yu et al. 2009).
DH microscopy has been used to study different cell types e.g. protozoa, bacte-ria, and plant cells. Mammalian cells such as nerve cells, stem cells, various tumor cells, bacterial-cell interactions, red blood cells, and sperm cells have also
been investigated (Alm et al. 2013). The first DH microscopy images showing
living cells were published in 2003, making this a rather new research field (Yu
27 Using DH for counting the number of cells and estimating the confluence di-rectly in the culture vessels is very useful. Moreover, cell viability status can be
determined using DH microscopy (Kemmler et al. 2007). One large benefit of
DH is the ability to differentiate between viable and non-viable cells without any laborious and time-consuming staining or labelling of the cells with com-mon dyes, such as trypan blue or propidium iodide (Khmaladze et al. 2012; Mölder et al. 2008).
DH microscopy can be compared to other techniques such as electronic cell sizing and atomic force microscopy for detection of differences of volumes in cell death induced human epithelial cells. The different methods give compara-ble results, but DH was shown to be advantageous due to noninvasive labeling, the time resolution, and allowing measurements of both single cells and popu-lations (Khmaladze et al. 2012).
Several studies have demonstrated changes in cell volume for cell death analysis using DH. The interest for analyzing cell volume changes with DH microscopy, resulting from cytotoxic events or apoptosis treatment has recently increased in popularity (Alm et al. 2013; Kühn et al. 2013; Pavillon et al. 2012; Trulsson et
al. 2011; Wang et al. 2013). When cells go in to early apoptosis, the first
dis-cernable indication is a decrease of the cell phase shift. Pavillion et al. recognized
Figure 8. Schematic view of the DH microscopy technique (www.phiab.se).
28
early apoptotic cells within minutes by their DH phase signal, while it took several hours to identify dead cells using trypan blue staining.
Cell cycle control plays an essential role in cell differentiation and proliferation. Several proteins, mainly cyclins and cyclin dependent kinases (CDKs) in the
checkpoints of the cell cycle stringently control cell proliferation. (Coleman et
al. 2004). Mutations in regulating proteins such as cyclins and CDKs result in
uncontrolled cell proliferation leading to development of cancer (Malumbres & Barbacid 2001). DH can identify specific changes in cell volume that correlate to either G1 or G2/M arrest. Average cell volume changes in response to treat-ment with cell cycle arresting compounds could therefore be used as a DH marker for monitoring cycle arrest in cultured cells. Interestingly, the results showed comparable accuracy to flow cytometry measurement of cell cycle phase distribution (Miniotis et al. 2014).
DH can recognize small morphological changes between different cell types,
treated with the same cytotoxic drugs. Alm et al. have presented results from
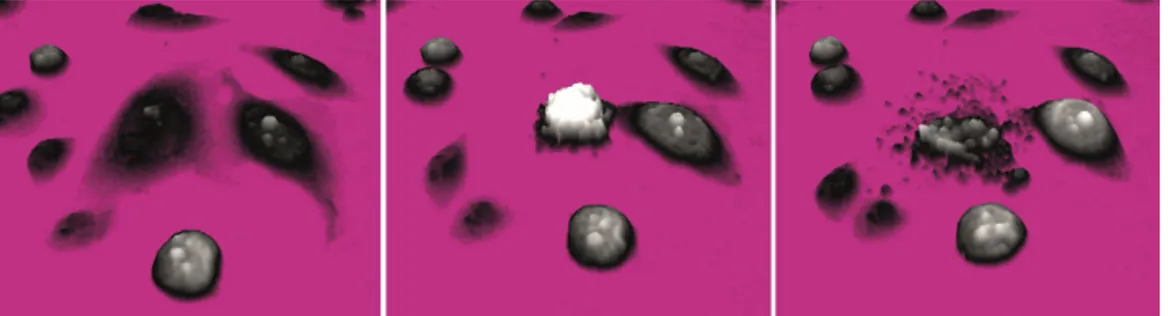
individual cells where a prostate cancer cell line and a mouse fibroblast cell line were treated with a cell death inducing drug. The prostate cancer cell line con-tracted, became dense and rounded up over time and the cell fragmented (Figure 9). The mouse fibroblast cell line behaved very differently, with some cells start-ing to die within one hour and others after several hours after treatment; the
cells became thinner and thinner and eventually disappeared, i.e., necrosis (Alm
et al. 2013). In addition, Colomb et al showed details of the apoptotic process, where the apoptotic blebbing in prostate cells was clearly visualized by DH
mi-croscopy (Colomb et al. 2008).
DH microscopy is mainly used for adherent cells. Suspension cells are difficult to analyze using DH microscopy since they are floating at several different levels in the medium. To facilitate DH microscopy analysis of death-induced
suspen-sion cells, we have introduced antibody-based microarrays (Wingren et al.
2009) to the experimental DH set-up. By using single-chain variable antibody fragments (scFv), (Borrebaeck & Wingren 2011) directed against some of the most common cell membrane proteins on T- and B-lymphocytes, suspension cells can be analyzed.
29 Antibody microarrays are used today for multiple screening of biomarkers in
different diseases (Wingren et al. 2009). Recombinant antibody microarrays
have been developed for cell surface membrane proteomics for
immunopheno-typing by using different scFv (Dexlin et al. 2007) and they were tested to work
well in microarray applications (Dexlin‐Mellby et al. 2010; Dexlin‐Mellby et al.
2011). Stybayeva et al used CD4/CD8 antibody specific microarrays combined with two-dimensional lensfree holographic imaging by first capture the cells on CD4/CD8 scFv coated slides and then detecting the cytokine signals by cytokine
immunoassay (Stybayeva et al. 2010).
Antibody-based microarray techniques have been used to determine phenotypic protein expression profiles for human B cell sub-populations (Ellmark et al.
2008). Antibody-based microarrays have also been used to detect soluble
anti-gens (Belov et al. 2006). Antibody-based microarrays enable screening of live
suspension cells for the expression of large numbers of cell surface CD antigens. Such profiling classify the CD antigens for leukemia classification and drug
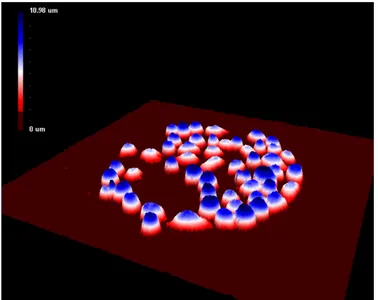
tar-get identification (Barber et al. 2009; Kohnke et al. 2009). Figure 10 is a 3D
hologram image showing captured cells on an antibody microarray.
DH microscopy makes it possible to analyze cells without affecting them in any way. The unique measurable parameters are the cell number, cell area, thick-ness, and volume, which can be coupled to proliferation, migration, viability and cell death. Cell morphology parameters can be very useful when following the effects of different treatments, the process of cell viability, as well as growth and cell death. The technique is cheap, fast and simple to use and have unique
Figure 9. 3D holographic images showing a dying cancer cell (www.phiab.se).
30
imaging capabilities for time-lapse investigations both on the single cell- and the cell-population levels.
Figure 10. Antibody-based microarray combined with DH microscopy. Jurkat cells captured on an-tibody Lewis X (El-Schich Z.).
32
AIMS OF THE THESIS
Paper I
To study SHP-1 expression and activity in chronic lymphocytic leukemia pa-tients using matched lymph nodes and peripheral blood samples.
Paper II
To analyze sialic acid expression on leukemic cells by using sialic acid molecular imprinted polymerase.
Paper III
To investigate whether death-induced cancer cells can be distinguished from untreated cells by the use of digital holographic microscopy.
Paper IV
To develop digital holography for cell death analysis of suspension cells by com-bining digital holographic microscopy with antibody-based microarrays.
33
METHODS
Patient samples
(Paper I)
Mononuclear cells from patients diagnosed with CLL from PB and LN were isolated by Ficoll gradient centrifugation. CLL cells were purified by negative selection with B-CLL cell isolation kit (Miltenyi Biotec). The purity of the se-lected B-CLL cells were approximately 97% as assessed by flow cytometry using CD5/CD19 antibodies. The selected CLL PB cells were cultured and BCR stim-ulated with anti-IgM (Thermo Fisher Scientific) for 10 minutes, 30 minutes or 48 hours or left unstimulated as a negative control. BCR stimulated and unstim-ulated cells were then used for flow cytometric analysis and Western blot anal-ysis as described below.
Ethics
(Paper I)
Informed consent was obtained from all CLL patients according to the Decla-ration of Helsinki, and ethical approval was granted by the ethical review com-mittee at Linköping University.
Cell lines
(Paper II-IV)
Several different cell lines were used depending on the topic of the investigation. In paper II, four human CLL cell lines were used. HG3, CI, Wa-osel and AIII were from the Department of Clinical and Experimental Medicine, Linköping, Sweden. The mouse fibroblast cell line L929 and the human prostate cancer cell line DU145 were obtained from The American Type Culture Collection (ATCC) and used in paper III. In paper IV, two selected cell lines were used: the human diffuse large B cell lymphoma cell line U2932 obtained from the Department of Oncology, Genetics and Pathology, Uppsala, Sweden, and the T cell acute lym-phoblastic leukemia cell line Jurkat, obtained from ATCC.
34
Quantitative PCR
(Paper I)
The RNA expression was evaluated using quantitative PCR (q-PCR). Total RNA was isolated from purified CLL cells from matched PB and LN patient samples using the Allprep DNA/RNA mini kit (Qiagen). The synthesis of cDNA was performed using the Verso cDNA kit (Thermo Fisher Scientific). The
mRNA expression levels for SHP-1 and Ki-67 were quantified using q-PCR
analysis with SYBR Green probes (Roche). The samples were analyzed and run on a Light Cycler 480 II real time PCR system (Roche) and normalized against
a reference gene (GAPDH).
Western blot analysis
(Paper I)
To determine the expression of SHP-1 and phosphorylated SHP-1, western blot analyses were performed. The selected CLL PB cells and cells from matched PB and LN were lysed at 4 °C in ice-cold lysis buffer supplemented with protease inhibitors (Roche) and phosphatase inhibitors. The cell lysates were collected and cleared by centrifugation at 15,000 g. All samples were normalized to en-sure equal loading. Protein extracts were denatured at 65 °C in sample buffer and, separated by SDS-PAGE (Bio-Rad). The separated proteins were trans-ferred to a PVDF membrane, and blocked overnight in Tris-buffered saline (TBS) containing 0.1 % Tween-20 and 5 % BSA. The membranes were incu-bated with the following antibodies: anti-SHP-1 (Santa Cruz), anti-phospho-SHP-1 Y536, phospho-anti-phospho-SHP-1 S591 (Abcam) or α-actin (Dako). After three washes with TBS containing 0.1 % Tween-20 and 5 % BSA, the membranes were incubated with HRP-conjugated secondary antibodies (Dako). Immuno-detection and quantification was performed on an enhanced chemiluminescence detection kit on a ChemiDocMP Imaging system (Bio-Rad).
Immunoprecipitation and protein tyrosine phosphatase assay
(Paper I)
In order to measure the activity of SHP-1, cell lysates of matched PB and LN cells were incubated with anti-SHP-1 antibody conjugated to agarose beads (R&D systems) and incubated for 3 hours with constant rotation. The beads were then washed two times with lysis buffer and once with reaction buffer. Tyrosine phosphatase substrate I was added and incubated for 30 minutes at 37°C with constant rotation. After incubation, the samples were transferred to
35 a microplate and the reaction was terminated by adding Malachite Green Rea-gent A and incubated for 10 minutes at room temperature (RT) and thereafter Malachite green reagent B was added and incubated for 20 minutes more at RT. The absorbance was measured at 620 nm using BIO-TEK® microplate reader and the results were compared with a phosphate standard.
Flow cytometry analysis
(Paper I-II)
To investigate the expression level of SHP-1, intracellular flow cytometric anal-ysis was performed (Paper I). The selected CLL cells from anti-IgM stimulated or unstimulated PB cells and cells from matched PB and LN samples, were fixed in 4% paraformaldehyde, permeabilized with 0,05% saponin, and incubated with anti-SHP1-PE (Santa Cruz). The cells were analyzed using an Accuri C6 Flow Cytometer (BD Biosciences).
The surface expression of SA was investigated by flow cytometry (Paper II). The cells were fixed with 4% formaldehyde and incubated with sonicated SA-MIP or left in 3 % methanol/water as a negative control. The cells were incubated at
37 ºC with 5% CO2, for 60 minutes. For analyzing the expression level of the
glycans, the cells were incubated with lectin-FITC or left unstained as a negative control and incubated in darkness on ice for 20 minutes. The cells were analyzed using flow cytometry.
Fluorescence microscopy
(Paper II)
To analyze the binding of SA on cancer cells, fluorescence microscopy was used. Cells were adhered to polylysine treated slides for two hours, at 37 ºC with 5%
CO2 at 100% humidity. After incubation, the cells were fixed with 4%
formal-dehyde and incubated with sonicated SA-MIP or left in 3 % methanol/water.
The cells were incubated at 37 ºC with 5% CO2, for 60 minutes. After
incuba-tion, the cells were washed and incubated with DAPI (Thermo Fisher Scientific) for 4 minutes at RT for nuclear staining. The cells were mounted with one drop of mounting medium reagent (Molecular probe) and analyzed using fluores-cence microscopy (EVO® LS 10, Carl Zeiss).
In order to analyze the expression level of the glycans, lectin-FITC was used. Cells were grown on polylysine treated slides for two hours, at 37 ºC with 5%
36
CO2 at 100% humidity. After incubation, the cells were fixed with 4%
formal-dehyde and incubated with lectin-FITC in PBS, or left unstained as a negative control. The cells were incubated at RT for 60 minutes. After incubation, the cells were washed and incubated with DAPI for 4 minutes at RT for nuclear staining. The cells were mounted with one drop of mounting medium reagent and analyzed using fluorescence microscopy.
Reagents
(Paper III-IV)
Etoposide was dissolved in dimethyl sulfoxide (DMSO, Sigma– Aldrich) to in-vestigate the cell death response. Etoposide was used at final concentrations of 1, 5 and 10 µM for up to 3 days (paper III). To obtain a cellular response (paper IV), etoposide was used at a final concentration of 500 µM for up to 16 hours.
Cell viability measurements
(Paper III)
To measure cell viability using DH microscopy, different concentrations of cells
were seeded into 25 cm2 flasks and allowed to adhere for 24 hours. The cells
were incubated further for 24, 48, 72 and 96 hours. Cell growth was monitored with DH microscopy and several images were captured from each sample over time and analyzed as described below.
In order to measure cell viability after etoposide treatment, cells were seeded into 96-well plates and allowed to adhere for 24 hours followed by etoposide treatment for 24, 48, 72 and 96 hours. MTS-assays were performed by adding MTS solution (Promega) to the wells and the cells were then incubated for 2
hours. The absorbance was measured at 490 nm using a BIO-TEK® microplate
reader. The MTS assay is a colorimetric method for sensitive quantification of viable cells and is based on reduction of the MTS solution by the cells, to gen-erate a colored product.
Antibody-based microarrays
(Paper IV)
For detection of captured cells, recombinant antibody arrays containing differ-ent surface scFv were immobilized on glass slides through passive adsorption. Suspension cell lines were left to bind for 30 minutes on the antibody-based microarrays. After the incubation, attached cells were washed and treated with
37 either etoposide, DMSO, or left untreated as a negative control. By using DH microscopy, morphologic changes due to cell death were captured and analyzed as described below.
DH microscopy analysis
(Paper III-IV)
To detect morphology changes of death-induced cells, DH microscopy was used. The cells were treated with etoposide and incubated for up to 3 days and each day DH microscopy images were acquired. Several images were captured from the samples over time and data of the cell number, confluence, cell volume, and cell area were obtained (paper III).
Time-lapse series were run for 16 hours (paper IV). Holographic imaging was performed every tenth minute for the same cell population. Image areas covered
with cells were then segmented using an automated computer algorithm
Hstu-dio, obtaining data of the cell number, confluence, area, volume, thickness,
ec-centricity and irregularity.
Statistical analysis
(Paper I and III)
Mean and standard deviation were calculated for statistical analysis in paper I and III. For the q-PCR results p-values were calculated. For the cell viability and cell death studies, at least 20 images per sample were captured from at least two independent experiments.
38
RESULTS AND DISCUSSION
BCR signaling suppressor SHP-1 is active in CLL lymph node and
pe-ripheral blood (Paper I)
SHP-1 expression and activity is downregulated or lost in several leukemias and
lymphomas (Amin et al. 2007; Khoury et al. 2004). This suggests that loss of
SHP-1 expression might be associated with both malignant transformation and
tumor cell aggressiveness (Kossev et al. 2001; Wu et al. 2003). In the present
study, we hypothesized that SHP-1 would be downregulated or inactivated in the proliferative center, the LN cells. Considering that SHP-1 is a key phospha-tase for suppression of BCR signaling, we analyzed the SHP-1 expression and function in CLL proliferative LN cells in comparison with the PB cells. We found that SHP-1 gene expression was decreased in 50% of patients in prolif-erating LN cells when compared to PB cells of the same patient. Interestingly,
the expression of the proliferative Ki-67 gene expression level in these patient
samples was higher in LN than in PB, indicating lower SHP-1 expression in more proliferative cells. However, differences in SHP-1 protein expression could not be detected in LN and PB.
Since higher proliferative activity was seen, we investigated the phosphatase ac-tivity of the BCR suppressor SHP-1. The results showed SHP-1 phosphorylation in PB and LN samples. However, no significant differences in SHP-1 phosphor-ylation comparing PB with LN could be observed. These results of SHP-1
pro-tein and SHP-1 gene downregulation in LNs in vivo may be part of a strategy
for anergy maintenance in CLL, or alternatively it may indicate loss of function
by mutation (Vollbrecht et al. 2015; Weibrecht et al. 2007). No changes of
SHP-1 phosphorylation after short time BCR stimulation (SHP-10 and 30 minutes) of PB cells could be seen, however we observed a significant downregulation of phos-phorylated SHP-1 in 48 hours BCR stimulated cells. This is in line with findings in B1 cells in which CD5-SHP-1 association continues upon BCR engagement. This limits the B cell response and B1 cells are retained in the anergic state (Sen
39
properties with B1 B cells, including CD5+ expression and the anergic condition
(Bergh et al. 2014; Rosén et al. 2012).
Different expression levels of glycans on leukemic cells - a novel
screening method with molecularly imprinted polymers (MIP)
targeting sialic acid (Paper II)
The SA expression level is known to be increased in metastatic cancer cells (Fer-reira et al. 2013; Seidenfaden et al. 2003), and hence, it is of importance to analyze and determine the SA expression. However, the task is challenging ow-ing to the limited availability of SA specific antibodies (Cho et al. 2014; Fujitani
et al. 2013). We have recently presented a novel method for specific detection
of SA using MIP-technology (Shinde et al. 2015). The aim of this study was to
perform an extended screening of SA expression by using SA-MIPs, including four different CLL cell lines, conveniently analyzed by flow cytometry and flu-orescence microscopy.
Our results showed that SA is expressed in the plasma membrane in all four CLL cell lines at different levels. A higher expression of SA in the more aggres-sive CLL cell lines was observed. HG3 and CI showed a higher expression com-pared to the cell lines Wa-osel and AIII. Lectin binding confirmed the results in the CLL cell lines, and HG3 and CI displayed increased lectin binding, com-pared to the cell lines Wa-osel and AIII. This is in line with the fact that the
aggressiveness of the cancer cells correlates with increasing SA levels (Cui et al.
2011; Wang et al. 2009). HG3 and CI have unmutated IGHV genes, which are
associated with high cell proliferation and a more aggressive form of CLL. This is in comparison to Wa-osel and AIII cells, which have mutated IGHV genes, a
signature for less aggressive CLL cells (Rosenwald et al. 2001).
In order to evaluate the SA-MIP binding to the plasma membrane of the CLL cell line HG3, cells were stained with SA-MIP or lectin-FITC and analyzed using fluorescence microscopy. Overall, the SA-MIP led to a plasma membrane stain-ing of the cells in a similar way as did the lectin.
These results showed that SA-MIP can be used as a plastic antibody for detec-tion of SA using both flow cytometry and fluorescence microscopy. We suggest that SA-MIPs can be used for screening of different circulating tumor cells of
40
various stages, including CLL cells. Further analysis of the SA expression should include primary CLL cells from patient samples.
Induction of morphological changes in death-induced cancer cells
monitored by holographic microscopy (Paper III)
DH microscopy is an approach for label-free non-invasive imaging of cultured
cells, in order to monitor growth, viability, and death (Kemper et al. 2010; Yu
et al. 2009). The aim of this study was to investigate whether death-induced cancer cells can be distinguished from untreated cells using DH microscopy. In the present study, we have investigated the morphological changes in two cell lines using DH microscopy. We used a strategy similar to a previous study,
aim-ing at countaim-ing cells (Mölder et al. 2008). L929 and DU145 cells were treated
with different concentrations of etoposide and incubated over time. This analy-sis was confirmed by a MTS assay.
The number of control cells increased over time, while for treated cells, the numbers of cells was unchanged over time for L929 and DU145. The confluence decreased for treated L929 cells compared to control cells that showed an in-creased confluence over time. While for treated DU145 cells, the confluence changed depending on the etoposide concentration and time points. However, treated L929 and DU145 cells showed increased cell area and cell volume com-pared to untreated cells. The hologram images showed morphological changes of etoposide treated L929 and DU145 cells over time compared to untreated cells. The morphological changes were both time and concentration dependent for both cell lines. At the highest concentration Etoposide induced cell death in both cell lines already after 24 hours.
With DH microscopy, small differences between the two cell lines were clarified. L929 showed a lower sensitivity for etoposide at the lowest concentrations, while for DU145 the confluence, cell area, and volume increased at first, and then decreased over time. Our results showed that untreated control cells could be distinguished from etoposide treated cells by determining cell number, con-fluence, and morphological changes such as cell area and cell volume. Indeed, the use of DH microscopy as a fast, automatic, and cost efficient evaluation tool for different cancer treatments was promising. We believe that DH microscopy is an important tool for personalized medicine investigations, determining the
41 optimal therapeutic concentration for both individual treatment and for differ-ent cancer types.
Interfacing antibody-based microarrays and digital holography
ena-bles label-free detection for loss of cell volume (Paper IV)
DH microscopy has mainly been used for adherent cells (Marquet et al. 2005).
Our previous results in paper III were based on adherent cells. Suspension cells are difficult to analyze using DH microscopy. The aim of this study was to de-velop DH microscopy for cell death analysis of suspension cells by combined analysis with antibody-based microarrays. Here, we have uniquely introduced
antibody-based microarrays (Wingren et al. 2009) to the experimental DH
set-up. The DH microscopy combined with recombinant antibody microarrays pro-vides a totally new capability regarding specific capture of suspension cells. In the present study, we have used DH microscopy for analyzing the cell area, thickness, and volume to evaluate the cell death progression in suspension cell lines.
To investigate the cellular responsiveness, Jurkat and U2932 cells were treated with either etoposide or DMSO and holograms were collected over time. Data for cell number, cell area, cell thickness, cell volume, cell eccentricity, and cell irregularity were collected for both cell types. Untreated Jurkat and U2932 cells showed stable cell numbers over time and the two cell lines showed cell-specific results of cell area and cell irregularity after treatment. The cell volume could be analyzed in cells treated for up to 16 hours, showing a decrease in both cell lines, whereas the volume of untreated cells was unchanged. Interestingly, the U2932 cells showed a slightly different pattern compared with the Jurkat cells. The mean cell area for the U2932 cells was slightly smaller compared with the area of the Jurkat cells. Taken together, we have for the first time shown that that DH microscopy in combination with antibody-based microarrays can be used to analyze treated nonadherent leukemia cells in real time.
Our results provide support for using the concept of DH microscopy combined with antibody-based microarray technology as a novel method for detecting morphological changes in specifically captured death induced cells. Develop-ment of fast and accurate evaluation tools for cancer treatDevelop-ments will be of great value to clinicians in deciding the most appropriate treatment for patients.
42
CONCLUDING REMARKS
The main finding in this thesis are as follows:
Paper I
• 50% of the patient samples showed high SHP-1 gene expression in PB
compared to LN and low Ki-67 gene expression in PB compared to LN.
• No significant differences in SHP-1 protein expression and SHP-1
phos-phatase activity were observed in PB compared to LN.
• We suggest that absence of SHP-1 protein and gene downregulation or
activation in proliferative centers/LNs in vivo may be part of a strategy
for anergy maintenance in CLL, or alternatively it may indicate loss of function.
• A limitation of our study is the low number of available matched LN
and PB patient samples. Additional patients are required to elucidate the importance of SHP-1 in CLL pathogenesis.
Paper II
• SA-MIP have high specificity and affinity for SA and can be used as a
plastic antibody for detection of SA using both flow cytometry and flu-orescence microscopy.
• SA is differentially expressed in CLL cell lines and the expression is
cor-related to the aggressiveness.
Paper III
• DH microscopy is an excellent tool for cell-death analysis, where
43
Paper IV
• The analyzed treated cells showed a decrease in volume, whereas the
volume of untreated cells was unchanged.
• Our results offer support for using the concept of DH microscopy
com-bined with antibody-based microarray technology as a novel method for detecting morphological changes in specifically captured death in-duced cells.
Taken together, this thesis takes cancer research one step further, which could lead to a more individualized treatment for patients and for screening of circu-lating cancer cells and metastasizing cancer cells in the body.
44
POPULÄRVETENSKAPLIG
SAMMANFATTNING
Cancer är en ledande dödsorsak i världen och är ett samlingsnamn på många olika sjukdomar. Cancer utlöses av att DNA i en cell muteras. Mutationen kan påverka gener som kodar för specifika proteiner, vilka kontrollerar cellen. Cel-len blir då okontrollerbar och vissa cancerformer kan metastaseras till andra organ i kroppen. Cancerceller kännetecknas av förmågan att undvika apoptos, det vill säga programmerad celldöd. Apoptos karakteriseras av en mängd olika cellulära morfologiska förändringar. I normala celler är celldöd och celldelning strikt kontrollerat via olika signaleringsvägar, där olika proteiner aktiveras eller inaktiveras beroende på vilken signal cellen får.
I Sverige insjuknar ca 400 människor i kronisk lymfatisk leukemi (KLL) varje år och medianåldern för diagnos är 72 år. KLL påverkar celler i kroppen. B-celler producerar antikroppar, vilka angriper främmande organismer som en del av immunförsvaret. KLL cancerceller växer långsamt, vilket gör att de inte alltid slås ut av kemoterapeutiska läkemedel.
Avhandlingen har framför allt fokuserat på biomarkörer och teknikutveckling i cancerforskning för en bättre diagnos och en framtida individuell patientbe-handling. Syftet med studie I var att analysera olika signaleringsvägar i KLL som kan förhindra celltillväxten. Vi har analyserat ett protein som heter SHP-1 och som visar högt uttryck i KLL-celler. SHP-1 är en signalmolekyl och har sin normala funktion i cellulära processer, inklusive celltillväxt och differentiering. Vår hypotes är att SHP-1 är högre uttryckt i perifert blod och därmed förhind-rar tillväxten av KLL celler, jämfört med lymfknutan. Resultatet visar att hälf-ten av de analyserade patientproverna uttryckte högre SHP-1 i perifert blod jämfört med lymfknutan. Dock kunde vi inte se någon skillnad mellan SHP-1 aktivitet i perifert blod och lymfknutan.
Det är en utmaning för forskare att finna optimal behandling av cancer. Ofta är det svårt att diagnostisera cancer i ett tidigt stadium. Strävan att finna effektiv
45 teknik och nya biomarkörer för att upptäcka cancer i ett tidigt stadium har varit fokus för forskare i flera år. I studie II har vi undersökt sialinsyra som finns på cellytan. Sialinsyra, som är en del av kolhydratstrukturer, är känd för att vara högt uttryckt i cancerceller och ännu högre i metastaserande celler. Sialinsyra är svår att mäta för att det är svårt att producera antikroppar mot
kolhydrat-strukturer. Syftet med arbete II var att mäta sialinsyra på cancerceller genom att
använda teknologin molekylärt präglade polymerer, MIP. Med hjälp av MIP som binder till sialinsyra har vi lyckats mäta och klassificera sialinsyra i aggres-siva KLL-celler jämfört med andra mindre aggresaggres-siva KLL-celler. Framtida MIP forskning kan leda till tidig diagnos av cirkulerande cancer celler.
Digital holografi (DH) mikroskopi är ett mikroskop med en inbyggd laser som kan analysera levande celler direkt i odlingskärlen. Man får en 3D-bild av cel-lerna och uppgifter om olika morfologiska mätvärden som antal celler, celltät-het, area, volym och tjocklek av cellerna i odlingskärlet. Syftet med studie III var att analysera celldöd med hjälp av DH-mikroskopi på behandlade celler. Vi har behandlat två cellinjer med kemoterapeutiska läkemedel och analyserat dem med DH-mikroskopi under flera dagar. Resultaten visar typiska apoptoskarak-tärer där volymen, arean och tjockleken minskar och cellerna krymper ihop. Vi har kunnat mäta specifika skillnader mellan cellinjerna som resultat av kemo-terapirespons. Framtida forskningsområden kan inkludera patientprover där man snabbt och enkelt kan testa olika behandlingar med DH, för att sedan välja den behandling som patienten svarade bäst på. Detta innebär en möjlighet att skräddarsy cancerbehandling för den enskilde patienten.
DH-mikroskopi har främst använts för celler som växer på ytan i botten av odlingskärl. Det har varit en utmaning att analysera leukemiceller med DH-mikroskopi eftersom leukemiceller flyter runt, vilket gör det svårt att analysera. Syftet med studie IV var att mäta celldöd av leukemiceller med hjälp av DH-mikroskopi kombinerad med en antikroppsbaserad analys. Vi har först fångat upp cellerna med specifika antikroppar som är bundna på en yta och sedan behandlat cellerna med kemoterapi och analyserat med DH-mikroskopi. Resul-tatet visade att cellerna band specifikt till antikropparna och satt bundna där under hela analysen. Behandlingen med kemoterapi visade typiska apoptos-karaktärer där cellvolymen, arean och tjockleken minskade. Här kunde vi också konstatera olikheter i cellrespons hos de två olika cellinjerna. Det bekräftar våra resultat där behandlingsrespons kan användas för bättre individuell patientbe-handling.
46
Sammanfattningsvis tar denna avhandling ett steg längre inom cancerforsk-ningen, vilket skulle kunna leda till en mer individualiserad behandling för pa-tienter och för diagnos av cirkulerande och metastaserande cancerceller i krop-pen.
47
ACKNOWLEDGMENTS
Jag vill tacka alla som har varit involverade i min avhandling och speciellt tack till min huvudhandledare AnetteAnetteAnetteAnette, för att ha introducerat mig till forskningsvärl-den redan 2007, och gett mig möjligheten att doktorera på Malmö Högskola. Tack för att du alltid har brytt dig och gett mig all den tid jag behövde. Framför allt tack för ditt tålamod, din vänlighet och omtanke.
Jag vill rikta ett stort tack till mina handledare GunillaGunillaGunillaGunilla och LarsLarsLarsLars för våra veten-skapliga diskussioner och för ert stora intresse för mina projekt. Lars Lars Lars Lars tack för all hjälp med q-PCR och för att du alltid har varit positiv och uppmuntrat mig. Tack HåkanHåkanHåkan för att du har varit en utmärkt examinator. Tack ZoltanHåkan ZoltanZoltanZoltan för språk-granskning.
Tack till alla medförfattare på arbetena, det hade inte gått utan er! Anders
AndersAnders
Anders och AnnAnnAnn----CharlotteAnnCharlotteCharlotteCharlotte tack för ett bra samarbete. Börje Börje Börje Börje och Sudhirkumar Sudhirkumar Sudhirkumar Sudhirkumar tack för era diskussioner och ert positiva sätt att se på saker. Nishtman Nishtman Nishtman tack för Nishtman all mikroskoperingstiden, och framför allt tack för att du alltid fanns när jag behövde dig. Stort tack till KerstiKerstiKerstiKersti och BirgitBirgitBirgitBirgit från Phase Holographic Imaging
för hjälpen med DH mikroskopet och supporten under alla dessa år.
Jag vill tacka alla doktorander som har funnits under min resas gång. De som har slutat AntonAntonAntonAnton, CathrineCathrineCathrineCathrine, MagnusMagnus, YanaMagnusMagnus YanaYanaYana, PeterPeterPeterPeter, MarkMarkMarkMark och de som är efter Celina,
Celina, Celina,
Celina, DimitriDimitriDimitriDimitri, Elena, Olga,Elena, Olga,Elena, Olga,Elena, Olga, och Sing Sing Sing Sing lycka till med er avhandling. Monzer
MonzerMonzer
Monzer tack för din hjälp med allt tekniskt, tack för din uppmuntran och din vänlighet. Utan dig hade inget gått! Tack VedrVedrVedran Vedran an an för din hjälp med det tekniska. Maria
Maria Maria
Maria jag är glad att jag fick lära känna dig, tack för all den tid och lycka till med ditt nya jobb.
Ett särskilt tack till mina kära gymnasievänner AnnaAnnaAnnaAnna, Hina, Khoan, Nazira Hina, Khoan, Nazira Hina, Khoan, Nazira och Hina, Khoan, Nazira Rachelle
RachelleRachelle
Rachelle, tack för att ni är så underbara. Tack för att ni alltid påminner mig om andra roliga saker i livet än jobb. Min bästa vän Falastin, Falastin, Falastin, Falastin, varje gång vi träffas
48
rusar tiden iväg och vi hinner aldrig prata färdigt. Tack för allt och lycka till med din avhandling!
Ett stort tack till mina underbara systrar AmalAmalAmalAmal, SafahSafahSafah och WafaaSafah WafaaWafaaWafaa, tack för att ni alltid finns när jag behöver er ♥ och för att ni alltid bryr er om mig. Mo-Mo-Mo- Mo-hammed
hammedhammed
hammed, AhmedAhmedAhmedAhmed och OmarOmarOmarOmar tack för allt, ni är de bästa bröder man kan önska sig! MammaMammaMammaMamma och pappapappapappapappa jag kan nog inte tacka er tillräckligt men tack för att ni får mig alltid att känna att jag klarar allt och att ni är alltid stolta över mig hur det än går. Tack för er hjälp och stöd!
Allra mest vill jag tacka min Alaeddin, Alaeddin, Alaeddin, tack för att du alltid har trott på mig, Alaeddin, stöttat mig, uppmuntrat och hjälpt mig. Tack för att du är alltid så snäll och så underbar. LeithLeithLeith och JasminLeith JasminJasminJasmin mina älsklingar, ni betyder allt för mig!
49
REFERENCES
Adamczyk, Barbara, Tharmalingam, Tharmala & Rudd, Pauline M. (2012). Glycans as
can-cer biomarkers. Biochimica Et Biophysica Acta (BBA)-General Subjects, vol. 1820 nr. 9 s.
1347-1353.
Alexander, Cameron, Andersson, Håkan S., Andersson, Lars I., Ansell, Richard J., Kirsch, Nicole, Nicholls, Ian A. et al (2006). Molecular imprinting science and technology: a
sur-vey of the literature for the years up to and including 2003. Journal of Molecular
Recog-nition, vol. 19 nr. 2 s. 106-180.
Alibek, K., Irving, S., Sautbayeva, Z., Kakpenova, A., Bekmurzayeva, A., Baiken, Y. et al (2014). Disruption of Bcl-2 and Bcl-xL by viral proteins as a possible cause of cancer.
Infectious Agents and Cancer, vol. 9s. 44-9378-9-44. eCollection 2014.
Alm, Kersti, Cirenajwis, Helena, Gisselsson, Lennart, Gjörloff Wingren, Anette, Janicke, Bir-git, Mölder, Anna et al (2011). Digital Holography and Cell Studies. Holography, Re-search and Technologies. (Rosen, Joseph uppl.). Rijeka, Croatia: In Tech. (s. 237-252) Alm, Kersti, El-Schich, Zahra, Miniotis, Maria F., Wingren, Anette G., Janicke, Birgit &
Oredsson, Stina (2013). Cells and Holograms–Holograms and Digital Holographic Mi-croscopy as a Tool to Study the Morphology of Living Cells.
Alonso, Andres, Sasin, Joanna, Bottini, Nunzio, Friedberg, Ilan, Friedberg, Iddo, Osterman,
Andrei et al (2004). Protein tyrosine phosphatases in the human genome. Cell, vol. 117
nr. 6 s. 699-711.
Amin, HM, Hoshino, K., Yang, H., Lin, Q., Lai, R. & Garcia‐Manero, G. (2007). Decreased expression level of SH2 domain‐containing protein tyrosine phosphatase‐1 (Shp1) is
asso-ciated with progression of chronic myeloid leukaemia. The Journal of Pathology, vol. 212
nr. 4 s. 402-410.
Apollonio, B., Scielzo, C., Bertilaccio, M. T., Ten Hacken, E., Scarfo, L., Ranghetti, P. et al
(2013). Targeting B-cell anergy in chronic lymphocytic leukemia. Blood, vol. 121 nr. 19
s. 3879-88, S1-8.
Ashkenazi, Avi (2015). Targeting the extrinsic apoptotic pathway in cancer: Lessons learned and future directions. Journal of Clinical Investigation, vol. 125 nr. 2 s. 487.
Ashkenazi, Avi & Salvesen, Guy (2014). Regulated cell death: signaling and mechanisms.
Annual Review of Cell and Developmental Biology, vol. 30s. 337-356.
Baig, S., Seevasant, I., Mohamad, J., Mukheem, A., Huri, HZ & Kamarul, T. (2016). Poten-tial of apoptotic pathway-targeted cancer therapeutic research: Where do we stand&quest.