Research Article
Trueness and Precision of Three-Dimensional Digitizing
Intraoral Devices
Hussam Mutwalli ,
1Michael Braian,
1Deyar Mahmood ,
1and Christel Larsson
21Department of Prosthodontics, Faculty of Odontology, Malm¨o University, Smedjegatan 16, 214 21 Malm¨o, Sweden 2Department of Materials Science and Technology, Faculty of Odontology, Malm¨o University, Smedjegatan 16,
214 21 Malm¨o, Sweden
Correspondence should be addressed to Hussam Mutwalli; dr.mutwalli@gmail.com
Received 13 June 2018; Revised 25 September 2018; Accepted 30 October 2018; Published 26 November 2018 Guest Editor: Vahid Rakhshan
Copyright © 2018 Hussam Mutwalli et al. This is an open access article distributed under the Creative Commons Attribution License, which permits unrestricted use, distribution, and reproduction in any medium, provided the original work is properly cited.
Aim. To measure the trueness and precision under repeatable conditions for different intraoral scanners (IOSs) when scanning
fully edentulous arch with multiple implants. Materials and Methods. Three IOSs and one industrial scanner were used to scan one edentulous master cast containing five implant scan bodies and three spheres. The cast was scanned thirty times with each scanner device. All scans were analyzed in the inspect software, and three-dimensional locations of the implants and the interarch distance between the spheres were measured. The values were compared to measurements made with one coordinate measuring machine (true value). One-way ANOVA was used to calculate the differences between IOSs and in comparison with the true value. Results. Significant differences were found between all IOSs. For the implant measurements, Trios 3 had the lowest trueness (≤114 μm), followed by Trios 3 mono (≤63 μm) and Itero element (≤−41 μm). Trios had the lowest precision (≤135 μm), followed by Itero element (≤101 μm) and Trios 3 mono (≤100 μm). With regard to the interarch distance measurements, Trios 3 had the lowest trueness (≤68 μm), followed by Trios 3 mono (≤45 μm) and Itero element (≤40 μm). Trios 3 had the lowest precision (≤206 μm), followed by Itero element (≤124 μm) and Trios 3 mono (≤111 μm). Conclusion. The results from this in vitro study suggest that precision is low for the tested IOS devices when scanning fully edentulous arches with multiple implants.
1. Introduction
One of the most recent techniques introduced to dentistry is the ability to digitize the oral cavity and create a three-dimensional virtual model; this device is known as an intraoral scanner (IOS). The first appearance of the IOS was in 1980. Few years later, a Swiss dentist and an Italian electrical engineer developed and introduced CEREC by Sirona Dental Systems in 1987 [1]. Over the past few years, several commercial IOS systems have been introduced to the market. Preferably, the IOS device should have high trueness and high precision. Both trueness and precision describe the accuracy of the specific digital device (ISO 12836:2015) [2]. High trueness means that the device provides a result that is close to or equal to the true dimension of the object being scanned. A device with higher precision has more repeatable
and consistent scans or measurements. This is however not always achieved in all scanners at all clinical conditions. Several studies have shown that IOS devices have difficulty in scanning full dental arch or edentulous arch with multiple implants and generating accurate virtual models [3–8]. The sources that could generate errors are scanning software process, oral environment, scanning protocol, and user’s experience. The main reason for enhanced errors on longer span scans could be the scanning method found in most IOS devices. The scanners acquire single images that are stitched with other images to produce a virtual 3D model of the object being scanned. The technique is referred to as stitching; software process known as the best fit algorithm, can introduce errors into large scan distance such as the full-arch situation [6, 9, 10]. To achieve a proper stitching, the scanned object needs a suitable structure. Typically, occlusal
Volume 2018, Article ID 5189761, 10 pages https://doi.org/10.1155/2018/5189761
surfaces on molars and premolars present structures with many anatomical geometries making these areas simpler to stitch compared to edentulous areas or the incisal edge of the mandibular front teeth [11]. The oral environment contains saliva, blood, and artificial reflective surfaces in the oral cavity that can introduce errors during the digitizing process [12]. The scanning protocol refers to the scanning path for digitizing the object. A study reported that an accurate scanning strategy minimizes the inaccuracies in the digital fabrication workflow and creates precise virtual 3D datasets [13]. Therefore, it is crucial to apply the right scanning path in order to obtain a usable virtual 3D model [14]. In addition to the scanning protocol, the learning curve or user’s scanning skill has an impact on generating accurate virtual models. Studies report that experienced operators can perform better scans than nonexperienced operators [9, 10]. After scanning, restorations are designed in computer-aided software and then milled or additively manufactured from materials ranging from polymers to monolithic ceramics. In order to control errors in this digital workflow, it is im-portant to study each process in the production.
The current study focused on assessing the trueness and precision of three different intraoral scanners on the scanning edentulous jaw with multiple implants. Two terms are central to understanding metrology: accuracy and precision. Accuracy relates to the closeness of a mea-sured value to a standard or a known (true) value, whereas precision pertains to the closeness of measured values to each other. Figure 1 illustrates the correlation between these two terms; if the center of the target would be referred to as the true value or the standard, then Figure 1(a) shows a result that has both low accuracy and precision. In contrast, Figure 1(d) illustrates results that are both ac-curate and precise. When conducting research, it is normal to calculate the standard deviation (SD) and the mean value of a measurement (mean). Relating these two terms to the metrological nomenclature would correlate the mean value as accuracy and the standard deviation to precision. The authors have utilized the recently updated recommenda-tion from the Internarecommenda-tional Organizarecommenda-tion for Standardi-zation (Dentistry—Digitizing devices for CAD/CAM systems for indirect dental restorations—Test methods for assessing accuracy, ISO 12836:2015) as reference for de-scribing the terms accuracy, trueness, and precision [2]. ISO 12836:2015 uses two terms to describe accuracy; the first is precision and the second is trueness. Trueness is closeness of agreement between the mean obtained from repeated measurements and a true value. If ISO 12836:2015 is used as reference, then all accuracy legends in Figure 1 would change to trueness, and Figure 1(d) would be regarded as accurate and Figure 1(a) as not accurate; meanwhile, Figure 1(b) would be described as having a low trueness; the shooter is precise but not accurate. Precision is the closeness between the independent results of mea-surement obtained under specific conditions. Precision is divided into two different groups: in the first group, the subject is tested in the same way by the same operator and measuring equipment under the same conditions. This first version of precision tests repeatability. The first
version was tested in this current study. According to ISO, the measurement should be repeated thirty times under the same condition to assess the precision under re-peatable condition. The precision would be obtained by calculating the standard deviation of the thirty mea-surements. In the second version of precision, the con-ditions change. Thus, this part tests reproducibility.
Different methods have been developed by researchers to assess the trueness and precision of IOS devices. Some of these studies have either compared the IOS device to the conventional impression technique or to other IOS devices [6–8, 15, 16]. Almost all of the researchers employed a master cast that has been measured either by tactile computer metric measurements (CMM) or by using an industrial optical scanner to obtain reference data as a virtual 3D file. The master cast is then scanned by the test scanners, obtaining virtual models. The virtual models are measured and compared to the reference date. Some studies employed the best fit alignment method to assess full-arch scans with teeth or implants [4, 7, 8, 16]. The method presents a color map data with threshold colors to visualize and measure differences between two scans. The current study used a different method: here, five cylinders (scan bodies) and three spheres were used as landmarks, making it possible to calculate only eight points in the scan, instead of comparing thousands of points from the scan data. The aim of this present study was to measure the trueness and precision under repeatable condition of dif-ferent intraoral scanner devices on scanning a fully edentulous arch with multiple implants. The null hy-pothesis was that there would be no significant differences between the intraoral scanner devices in comparison with the true value (coordinate measuring machine).
(a) (b)
(c) (d)
Figure 1: Illustration of the correlation between accuracy and precision. (a) Low accuracy, low precision. (b) Low accuracy, high precision. (c) High accuracy, low precision. (d) High accuracy, high precision.
2. Materials and Methods
2.1. Master Model. A cast of an edentulous maxilla with five
implants (Br˚anemark system Mk IV TiUnite WP 5 × 10 mm). Five implant scan bodies (Elos Accurate Intraoral Br˚anemark WP 6A-C, Elos Medtech Pinol A/S, Gørløse, Denmark) were connected to the implants. The scan bodies were manufactured from polyether ether ketone (PEEK). The core structure of the model consisted of tungsten metal, and the edentulous areas were made by using dental stone material. The implants were placed in a nonparallel position in order to mimic the clinical situation. The implants were positioned in the area of the lateral incisor, canines, and second premolars, according to positions 1–5, as illustrated in Figure 2. Three spheres were used as fixed reference landmarks; the placement is shown in Figure 2.
2.2. Coordinate Measuring Machine (CMM). The master
model was measured by a certified metrologic center (Elos Medtech Pinol A/S, Gørløse, Denmark) to obtain three-dimensional data of the master model components (Fig-ure 3). A certified industrial coordinate measuring ma-chine, CMM (Carl Zeiss Industrielle Messtechnik GmbH) was used with its corresponding software (Calypso 2015, Service Pack 3, Version 6.0.12). The master model was measured one time with the CMM using a high touch signal probe with a 1 mm ruby sphere (in three dimensions: x, y, and z axes). The accuracy of the CMM was certified by the national entity of accreditation with a maximum permis-sible error of length measurement of 1.9 ± 3 μm/1,000 μm according to the appropriate standard published by the International Organization for Standardization [17]. The circumference of each scan bodies was measured to define its center point in the x, y, and z axes. Furthermore, the interarch distance between the center of spheres was de-termined. The CMM measurement was regarded as a true value in the present study.
2.3. GOM Optical 3D Metrology. The master model was sent
to the manufacturer center (Kulzer GmbH Nordic AB, Helsingborg, Sweden) to scan the master model thirty times with an optical industrial blue light scanner (Atos core, GmbH Optical Metrology, Braunschweig, Germany) (Fig-ure 3). The system technology of this optical scanner is based on emitting different light fringe patterns onto the model, while the reflected lights are recorded by means of two high-resolution video cameras. Atos scanner was used in this study as a reference scanner for comparison with IOS devices.
2.4. Intraoral Scanner Systems. Three different IOS systems
were evaluated: Trios 3 and Trios 3 mono (3shape, Copenhagen, Denmark) and Itero (Align technology Inc., California, USA) (Table 1). The master model was scanned 30 times with each tested scanner device, resulting in 90 virtual 3D models in total (Figure 3). To reduce the risk of operator bias and different levels of operating experience
that could influence the results, it was decided that all scanning procedures would be made by one dentist who was experienced and familiar with the three IOS systems. The calibration of all IOS systems was performed according to the manufacturer’s recommendations in order to mimic the clinical situation.
2.4.1. Trios 3 Scanner. The Trios 3 scanner is based on
confocal microscopy technology. The system has color software, and powder application is not required. Trios 3 is cabled (pod). The master model was scanned 30 times on the same day with approximately 10 to 15 minutes between each scan. The scanning procedure started first from the buccal surface of the right sphere (sphere 3), moving along the buccal surface toward the left sphere (sphere 1), and returning from the occlusal-palatal side of sphere 1. This technique was called buccal, occlusal, and palatal scanning strategy (BOP).
2.4.2. Trios 3 Mono Scanner. Trios 3 mono has the same
features as Trios 3, except for its inability to register color. Trios 3 mono is cabled (pod). Trios 3 mono was utilized to repeatedly scan the master model 30 times on the same day with approximately 10 to 15 minutes between the scans. This was followed by a similar scanning strategy (BOP) to scan the master model.
2.4.3. Itero Element Scanner. The Itero element device is
a powder-free system with color scan features. The Itero technology is based on parallel confocal microscopy to capture several images per second. In order to evaluate the repeatability of the Itero device, the master model was scanned 30 times during the same session with approximately 10 to 15 minutes between each scan. The scanning strategy for the Itero group was performed by zigzag movement from sphere 3 to sphere 1 (buccal to occlusal to palatal), all in one direction and without returning to the starting point. This
Sphere 2 Sphere 3 Sphere 1 Implant 1 Implant 2 Implant 3 Implant 4 Implant 5 Stone material
strategy was chosen on account of fact that the Itero scanner tip is larger in width than the other dental scanner; therefore, it was almost impossible to scan the mesial and distal surface properly without rotating the camera tip.
2.5. Alignment and Measurement Procedures. A total of 120
scans were generated from the Atos and three IOS systems (30 virtual 3D models of the Atos and 30 virtual 3D models of each intraoral scanner). All 3D models were converted to standard tessellation language (STL) file format. Subsequently, each virtual 3D model was individually imported and measured once in a reverse engineering software program (GOM inspect software 2016, Rev. 95488). All scans were measured in the exact same way. The initial set after the virtual model had been imported into the software was the construction of the fitting element of the three spheres and then aligned the 3D model into the same x, y, and z CMM coordinate position (Figure 4(a)). Sphere 1 was used as anchorage or reference point. The linear distances between the center point of sphere 1 to sphere 2 (D1_D2), sphere 1 to sphere 3 (D1_D3), and sphere 2 to sphere 3 (D2_D3) were constructed and measured (Figure 4(b)). The distance between the spheres described the
interarch distance between the posterior right, left, and anterior quadrants of the 3D model.
In order to measure the position and direction of all implants to reference sphere 1, the center point of each implant was located. Figure 4(c) illustrates the construction of fitting cylinders and fitting planes. The best Gaussian fit was utilized as the fitting algorithm for the cylinders and planes. The center point of each implant was installed by constructing the intersecting point between cylinders and planes (Figure 4(d)). The center point of each implant was measured in the x, y, and z axes of the space. The z-axis represented the vertical direction of each implant. The x and y axes described the horizontal orientation of each implant.
2.6. Measurement Parameters. The measurement of each
virtual 3D model consisted of the five implant center points in the x, y, and z axes, and three linear distances between the center of the spheres. One virtual 3D model was divided into a total of 18 parameters. Each scanner system resulted in 540 parameters. In total, 2160 measurement parameters were a result from the Atos and the three dental scanner groups. All measurements of the 3D models were conducted by one operator.
Table 1: Information about the intraoral scanner systems.
System Manufacturer Software Scanning technology Scan protocol Acquisition Powder application Export
Trios 3 3shape 1.4.5.1 Conofocal microscopy BOP Video sequence No STL
Trios 3 mono 3shape 1.4.6.4 Conofocal microscopy BOP Video sequence No STL
Itero element Cadent Inc. 1.4.0.318 Conofocal microscopy Zig-zag Video sequence No STL
B � buccal; O � occlusal; P � palatal.
(1) Master model (3) Industrial scanner
(4) Intraoral scanners Itero Trios 3 mono 30 scans 30 scans 30 scans 30 scans Trios 3 (3) Coordinate measuring machine (CMM) 1 2 3 4 5
Figure 3: Study workflows. (1) Master model. (2) CMM measured the master model to obtain a true value. (3) Industrial Atos scanner digitized the master model 30 times. (4) Each intraoral scanner device (Trios 3, Trios 3 mono, and Itero) digitized the master model 30 times.
2.7. Datasets and Statistical Analysis. The measurement
datasets were exported to SPSS (IBM SPSS Statistics version 25) where calculations for mean, 95% confidence interval, standard deviation (precision) of all scanners, and the difference between the mean values of all scanners and the true value (trueness) were made. The Shapiro–Wilks test was used to examine the normal distribution. One-way ANOVA was carried out to test for the hypothesis (P < 0.05). Furthermore, the post hoc test using least significant difference (LSD) was carried out to identify difference in implants and interarch distance between two specific intraoral scanners at 0.05 significant level.
3. Results
In this study, normal distribution was found by Shapiro– Wilks test in all intraoral scanners except the Atos scanner. A summary of results of all measurements for precision, trueness, mean, and 95% confidence interval per group is presented in Tables 2–5 and Figure 5. The trueness displayed positive and negative values, depending on whether the mean for Trios 3, Trios 3 mono, Itero element, and Atos were above or below the true value.
3.1. Trueness of Dental Scanners and Atos Scanner
3.1.1. Trios 3. In the y-axis, Trios 3 showed least trueness
when compared to the CMM value at ≤114 μm. In the z-axis, it had the highest deviation when compared to the CMM dimension at ≤76 μm. In the x-axis, it showed a trueness of ≤45 μm. With regard to interarch distance, D1_3 showed the highest deviation in comparison with true dimension at 68 μm.
3.1.2. Trios 3 Mono. In the y-axis, Trios 3 mono showed an
overall trueness of ≤27 μm for all implants. In the z-axis, Trios 3 mono showed trueness when compared to the CMM dimension at ≤63 μm. In the x-axis, Trios 3 mono displayed trueness at ≤47 μm. The interarch measurements displayed an overall deviation of ≤45 μm.
3.1.3. Itero Element. In the y-axis, Itero presented trueness
at ≤−41 μm. In the z-axis, Itero showed an overall trueness of ≤25 μm for all implants when compared to the CMM value. In the x-axis, Itero displayed deviation at ≤37 μm.
(a) (b)
(c) (d)
Figure 4: Four different measurement procedures. (a) Construction of the spheres and alignment of 3D model in the same CMM coordinate position. (b) Linear distances in between the center of the spheres. (c) Construction of planes and cylinders for all implants. (d) Installation of the center points of all implants.
The interarch measurements displayed an overall deviation of ≤40 μm.
3.1.4. Atos Scanner. In the y-axis, it also showed highest
trueness at ≤−8 μm for all implants. In the z-axis, the Atos scanner displayed highest trueness at ≤3 μm for all implants when compared to the true value. In the x-axis, it had highest
trueness at ≤−2 μm. The interarch measurements for Atos showed highest trueness of ≤−3 μm.
3.2. Precision of Dental Scanners and Atos Scanner
3.2.1. Trios 3. In the x-axis, Trios 3 had lowest precisions of
≤135 μm and for the y-axis at ≤90 μm. In the z-axis, Trios 3 showed a precision of ≤61 μm. In the interarch measurements,
Table 2: Results of precision and trueness of all implants and interarch distances.
Parameters (mm) n Atos Trios 3 Trios 3 mono Itero elements
Precision Trueness Precision Trueness Precision Trueness Precision Trueness
Implant 1 X 30 0.009 −0.001 0.135 0.042 0.100 −0.009 0.101 0.037 Implant 1 Y 30 0.004 −0.004 0.073 0.079 0.023 0.016 0.038 −0.034 Implant 1 Z 30 0.002 0.000 0.047 0.063 0.025 −0.006 0.040 0.025 Implant 2 X 30 0.018 0.000 0.127 0.054 0.095 −0.014 0.083 0.032 Implant 2 Y 30 0.006 −0.004 0.094 0.095 0.027 0.018 0.044 −0.041 Implant 2 Z 30 0.002 0.000 0.035 0.076 0.024 −0.003 0.029 0.015 Implant 3 X 30 0.014 −0.001 0.133 −0.047 0.097 0.015 0.081 0.032 Implant 3 Y 30 0.014 −0.007 0.097 0.114 0.033 −0.025 0.041 −0.025 Implant 3 Z 30 0.007 0.002 0.033 0.046 0.019 −0.025 0.025 0.021 Implant 4 X 30 0.016 0.000 0.129 −0.029 0.082 0.015 0.075 0.028 Implant 4 Y 30 0.019 −0.003 0.077 0.066 0.029 −0.027 0.034 −0.007 Implant 4 Z 30 0.008 0.001 0.049 0.031 0.027 0.056 0.039 0.015 Implant 5 X 30 0.018 −0.002 0.099 −0.018 0.059 0.047 0.055 0.010 Implant 5 Y 30 0.014 −0.008 0.039 0.018 0.026 −0.025 0.026 −0.012 Implant 5 Z 30 0.018 0.003 0.063 0.035 0.028 0.063 0.033 0.025 D1_D2 30 0.005 −0.003 0.206 0.003 0.111 −0.034 0.124 0.040 D1_D3 30 0.011 −0.001 0.046 0.068 0.052 −0.017 0.028 −0.009 D2_D3 30 0.026 −0.002 0.061 0.014 0.022 0.045 0.040 −0.033
n � number of scans; mm � millimeter; n � number; D1_D2 � distance from sphere 1 to sphere 2; D1_D3 � distance from sphere 1 to sphere 3; D2_D3 �
distance from sphere 2 to sphere 3.
Table 3: Results of mean and 95% confidence interval for the mean of all implants and interarch distances.
Parameters
(mm) n
Atos Trios 3 Trios 3 Mono Itero elements
95% confidence interval for mean
95% confidence interval for mean
95% confidence interval for mean
95% confidence interval for mean
Mean Lower bound Upper bound Mean Lower bound Upper bound Mean Lower bound Upper bound Mean Lower bound Upper bound Implant 1 X 30 47.016 47.013 47.020 47.060 47.010 47.111 47.009 46.972 47.046 47.055 47.017 47.093 Implant 1 Y 30 19.870 19.869 19.872 19.953 19.926 19.980 19.891 19.882 19.899 19.840 19.826 19.854 Implant 1 Z 30 4.361 4.360 4.362 4.424 4.407 4.442 4.356 4.347 4.365 4.386 4.371 4.401 Implant 2 X 30 37.597 37.590 37.604 37.652 37.604 37.699 37.583 37.548 37.619 37.629 37.598 37.660 Implant 2 Y 30 31.030 31.028 31.032 31.129 31.093 31.164 31.052 31.042 31.063 30.993 30.977 31.009 Implant 2 Z 30 6.147 6.146 6.148 6.223 6.210 6.236 6.144 6.135 6.153 6.162 6.152 6.173 Implant 3 X 30 20.618 20.613 20.623 20.571 20.521 20.621 20.633 20.597 20.669 20.650 20.620 20.681 Implant 3 Y 30 35.667 35.662 35.672 35.788 35.752 35.824 35.649 35.637 35.661 35.649 35.634 35.664 Implant 3 Z 30 9.087 9.085 9.090 9.131 9.119 9.143 9.115 9.108 9.122 9.106 9.097 9.116 Implant 4 X 30 11.911 11.906 11.917 11.883 11.835 11.931 11.927 11.896 11.957 11.940 11.912 11.968 Implant 4 Y 30 30.751 30.743 30.758 30.820 30.791 30.849 30.727 30.716 30.738 30.747 30.734 30.759 Implant 4 Z 30 6.903 6.900 6.907 6.934 6.916 6.952 6.958 6.948 6.968 6.918 6.903 6.932 Implant 5 X 30 3.633 3.627 3.640 3.617 3.580 3.654 3.682 3.660 3.704 3.645 3.625 3.665 Implant 5 Y 30 18.106 18.101 18.112 18.133 18.118 18.147 18.090 18.080 18.099 18.103 18.093 18.113 Implant 5 Z 30 5.535 5.528 5.542 5.567 5.544 5.590 5.596 5.585 5.606 5.558 5.545 5.570 D1_D2 30 53.687 53.685 53.688 53.692 53.615 53.769 53.655 53.614 53.697 53.729 53.682 53.775 D1_D3 30 50.923 50.919 50.928 50.990 50.975 51.009 50.908 50.888 50.927 50.915 50.905 50.926 D2_D3 30 47.608 47.599 47.618 47.624 47.601 47.647 47.655 47.647 47.663 47.578 47.563 47.592
mm � millimeter; n � number; D1_D2 � distance from sphere 1 to sphere 2; D1_D3 � distance from sphere 1 to sphere 3; D2_D3 � distance from sphere 2 to sphere 3.
Trios 3 displayed a precision of 46 μm for D1_3 and 57 μm for D2_3, while D1_2 had a lowest precision of ≤206 μm.
3.2.2. Trios 3 Mono. In the z-axis, Trios 3 mono showed an
overall precision of ≤28 μm and for the y-axis ≤33 μm. However, x-axis showed a low precision of ≤100 μm. In the interarch measurements, Trios 3 mono displayed a precision
of 52 μm for D1_3 and 22 μm for D2_3. But, D1_2 presented a low precision of ≤111 μm.
3.2.3. Itero Element. In the z-axis, Itero showed an overall
precision of ≤40 μm and for the y-axis ≤44 μm. However, x-axis showed a low precision of ≤101 μm. In the interarch measurements, Itero displayed a precision of 28 μm for D1_3
Table 5: The result of post hoc test between the intraoral scanners in implants and interarch distances.
Trios 3 vs. mono Trios 3 vs. Itero
Mono vs. Itero Sig.
Sig. Sig. Implant 1 X 0.045 0.841 0.071 Implant 1 Y 0.000 0.000 0.000 Implant 1 Z 0.000 0.000 0.001 Implant 2 X 0.004 0.334 0.052 Implant 2 Y 0.000 0.000 0.000 Implant 2 Z 0.000 0.000 0.006 Implant 3 X 0.011 0.001 0.467 Implant 3 Y 0.000 0.000 0.991 Implant 3 Z 0.007 0.000 0.154 Implant 4 X 0.052 0.011 0.548 Implant 4 Y 0.000 0.000 0.096 Implant 4 Z 0.006 0.069 0.000 Implant 5 X 0.000 0.069 0.027 Implant 5 Y 0.000 0000 0.068 Implant 5 Z 0.005 0.364 0.000 D1_D2 0.282 0.29 0.034 D1_D3 0.000 0.000 0.439 D2_D3 0.003 0.000 0.000
D1_D2 � distance from sphere 1 to sphere 2; D1_D3 � distance from sphere 1 to sphere 3; D2_D3 � distance from sphere 2 to sphere 3; vs. � versus; mono � Trios 3 mono; Sig. � significant.
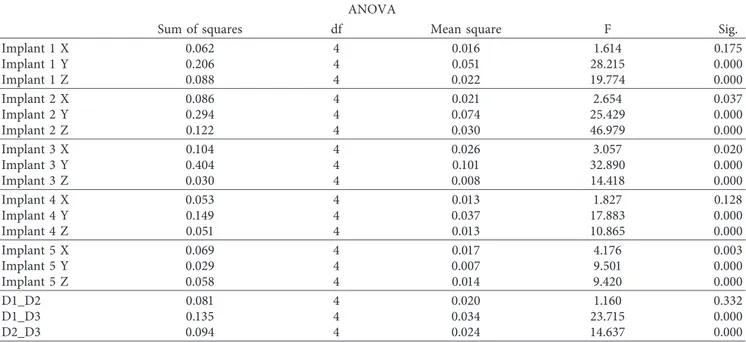
Table 4: The results of one-way ANOVA between all groups in comparison with the true value for implants and interarch distances. ANOVA
Sum of squares df Mean square F Sig.
Implant 1 X 0.062 4 0.016 1.614 0.175 Implant 1 Y 0.206 4 0.051 28.215 0.000 Implant 1 Z 0.088 4 0.022 19.774 0.000 Implant 2 X 0.086 4 0.021 2.654 0.037 Implant 2 Y 0.294 4 0.074 25.429 0.000 Implant 2 Z 0.122 4 0.030 46.979 0.000 Implant 3 X 0.104 4 0.026 3.057 0.020 Implant 3 Y 0.404 4 0.101 32.890 0.000 Implant 3 Z 0.030 4 0.008 14.418 0.000 Implant 4 X 0.053 4 0.013 1.827 0.128 Implant 4 Y 0.149 4 0.037 17.883 0.000 Implant 4 Z 0.051 4 0.013 10.865 0.000 Implant 5 X 0.069 4 0.017 4.176 0.003 Implant 5 Y 0.029 4 0.007 9.501 0.000 Implant 5 Z 0.058 4 0.014 9.420 0.000 D1_D2 0.081 4 0.020 1.160 0.332 D1_D3 0.135 4 0.034 23.715 0.000 D2_D3 0.094 4 0.024 14.637 0.000
D1_D2 � distance from sphere 1 to sphere 2; D1_D3 � distance from sphere 1 to sphere 3; D2_D3 � distance from sphere 2 to sphere 3; df � degree of freedom; F � analysis of variance; Sig. � significant.
and 40 μm for D2_3. On the other hand, D1_2 was had precision of ≤124 μm.
3.2.4. Atos Scanner. Atos scanner displayed a highest
pre-cision of ≤19 μm for all implant parameters. Atos had a precision of≤26 μm in all interarch measurements.
3.3. Results of Statistical Analysis between CMM, Atos, and the Dental Scanner Systems. According to the results of the
ANOVA, significant differences were found between the mean of all IOS devices and in comparison with the true value for all implant points and interarch distances, except for implant 1 x-axis (p 0.175), implant 4 x-axis (p 0.128), and D1_D2 (p 0.332). Table 5 displays the statistically significant difference in implants and interarch distances between two specific test groups.
4. Discussion
The aim of this study was to measure trueness and precision of different IOS systems when digitizing a fully edentulous cast with multiple implants. The results do not support the null hypothesis as statistically significant differences were found between the IOS devices in comparison with the true value. This in vitro study found variations in trueness and precision depending on the optical scanner systems uti-lized. On the basis of the x, y, and z parameters, Atos showed higher trueness and precision than all tested scanners. It would be preferable for the Atos system to be
utilized by dentists; however, if the same scanning tech-nology utilized by Atos was applied inside an intraoral device, the size of the hand-piece tip would be enormous and probably difficult to use intraorally. The authors of this study decided to use the Atos scanner as a reference scanner.
The material of the object surface being measured has an important influence on the scan result. The master model utilized in the current study consisted of stone material for the edentulous areas and tungsten metal for the implant positions (Figure 2). The stable metal part limits the movement or displacement of implant analogs in the master model to some extent and minimizes the risk of changes that could influence the results. However, the metallic parts could cause light reflective problems during the scanning process. Therefore, stone material was applied in the edentulous areas. The master model contained three spheres and five cylindrical scanning abutments, geometrical shapes that were used as fixed landmarks to assist the operator during scanning, making it possible to align and measure the virtual 3D model in a reliable way. In addition, the PEEK scanning abutment was selected because of its optical properties that produce good light dispersion.
The correlation between trueness and precision is a significant aspect in choosing a suitable IOS scanner for the intended application. The data that resulted from the current study on implant measurements for Trios 3 showed trueness data ≤114 μm and Trios 3 mono presented trueness data ≤63 μm. The same data from the Itero element showed trueness values ≤−41 μm. There is no consensus between
>100 5 4 3 2 1 CMM0 (µm) (µm) Trios 3 Itero Trios 3 mono Atos Trios 3 Itero Trios 3 mono Atos Trueness 50 30 20 80 >100 5 4 3 2 1 CMM0 Precision 50 30 20 80 Z Y X X X X X X X X X X Z Z Z Z Z Z Z Z Z Y Y Y Y Y Y Y Y Y
Figure5: Bull’s eyes chart showing the deviations between the mean of repeated measurements for all implant axes of all scanner devices and
the true values (trueness) and the deviations between the results of independent measurements obtained within one scanner device under specific condition (precision). This chart is color-coded; each color represents the implant number (1–5) in the master model. μm micron.
studies concerning the standard precision level for each intraoral scanner system. In this study, the reference Atos showed a precision of ≤19 μm in all implant dimensions. On the other hand, Trios 3 mono and Itero element presented precision of approximately <45 μm in the y and z direction, but the x-axis displayed low precision at ≤101 μm. Also, Trios 3 has the lowest precision of ≤135 μm in the x-axis. The precision of those IOS systems was not optimal enough to produce several virtual models that are closely comparable to each other in the x-axis. Thus, in the present study, the results from precision indicated that all tested IOS systems were not reliable enough for scanning fully edentulous arch with multiple implants.
The comparison of obtained values with the available literature is difficult; to our knowledge, there is no study using an identical measuring method to that of the present study. Some studies have utilized the best fit alignment method to assess direct digital impression of dentate arch or edentulous arch with multiple implants [4, 7, 8, 16]. The method refers to superimposing tested scans onto a reference scan of a physical model in different 3D software. The protocol can generate errors caused by alignment computing processes because of the deviations between the superimposed areas, especially in larger datasets such as full-arch scans [17, 18]. However, some studies have assessed accuracy of IOS devices by measuring only the horizontal linear distances between the reference landmarks [6, 9, 15, 19, 20]. The use of different IOS versions in the majority of the studies had an impact on the dissimilar results obtained. It can be assumed that the different materials and methods can lead to conflicting results in relation to the accuracy of IOS systems.
Intraoral scanners do not have the ability to scan the entire arch in one image. The small hand-piece unit has to move across the arch. The scanner’s software stitches the images of the arch and implant and combines one image after another image; this seems to induce errors. The clear effect of the stitching processes producing errors pro-portional to the scan distance, as noted in this study, has also been documented in other studies [6, 9, 10]. The results indicated that the errors were increased if the interarch distance between the spheres is horizontally enlarged or reduced in width. The data found from the current study on interarch measurements for Trios 3 showed lowest trueness among other groups, but all tested scanners had low pre-cision. Contradictory results can be found in the study that measured the trueness and precision of Trios (unclear version) and Itero (unknown version) on scanning dental arch [19]. Muallah and coworkers utilized five boreholes on their 3D printed master cast that were measured utilizing tactile CMM, and the cast was scanned thirty-two times per IOS device. Two of the boreholes replaced the first molars; the intermolar width (IMW) measurement in that study is similar to the interarch measurement D1_D2 in the current study. They found that Trios and Itero had better trueness and precision values. The difference in the results could be caused by different model materials, a different 3D analyzing program, a different software version of the scanners, and different reference landmark size and shapes. The most significant difference that led to better results in their study
was that the arch is not edentulous. It should be noted that the IOS software can cause poor stitching and matching procedure of the single point clouds during the scanning process of the edentulous area. By improving the matching algorithms, some IOS devices could attain digital impression of fully edentulous arches with multiple implants cases in the near future.
The accuracy of full-arch scan is correlated with the correct scanning strategy. Muller et al. [13] reported that the zigzag strategy has a lower trueness value but a better precision value than buccal-occlusal-palatal (BOP) strategy. In the present study, both Trios scanners used the BOP strategy and Itero element used the zigzag strategy to scan the master model. The results showed that the Itero element presented better trueness and precision outcomes than Trios 3, and statistically signifi-cant difference was found between them. However, Trios 3 mono and Itero element presented comparable results, with a statistically significant difference. Trios 3 mono has no color feature, which might explain why the scanning strategy played no significant role between the two different systems. It can be suggested that the color software collects information related to the color of the object being scanned during the scanning process. Subsequently, color software may interfere with the quality of the stitching process. Lastly, this study failed to account for saliva, soft tissue isolation, patient movement, and humidity in the oral environment. These patient variables may affect accuracy considerably in a clinical situation. The labo-ratory procedures after scanning also introduce errors that need to be considered.
No power calculation was performed in this study, which could be considered a limitation. The sample size was instead based on ISO standard 12836:2015 which states that, to test a digital device in terms of accuracy, trueness, and precision, the measurement has to be repeated 30 times, which is what was done in this paper [2]. Another limitation of this present study was that all tested scanner systems have similar scanning technology.
The findings in this study do not relate directly to the definitive prostheses. However, the level of model-less digital production tolerances for full-arch framework supported by teeth or implants is not clearly known yet. One of the most common treatment modalities is an implant-supported fixed full-arch framework. ¨Ortorp et al. [20] reported that the production tolerance for implant-supported fixed prostheses should be in the range of 20–100 μm tolerance. Comparison of their findings with this current study results should be done with consideration since the frameworks in their study were produced from scanning the implant master cast with a laboratory scanner. One good example is that the trueness of Trios 3 was ≤114 μm at y-axis with precision 135 μm at x-axis. This could generate a misfit between the components of the whole implant prosthesis, or it could produce unfit implant frameworks. A pilot clinical study investigated the digital impression of 25 patients with two implants in the mandible and reported that errors were too large to fabricate well-fitting implant frameworks [5].
The results of this present study provide the knowledge of the nature of deviation in full-arch digital impression and can help to avoid these errors in future. The study was
conducted to provide knowledge for dental professionals to understand and control the digital scanning process. Future studies need to include more dental scanner systems and compare them in different clinical scenarios. The whole model-less digital production for full-tooth-fixed supported prostheses and full implant-fixed supported prostheses workflow should be assessed.
5. Conclusion
Within the limitations of this in vitro study, the results suggest significant differences between IOS devices when scanning fully edentulous arch with multiple implants. The main observation was the low precision for all intraoral scanners, suggesting that the intraoral scanning devices are unreliable for scanning fully edentulous arch with multiple implants. Two scanners, however, Trios 3 mono and Itero element showed fair trueness.
Data Availability
The data used to support the findings of this study are available from the corresponding author upon reasonable request.
Conflicts of Interest
The authors declare no conflicts of interest.
Acknowledgments
The research was supported by the Department of Pros-thodontics, Faculty of Odontology, Malm¨o University. We would like to thank Elos Medtech Pinol Denmark for providing us with the master model and measurement with CMM, Kulzer GmbH Sweden for scanning the master model with Atos, 3Shape Denmark for providing us with the Trios scanners, and Unident AB Sweden for providing us with the Itero element system.
References
[1] W. H. M¨ormann, “The evolution of the CEREC system,”
Journal of the American Dental Association, vol. 137,
pp. 7S–13S, 2006.
[2] ISO 12836, Dentistry–Digitizing Devices for CAD/CAM
Sys-tems for Indirect Restorations–Test for Methods for Assessing Accuracy, International Organization for Standardization,
Geneva, Switzerland, 2015.
[3] R. Nedelcu, P. Olsson, I. Nystrom, J. Ryden, and A. Thor, “Accuracy and precision of 3 intraoral scanners and accuracy of conventional impressions: a novel in vivo analysis method,”
Journal of Dentistry, vol. 69, pp. 110–118, 2018.
[4] M. Imburgia, S. Logozzo, U. Hauschild, G. Veronesi, C. Mangano, and F. G. Mangano, “Accuracy of four intraoral scanners in oral implantology: a comparative in vitro study,”
BMC Oral Health, vol. 17, no. 1, p. 92, 2017.
[5] F. S. Andriessen, D. R. Rijkens, W. J. van der Meer, and D. W. Wismeijer, “Applicability and accuracy of an intraoral scanner for scanning multiple implants in edentulous man-dibles: a pilot study,” Journal of Prosthetic Dentistry, vol. 111, no. 3, pp. 186–94, 2014.
[6] Van der Meer, J. Wicher, F. S. Andriessen, W. Daniel, and Y. Ren, “Application of intra-oral dental scanners in the digital workflow of implantology,” PLoS One, vol. 7, no. 8, Article ID e43312, 2012.
[7] A. Ender and A. Mehl, “In-vitro evaluation of the accuracy of conventional and digital methods of obtaining full-arch dental impressions,” Quintessence International, vol. 46, pp. 9–17, 2015. [8] F. G. Mangano, G. Veronesi, U. Hauschild, E. Mijiritsky, and C. Mangano, “Trueness and precision of four intraoral scanners in oral implantology: a comparative in vitro study,”
PloS One, vol. 11, no. 9, Article ID e0163107, 2016.
[9] B. Gim´enez, M. ¨Ozcan, F. Mart´ınez-Rus, and G. Prad´ıes,
“Accuracy of a digital impression system based on parallel confocal laser technology for implants with consideration of operator experience and implant angulation and depth,”
International Journal of Oral and Maxillofacial Implants,
vol. 29, pp. 853–862, 2014.
[10] B. Gim´enez, B. Hassan, M. ¨Ozcan, and G. Prad´ıes, “An in vitro
study of factors influencing the performance of digital intraoral impressions operating on active wavefront sampling technology with multiple implants in the edentulous maxilla,”
Journal of Prosthodontics, vol. 26, no. 8, pp. 650–655, 2017.
[11] T. V. Fl¨ugge, S. Schlager, K. Nelson, S. Nahles, and M. C. Metzger, “Precision of intraoral digital dental im-pressions with iTero and extraoral digitization with the iTero and a model scanner,” American Journal of Orthodontics and
Dentofacial Orthopedics, vol. 144, no. 3, pp. 471–478, 2013.
[12] J. H. Kim, K. B. Kim, S. H. Kim, W. C. Kim, H. Y. Kim, and J. H. Kim, “Quantitative evaluation of common errors in digital impression obtained by using an LED blue light in-office CAD/CAM system,” Quintessence International, vol. 46, pp. 401–407, 2015.
[13] P. M¨uller, A. Ender, T. Joda, and J. Katsoulis, “Impact of digital intraoral scan strategies on the impression accuracy using the TRIOS Pod scanner,” Quintessence International, vol. 47, pp. 343–349, 2016.
[14] A. Ender and A. Mehl, “Influence of scanning strategies on the accuracy of digital intraoral scanning systems,” International
Journal of Computerized Dentistry, vol. 16, pp. 11–21, 2013.
[15] T. V. Fl¨ugge, W. Att, M. C. Metzger, and K. Nelson, “Precision of dental implant digitization using intraoral scanners,”
In-ternational Journal of Prosthodontics, vol. 29, no. 3,
pp. 277–283, 2016.
[16] P. Papaspyridakos, G. O. Gallucci, C. -J. Chen, S. Hanssen, I. Naert, and B. Vandenberghe, “Digital versus conventional implant impressions for edentulous patients: accuracy out-comes,” Clinical Oral Implants Research, vol. 27, no. 4, pp. 465–72, 2016.
[17] J. F. G¨uth, D. Edelhoff, J. Schweiger, and C. Keul, “A new method for the evaluation of the accuracy of full-arch digital impressions in vitro,” Clinical Oral Investigations, vol. 20, no. 7, pp. 1487–1494, 2016.
[18] F. Kuhr, A. Schmidt, P. Rehmann, and B. Wostmann, “A new method for assessing the accuracy of full arch impressions in patients,” Journal of Dentistry, vol. 55, pp. 68–74, 2016. [19] J. Muallah, C. Wesemann, R. Nowak et al., “Accuracy of
full-arch scans using intraoral and extraoral scanners: an in vitro study using a new method of evaluation,” International
Journal of Computerized Dentistry, vol. 20, pp. 151–164, 2017.
[20] A. ¨Ortorp, T. Jemt, T. B¨ack, and T. Jalevik, “Comparisons of
precision of fit between cast and CNC-milled titanium im-plant frameworks for the edentulous mandible,” International
Dentistry
International Journal of Hindawi www.hindawi.com Volume 2018 Environmental and Public Health Journal of Hindawi www.hindawi.com Volume 2018Hindawi Publishing Corporation
http://www.hindawi.com Volume 2013 Hindawi www.hindawi.com
The Scientific
World Journal
Volume 2018 Hindawi www.hindawi.com Volume 2018Public Health
Advances inHindawi www.hindawi.com Volume 2018 Case Reports in Medicine Hindawi www.hindawi.com Volume 2018 International Journal of
Biomaterials
Scientifica
Hindawi www.hindawi.com Volume 2018Pain
Research and TreatmentHindawi www.hindawi.com Volume 2018 Hindawi www.hindawi.com Volume 2018 Hindawi www.hindawi.com Volume 2018 Case Reports in Dentistry Hindawi www.hindawi.com Volume 2018 Surgery
Research and Practice
Hindawi
www.hindawi.com Volume 2018
BioMed
Research International
Medicine
Advances in Hindawiwww.hindawi.com Volume 2018 Hindawiwww.hindawi.com Volume 2018 Anesthesiology Research and Practice Hindawi
www.hindawi.com Volume 2018
Radiology
Research and Practice
Hindawi
www.hindawi.com Volume 2018
Computational and Mathematical Methods in Medicine
Endocrinology
International Journal of Hindawiwww.hindawi.com Volume 2018
Hindawi
www.hindawi.com Volume 2018
Orthopedics
Advances inDrug Delivery
Journal ofHindawi
www.hindawi.com Volume 2018