Sweden’s third Biennial
Report under the UNFCCC
Orders
Phone: + 46 (0)8-505 933 40 Fax: + 46 (0)8-505 933 99 E-mail: natur@cm.se
Address: CM Gruppen AB, Box 110 93, SE-161 11 Bromma Internet: www.naturvardsverket.se/publikationer The Swedish Environmental Protection Agency Phone: + 46 (0)10-698 10 00, Fax: + 46 (0)10-698 16 00 E-mail: registrator@naturvardsverket.se
Address: Naturvårdsverket, SE-106 48 Stockholm, Sweden Internet: www.naturvardsverket.se
ISBN 978-91-620-6806-6 ISSN 0282-7298
© Naturvårdsverket 2017 Illustrations: Annika Carlsson Graphic design: Granath
Preface | 3
Preface
1 Outcome of the work of the Ad Hoc Working Group on Long-term Cooperative Actionunder the Convention, Document: FCCC/CP/2011/9/Add.1
Climate change poses an unprecedented threat to our lives and societies. It has immense consequences for human security across the globe. It is obvious that the way we organise our society and make use of natural resources are having a global long-term impact on the ecosystem of our planet. The old model of achieving wealth through excessive use of natural resources has proved to be outdated. Some may argue that the call for a paradigm shift of development is too challenging. Sweden, however, sees a land of opportunities in transforming Sweden and the world towards sustainable development.
It falls on governments to demonstrate political leadership to realize the Paris Agreement. As governments, we should introduce the necessary legislation to provide a long-term and predictable environment for society. Sweden is willing to show leadership. The policy instruments introduced have had a significant effect so far, and emissions have fallen by around 25 per cent in absolute numbers between 1990 and 2015, while the economy has grown by 75 per cent. That is good, but far from enough. With broad support from the parliament the government introduced a climate policy framework with a climate act for Sweden in June 2017. This framework is the most important climate reform in Sweden’s history and sets out implementation of the Paris Agreement in Sweden. The framework contains new ambitious climate goals, a climate act and plans for a new climate policy council. The framework contains the following climate goals for Sweden:
• Net zero emissions of greenhouse gases into the atmosphere by 2045, and thereafter negative emissions. Emissions from activities in Sweden must be at least 85 per cent lower than in 1990. Based on current population forecasts for Sweden, this means that emissions in Sweden will be less than one tonne per person by 2045.
• By 2030, emissions from domestic transport, excluding domestic aviation, shall be reduced by at least 70 per cent compared with 2010.
• Emissions in the sectors outside the EU emission trading scheme should be at least 63 per cent lower in 2030 and at least 75 per cent lower in 2040, as compared to 1990.
These goals mean Sweden undertakes to achieve emission reductions that far exceed Sweden’s required emission reductions under EU legislation. Sweden therefore is already moving beyond the commitment by the EU within the Paris Agreement, and encourages other countries to do the same.
In this third biennial report, a comprehensive summary of Sweden’s efforts to combat climate change is provided. Emissions and removals of greenhouse gases are reported for each sector and adopted and planned policy measures and their impact on emissions are described. The report contains projections for emissions up to 2020 and 2030. According to these projections, emissions will continue to decrease, and the national target for 2020 is within reach with national measures alone. The biennial report also describes Sweden’s contributions to climate finance The material on which the biennial report is based has been obtained through extensive activity and input from around ten government agencies, led by the Swedish Environmental Protection Agency. The report has been elaborated in accordance with the UNFCCC biennial reporting guidelines for developed country Parties contained in Decision 2/CP.17 as adopted by the Conference of the Parties at its seventeenth session1.
Stockholm, December 2017.
Isabella Lövin
Minister for International Development Cooperation and Climate
4 | Content
PREFACE 3
1. INFORMATION ON GHG EMISSIONS AND
REMOVALS AND TRENDS, GHG INVENTORY INCLUDING INFORMATION ON NATIONAL SYSTEM 7
1.1. Total emissions and removals
of greenhouse gases 7
1.1.1. Energy industries 8 1.1.2. Residential and commercial/institutional 9 1.1.3. Industrial combustion 9 1.1.4. Fugitive emissions 9 1.1.5. Industrial processes including product use 9
1.1.6. Transport 10
1.1.7. Waste 10
1.1.8. Agriculture 11
1.1.9. Land use, Land-use change and Forestry 11 1.1.10. International transport 11
1.2. The National system for the GHG inventory and for policies and measures and projections 12 1.3. The national system for GHG inventory 12
1.3.1. Legal arrangements 12 1.3.2. Institutional arrangements 12 1.3.3. Contact details of organisation responsible 13 1.3.4. Inventory planning, preparation
and management 13
1.3.5. Information on changes in the national
system for GHG inventory 14
1.4. The national system for policies and
measures and projections 14
1.4.1. Legal arrangements 14 1.4.2. Institutional arrangements 15 1.4.3. Contact details of organisation responsible 15 1.4.4. Inventory planning, preparation and management 15 1.4.5. Information on changes in the national system
for policies and measures and projections 15
1.5. References 16
2. QUANTIFIED ECONOMY-WIDE
EMISSION REDUCTION TARGET 19
2.1. The pledge of the European Union and Members States under the Climate Change
Convention 19
2.2. Sweden’s national emission reduction
targets – exceeding European targets 20
2.2.1. The Swedish target for 2045 20 2.2.2. The Swedish target for 2020 21
2.3. Reference 22
3. PROGRESS IN ACHIEVEMENT OF QUANTIFIED
ECONOMY-WIDE EMISSION REDUCTION
TARGET AND RELEVANT INFORMATION 25
3.1. Swedish climate strategy 25
3.1.1. The Swedish environmental quality objective – Reduced Climat Impact 25 3.1.2. Sweden’s national climate policy framework 25 3.1.3. Framework agreement on the Swedish energy policy 26 3.1.4. Regional and local action on climate change 26
3.2. Policies and measures in Sweden’s climate
strategy and their effects 26
3.2.1. Background 26
3.2.2. Cross-sectoral instruments 27 3.2.3. Energy – production of electricity and district
heating and residential and service sector 30 3.2.4. Industrial emissions from combustion and
processes (including emissions of fluorinated greenhouse gases) 33
3.2.5. Transport 35
3.2.6. Waste 39
3.2.7. Agriculture 39
3.2.8. Land use, land-use change and forestry (LULUCF) 40 3.2.9. Shipping and aviation, including international
bunkers in Sweden 41 3.2.10. Efforts to avoid adverse effects of policies and
measures introduced as part of the country’s
climate strategy 42
3.3. Summary of policies and measures 43 3.4. Progress to quantified economy- wide
emission reduction target 48
3.5. References for Chapter 3 49
Content | 5
4. PROJECTIONS 53
4.1. Key parameters and assumptions 53 4.2. Greenhouse gas emission projections 53
4.3. Projections by gas 54
4.4. Projections by sector 54
4.4.1. Energy industries (Electricity- and heat production, Refineries, Manufacturing of solid fuels) 54 4.4.2. Residential and commercial 55 4.4.3. Industrial combustion 55 4.4.4. Fugitive emissions 56 4.4.5. Industrial processes and product use 56 4.4.6. Domestic transport 57
4.4.7. Waste 58
4.4.8. Agriculture 58
4.4.9. Land Use, Land Use Change and Forestry (LULUCF) 59 4.4.10. International transport 60
4.5. Sensitivity analysis 60
4.6. Comparison with Second Biennial Report 60 4.7. Progress towards targets under the
EU Climate and Energy Package 61
4.7.1. Sweden’s commitment according
to the Effort Sharing Decision 61
4.8. Target fulfilment in relation to domestic targets 62
4.9. References for Chapter 4 63
5. PROVISION OF FINANCIAL, TECHNOLOGICAL
AND CAPACITY-BUILDING SUPPORT TO
DEVELOPING COUNTRY PARTIES 65
5.1. Introduction 65
5.2. Governing policies and principles 65
5.2.1. Policy framework for Swedish development cooperation and humanitarian aid 65 5.2.2. Key principles 65 5.2.3. New and additional resources 65
5.3. Multilateral financial support 66
5.4. Bilateral financial support 67
5.4.1. Methodology for tracking climate-related
bilateral ODA 67
5.4.2. Bilateral financial support through Sida 68 5.4.3. Bilateral financial support through
the project-based flexible mechanisms
under the Kyoto Protocol 69
5.5. Financial flows leveraged by
bilateral climate finance 70
5.5.1. Mobilisation of capital through Sida 70 5.5.2. Mobilisation of private capital through Swedfund 70
5.6. Capacity building 71
5.6.1. Capacity building through official
development assistance (ODA) 71 5.6.2. Capacity building through other official flows (OOF) 72
5.7. Technology development and
technology transfer 73
5.7.1. Technology development through
official development assistance (ODA) 73 5.7.2. Technology development through
other official flows (OOF) 73
6. OTHER REPORTING MATTERS 75
6.1. Domestic monitoring and assessment 75
6.1.1. Monitoring under the new climate policy framework 75
6.2. Additional monitoring 75
ANNEX 1 FINANCIAL, TECHNOLOGICAL
Information on GHG emissions and removals and trends, GHG inventory including information on national system | 7
1.
Information on GHG emissions and
removals and trends, GHG inventory including
information on national system
The information in this chapter is a summary of the 2017 inventory of emissions and removals of greenhouse gases for the years 1990 to 2015, submitted under the UN Framework Convention on Climate Change and the Kyoto Protocol (National Inventory Report Sweden 2017). The chapter also includes information on national system for GHG inventory and Policy and measures and projections.
1.1. Total emissions and
removals of greenhouse gases
In 2015, greenhouse gas emissions (excluding LULUCF) in Sweden totalled 53.7 million tonnes of carbon dioxide equivalents (Mt CO2-eq.), see Figure 1.1. Total emissions have decreased by 18.2 Mt, or 25 %, between 1990 and 2015. Emission levels have varied between a low of 53.7 Mt CO2-eq. in 2015 and a high of 77.3 Mt CO2-eq. in 1996. Annual variations are largely due to fluctuations in temperature and precipitation and to the economic situation. The net sink attributable to the land use, land-use change and forestry (LULUCF) sector has varied over the period. In 2015 it amounted to 50.5 Mt CO2-eq., which corresponds to 94 % of total greenhouse gas emissions.
-60 -40 -20 0 20 40 60 80 100
Land use, Land-use change and Forestry (LULUCF, CRF 4) Energy (CRF 1) Agriculture (CRF 3) Industrial processes incl. product use (CRF 2) Waste (CRF 5) 2015 2014 2013 2012 2011 2010 2009 2008 2007 2006 2005 2004 200 3 2002 2001 2000 1999 1998 1997 1996 1995 1994 1993 1992 1991 1990 Mt CO 2 -eq.
Figure 1.1 Total greenhouse gas emissions from different sectors.
In 2015, emissions (excl. LULUCF) of carbon dioxide (CO2) amounted to 43.1 Mt CO2 in total, which is equivalent to 81 % of total greenhouse gas emissions, calculated as CO2-eq. Emissions of methane (CH4) accounted for 4.9 Mt of CO2-eq. (about 9 % of total emissions), emissions of nitrous oxide (N2O) 4.6 Mt (9 %), fluorinated greenhouse gases 0.9 Mt (2 %), see Figure 1.2. The shares of the different greenhouse gases have remained stable over the period 1990 to 2015.
HFCs, PFCs & SF6 CO2 CH4 N2O 2% 9% 9% 81%
Figure 1.2 Greenhouse gas emissions in 2015 (excl. LULUCF) by gas, in carbon dioxide equivalent.
The largest sources of emissions in 2015 was the energy sector (73 %), agriculture (13 %) and industrial processes and product use (12 %), as shown in Figure 1.3.
8 | Information on GHG emissions and removals and trends, GHG inventory including information on national system 2% 73% 17% 14% 34% 6% 2% 0% 13% 12%
Energy Industrial Processes and Product Use Agriculture Waste Transport Energy Industries Manufacturing Industries and Construction Other Sectors Fugitive Emissions from Fuels Non-Specified
Figure 1.3 Greenhouse gas emissions in 2015 (excl. LULUCF), by sector.
In recent years there has been a downward trend in emissions. The largest reductions in absolute terms are due to a transition from oil-fuelled heating of homes and commercial and institutional premises to electricity, e.g. heat pumps, and district heating. Increased use of biofuels in district heating generation and industry has also contributed to the reductions together with reductions in landfilling of waste. Fluctuations in production levels of manufacturing industries following changes in the economic development of specific industries have also had significant impacts on the national trend.
BOX 1. 1 The Swedish national sectorial breakdown
The Swedish greenhouse gas inventories are published using a national sectorial breakdown for the purpose of tracking progress with national targets, and tracking the effect of implemented policies and measures. The sectorial breakdown is designed to allocate emissions and removals in line with the design of national policies and measures. The aggregation of all industrial emissions in one main sector that is sub-divided by type of industry is the largest difference between the national sectorial breakdown and the IPCC sectors in Common Reporting Format.
The main emission sources in Sweden are domestic transport, industry, and electricity and district heating according to this breakdown.
Emissions from domestic transport respond to one third of Sweden’s total emissions (excluding LULUCF and international transport). Although the emissions were 9 % lower in 2015 than in 1990, the decreasing trend seen in recent years has slowed down to a halt. The development in recent years can be explained by increased traffic on Swedish roads and the shift towards biofuels and increased energy efficiency not being strong enough to counteract that trend.
Emissions from industry respond to 31 % of Sweden’s total emissions and have decreased by 20 % since 1990, while changes in the economic development of different industries have resulted in annual variations. The emissions reductions are mainly related to decreased use of oil due to shifts towards biofuels, mainly in the pulp and paper industry. New processes in the chemical industry have also contributed to the decreasing trend. Shifting production levels in response to changing economic conditions in certain industries also significantly impacts the trend. Electricity and district heating shows a trend of decreasing emissions despite the increased demand for district heating due to increased combustion of waste and biofuels. Combustion of industry-derived gases is allocated to the industry.
More information about the national breakdown including how different CRF-categories are allocated is available at: Description of trends (in Swedish):
http://www.naturvardsverket.se/klimatutslapp
Detailed data and reference to CRF-categories (in English): http://www.scb.se/mi0107-en
1.1.1. Energy industries
Total emissions from energy industries were approximately 9.0 Mt CO2-eq. in 2015, a 10 % decrease compared with 1990. Production of electricity and district heating account for the larger part of the emissions with 71 % (6.4 Mt) in 2015. Emissions from refineries and the manufacture of solid fuels totalled 2.6 Mt in 2015.
Energy industries are dominated by electricity and heat production, where emissions fluctuate between the years due to the weather conditions’ influence on the electricity and heat production, see Figure 1.4. The fluctuations seen for emission from coke production and refineries are primarily related to changes in production levels in response to the economic development of the industries. Emissions from Sweden’s electricity and heat production mainly originate from combined heat and power plants that are to a large extent fuelled by waste and renewable resources with low emission factors, and industry-derived gases from the steel production. The use of coal, oil and gas are decreasing. Despite demand for district heating increasing by over 50 % since 1990, the emissions have remained at a level similar to 1990. Mt C O2 -eq. -60 -30 0 30 60 90 2015 2010 2005 2000 1995 1990
Land-use, land-use change and forestry (LULUCF), total Heating of houses and premises, total
Solvent use and other product use, total Agriculture, total
International transport, total Domestic transport, total
Industry, total
Electricity and district heating, total Waste, total
Information on GHG emissions and removals and trends, GHG inventory including information on national system | 9 Production of electricity and district heating (1A1a)
Refineries and manufacturing of solid fuels (CRF 1A1b & 1A1c)
2015 2014 2013 2012 2011 2010 2009 2008 2007 2006 2005 2004 2003 200 2 2001 2000 1999 1998 1997 1996 1995 1994 1993 1992 1991 1990 Mt C O2 -eq. 0 2 4 6 8 10 12 14 16 18
Figure 1.4 Greenhouse gas emissions from the energy industries (CRF 1A1).
1.1.2. Residential and commercial/institutional
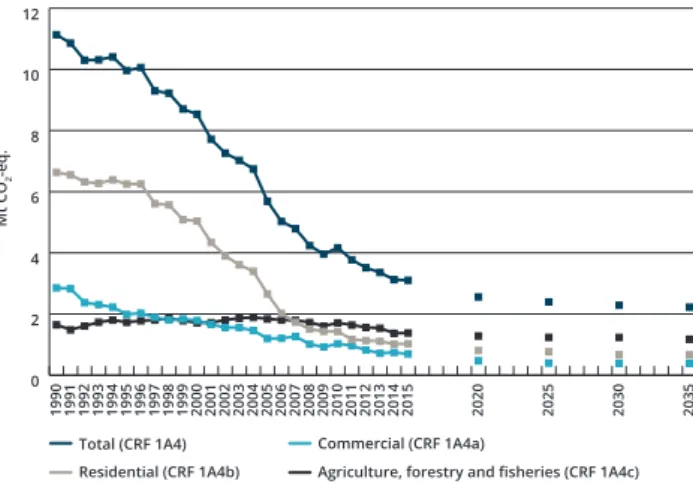
Greenhouse gas emissions from fuel combustion in the residential, commercial and institutional sectors were 72 % lower in 2015 compared to 1990 due to a strong decrease in combustion of fossil fuels for heating, see Figure 1.5. The emissions primarily adhere to stationary combustion in homes, non-residential premises or within agriculture, forestry and fisheries. Emissions also come from mobile machinery, off-road vehicles and fishing boats. Oil-fuelled furnaces have been replaced by district heating, and electricity, including the increased use of heat pumps. Since emissions from stationary combustion for heating purposes have decreased significantly, the main emissions within the sector now come from working machinery and off-road vehicles.
Agriculture, Forestry and Fisheries (CRF 1A4c) Residential (CRF 1A4b) Commercial/Institutional (CRF 1A4a) 2015 2014 2013 2012 2011 2010 2009 2008 2007 2006 2005 2004 2003 200 2 2001 2000 1999 1998 1997 1996 1995 1994 1993 1992 1991 1990 Mt CO 2 -eq. 0 2 4 6 8 10 12
Figure 1.5 Greenhouse gas emissions from combustion in the commercial and institutional, residential, and agriculture, forestry and fisheries sectors.
1.1.3. Industrial combustion
To cover all industry-related emissions, account needs to be taken of process emissions, emissions from combustion and fugitive emissions, which according to UNFCCC guidelines are to be reported under separate CRF (Common Reporting Format) categories.
The mining, iron and steel industries, as well as the pulp and paper industry, are examples of historically important industries for Sweden. Emissions from combustion in
manufacturing industries and construction were 7.6 Mt CO2 -eq. in 2015, see Figure 1.6. Emissions in 2015 were 33 % lower than in 1990 and close to unchanged compared to 2014. Although increasing slightly up until 1997, the emissions show a decreasing trend since then. The lower emissions in 2009 and higher emissions in 2010 were caused by the impact of the financial crisis on production levels and their subsequent recovery. The decreasing trend is primarily related to a lower use of oil as oil has been replaced by electricity or biomass.
0 2 4 6 8 10 12 14 2015 2014 2013 2012 2011 2010 2009 2008 2007 2006 2005 2004 2003 200 2 2001 2000 1999 1998 1997 1996 1995 1994 1993 1992 1991 1990
Iron and Steel (CREF 1A2a) Chemicals (CRF 1A2c)
Non-metallic Minerals (CRF 1A2f) Others (CRF 1A2b, 1A2d, 1A2e and 1A2g(viii))
Mt C
O2
-eq.
Figure 1.6 Greenhouse gas emissions from industrial combustion.
1.1.4. Fugitive emissions
Fugitive emissions come from sources like processing, storing and using fuels, gas flaring, and the transmission and distribution of gas. Emissions were around 0.9 Mt CO2-eq. in 2015, see Figure 1.7, and have increased by 125 % compared with 1990. The increase of fugitive emissions from oil, observed in the time series from 2006, is related to the establishment of hydrogen production facilities at two oil refineries.
2015 2014 2013 2012 2011 2010 2009 2008 2007 2006 2005 2004 2003 200 2 2001 2000 1999 1998 1997 1996 1995 1994 1993 1992 1991 1990
Fugitive emissions, oil, venting and flaring (CRF 1B2a & CRF 1B2c) Fugitive emissions, natural Gas (CRF 1B2b)
Flaring of gas (CRF 1B1c) 0,0 0,2 0,4 0,6 0,8 1,0 1,2 Mt C O2 -eq.
Figure 1.7 Fugitive emissions.
1.1.5. Industrial processes including product use
Emissions from the industrial processes and product use sector represented 12 % of total national emissions in 2015. The main sources of emissions in this sector are the production of iron and steel as well as the cement and lime
10 | Information on GHG emissions and removals and trends, GHG inventory including information on national system
industries. Greenhouse gas emissions from industrial processes and product use were 10 % lower in 2015 compared with 1990, equivalent to 0.7 Mt CO2-eq., see Figure 1.8. Product use (CRF 2D, 2F, 2G) 2015 2014 2013 2012 2011 2010 2009 2008 2007 2006 2005 2004 2003 200 2 2001 2000 1999 1998 1997 1996 1995 1994 1993 1992 1991 1990 0 1 2 3 4 5 6 7 8 9
Industrial processes (CRF 2A, 2B, 2C, 2E, 2H)
Mt C
O2
-eq.
Figure 1.8 Emissions from the industrial processes and product use.
Greenhouse gas emissions from industrial processes and product use show an overall decreasing trend since 1995, with the exception of 2009 and 2010, and were 23 % lower in 2015 compared with 1990. The trend of emissions from product is mainly influenced by products used as substitutes for ozone depleting substances. These emissions show an increasing trend that culminated in 2008–2010 and have been decreasing since 2010. Nevertheless, greenhouse gas emissions from product use were 142 % higher in 2015 compared with 1990. Products used as substitutes for ozone depleting substances responded to 57 % of the total emissions from product use in 2015.
1.1.6. Transport
In 2015, emissions of greenhouse gases from domestic transport totalled 18 Mt CO2-eq., a third of the national total. The majority of the transport-related greenhouse gas emissions in Sweden come from road traffic, mainly from cars and heavy-duty vehicles. The decrease in emissions from cars, a decrease that started in 2007, has slowed down since 2013, see Figure 1.9. The switch from petrol-powered to diesel-powered cars has led to a more energy-efficient car fleet, which since the mid-2000’s has been bolstered by a general improvement in fuel efficiency for new cars. The emissions from heavy-duty vehicles follow the fluctuations of economic activity, and these emissions increased between 1996 and 2008. The decrease in emissions from heavy-duty vehicles that started in 2010 has slowed down since 2013.
2015 2014 2013 2012 2011 2010 2009 2008 2007 2006 2005 2004 2003 200 2 2001 2000 1999 1998 1997 1996 1995 1994 1993 1992 1991 1990
Civil Aviation (CRF 1A3a)
Road transport, passenger cars (CRF 1A3b(i)) Road transport, Light duty vehicles (CRF 1A3b(ii))
Railways (CRF 1A3c)
Road transport, heavy goods vehicles and buses (CRF 1A3b(iii)) Road transport, Mopeds & Motorcycles (CRF 1A3b(iv))
Military (CRF 1A5)
Water-borne Navigation (CRF 1A3d)
Other working machinery and off-road equipment (CRF 1A3e)
Mt CO 2 -eq. 0 5 10 15 20 25
Figure 1.9 Greenhouse gas emissions from transport.
Except for emissions from road transport, emissions from transport include emissions from domestic aviation, railways, national navigation, other working machinery and off-road equipment as well as domestic military operations. In 2015, the greenhouse gas emissions from road transport were 17.0 Mt CO2-eq., 0.5 Mt CO2-eq. from domestic aviation, 0.4 Mt CO2-eq. from domestic navigation, 0.1 Mt CO2-eq. from railways, and 0.3 Mt CO2-eq. from working machinery. Emissions from domestic military operations totalled 0.2 Mt CO2-eq. in 2015.
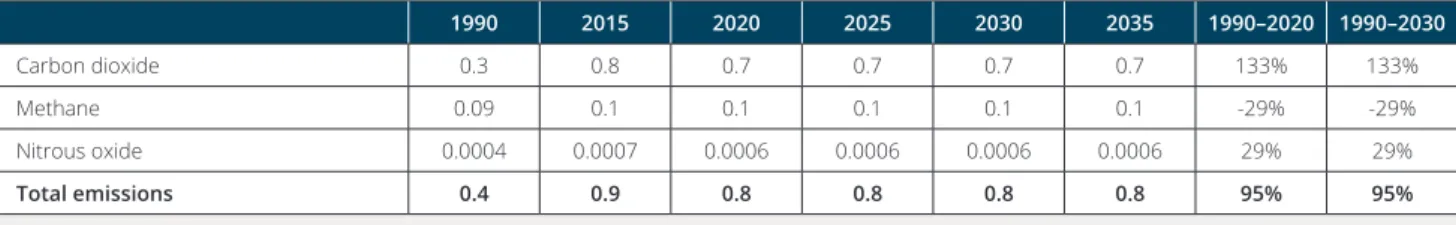
1.1.7. Waste
Greenhouse gas emissions from the waste sector totalled 1.4 Mt CO2-eq. in 2015, or about 2.6 % of the national total of greenhouse gas emissions. More than two thirds of the emissions from the waste sector come from solid waste disposal in landfills, which generates methane emissions and responded to 79 % of the sector in 2015, see figure 1.10. 2015 2014 2013 2012 2011 2010 2009 2008 2007 2006 2005 2004 2003 200 2 2001 2000 1999 1998 1997 1996 1995 1994 1993 1992 1991 1990
Solid Waste Disposal (CRF 5A)
Biological Treatment of Solid Waste (CRF 5B)
Incineration and Open Burning of Waste (CRF 5C) Wastewater Treatment and Discharge (CRF 5D) 0,0 0,5 1,0 1,5 2,0 2,5 3,0 3,5 4,0 4,5 Mt C O2 -eq.
Figure 1.10 Greenhouse gas emissions from the waste sector, per subsector.
Information on GHG emissions and removals and trends, GHG inventory including information on national system | 11
Methane emissions have decreased by 68 % in the period 1990–2015. The most important mitigation measures are the expansion of the methane recovery from landfills, the reduction of landfill disposal of organic material, the increased levels of recovery of materials, and waste incineration with energy recovery. The main reasons for the decrease in the quantities of waste sent to landfill are the bans on landfill disposal of combustible and organic material, introduced in 2002 and 2005 respectively. Producer responsibility, municipal waste plans and the waste tax have also contributed to the reduction of the amount of waste deposited in landfills.
1.1.8. Agriculture
In 2015, emissions from the agricultural sector were about 6.9 Mt CO2-eq., which equals 12.5 % of the total national greenhouse gas emissions (excluding LULUCF).
The main sources of these emissions are nitrous oxide from soil and manure; and methane from cattle. Both gases are almost equal in size, constituting about 51 % and 47 % of the sector’s emissions, respectively. The rest of the emission is made up of carbon dioxide that comes from liming and urea application.
2015 2014 2013 2012 2011 2010 2009 2008 2007 2006 2005 2004 2003 200 2 2001 2000 1999 1998 1997 1996 1995 1994 1993 1992 1991 1990
Enteric Fermentation (CRF 3A) Manure Management (CRF 3B)
Agricultural Soils (CRF 3D)
Liming and urea application (CRF 3G & CRF 3H) 0 1 2 3 4 5 6 7 8 9 Mt C O2 -eq.
Figure 1.11 Greenhouse gas emissions from agriculture.
The overall decreasing trend in emissions from agricultural sector can be explained by a general decline in livestock numbers and a decrease in emissions from agricultural soils. Although the long-term trend is decreasing, emissions have levelled out over the last few years due to increased use of synthetic fertilisers. In 2015, emissions from agriculture were about 10 % lower compared with 1990, see Figure 1.11.
1.1.9. Land use, Land-use change and Forestry
The largest removals of carbon dioxide in Sweden occur in forest land, totalling about 50 Mt CO2-eq. in 2015, followed by harvested wood products with removals of nearly 7 Mt CO2-eq, see Figure 1.12.
Harvested Wood Products (CRF 4G) Forest Land (CRF 4A)
-60 -50 -40 -30 -20 -10 0 10 20 Settlements (CRF 4E) Wetlands (CRF 4D) Grassland (CRF 4C) Cropland (CRF 4B) 2015 2014 2013 2012 2011 2010 2009 2008 2007 2006 2005 2004 200 3 2002 2001 2000 1999 1998 1997 1996 1995 1994 1993 1992 1991 1990 Mt C O2 -eq.
Figure 1.12 Greenhouse gas emissions and removals from land use, land-use change and forestry.
The largest emission in this sector is due to settlements. Usually cropland is also an emitter, but was in 2015 a small sink. The estimated emissions and removals in the mineral soil give the annual variation for cropland. The annual variations depend on what is grown and how large areas of crops that are grown between years, together with the climatic conditions (air temperature and precipitations). The net emissions in 2015 were about 3 Mt of CO2-eq. as a mean value in these two categories. Sources and sinks in the LULUCF sector as a whole have resulted in net removals since 1990. During the period 1990–2015 net removals varied between roughly 31 to 50 Mt of CO2-eq. The total size and variation of net removals in the LULUCF sector is mainly affected by the carbon stock change in forest land, and changes in the carbon pool living biomass constitute the major part of these changes in net removals, followed by carbon stock changes in mineral soils. Net removals in this sector are heavily influenced by harvests and natural disturbances such as storms on forest land. Two severe storms, in 2005 and 2007, had significant impacts on the trends of both forest land and harvested wood products. According to the Swedish National Board of Forestry, the felling, including wood felled by storms, was estimated at 122 Mm3 stemwood 2005. However, the
decrease in the living biomass in 2005 resulted in a corresponding increase in the harvested wood products pool in 2006.
1.1.10. International transport
Greenhouse gas emissions from international shipping and aviation, known as international bunkering, are considerably larger than those from domestic shipping and aviation. In 2015 these emissions totalled 8.4 Mt CO2-eq., a full 132 % higher than in 1990, see Figure 1.12.
12 | Information on GHG emissions and removals and trends, GHG inventory including information on national system 2015 2014 2013 2012 2011 2010 2009 2008 2007 2006 2005 2004 2003 200 2 2001 2000 1999 1998 1997 1996 1995 1994 1993 1992 1991 1990
International bunkers, aviation (CRF 1D1A) International bunkers, maritime (CRF 1D1B)
Multilateral operations (CRF 1D2) 0 2 4 6 8 10 12 Mt C O2 -eq.
Figure 1.13 Greenhouse gas emissions from international bunkers.
Emissions from international shipping reached a total of 6.2 Mt CO2-eq. in 2015. This is an increase of 8 % compared with 2015 and 173 % higher than in 1990. The increase may be a result of the production by Swedish refineries of low-sulphur marine fuels (fuel oil Nos. 2–5), which meet strict environmental standards. As a result, more shipping companies choose to refuel in Sweden. Another explanation may be the globalisation of trade and production systems, which has led to goods being transported over greater distances. Fluctuations in bunker volumes between years are also dependent on fuel prices in Sweden compared with the price at ports in other countries.
The Swedish Armed Forces bunker extremely small quantities of fuel in Sweden for operations abroad.
1.2. The National system for the GHG
inventory and for policies and measures
and projections
In accordance with the Kyoto Protocol, as well as the associated Decision 24/CP19, as well as EU Monitoring Mechanism Regulation (EU/No/525/2013), Sweden has established a national system for greenhouse gas inventory (see section 1.3). The Swedish national system for policies and measures and projections aims to ensure that the policies, and measures and projections to the Secretariat of the Convention (UNFCCC), the Kyoto Protocol and the European Commission are reported in compliance with specified requirements.
The Swedish national system for GHG inventory came into force on 1 January 2006, and a national system for policies and measures and projections was set up in 2015. In relation to legal arrangements, the information is the same for the two systems.
On 29 December 2014, the Ordinance on Climate Reporting (SFS 2014:1434) came into force in Sweden. The ordinance describes the roles and responsibilities of government agencies in the context of climate reporting and concerns both the GHG inventory and the reporting of policies,
2 Read more at http://www.regeringen.se/informationsmaterial/2009/09/public-access-to-information-and-secrecy-act/
measures and projections. This led to several changes in Swedish reporting such as enlarging the national system, adding other agencies, as well as adding responsibilities for agencies already included. The ordinance requires that sufficient capacity be available for timely reporting.
1.3. The national system
for GHG inventory
The Swedish national system for GHG inventory was established in 2006 in accordance with 19/CMP.1, 20/CP.7 and decision 280/2004/EC. In 2013, EU decision No 280/2004/EC was replaced by the Monitoring Mechanism Regulation 525/2013/EC. The Monitoring Mechanism Regulation has the same demands for national systems as the Monitoring Mechanism decision. The aim is to ensure that climate reporting to the secretariat of the Convention (UNFCCC), the Kyoto Protocol, and the European Commission complies with specified requirements. The national system for GHG inventory is described in detail every year in Sweden’s annual National Inventory Report, submitted to the UNFCCC Secretariat. The KP reporting of LULUCF uses the same institutional arrangements, national system and corresponding QA/QC procedures as for the UNFCCC reporting.
1.3.1. Legal arrangements
The legal basis for Sweden’s national system is provided by the Ordinance on Climate Reporting (2014:1434), which describes the roles and responsibilities of the relevant government agencies in this area. The Ordinance ensures that sufficient capacity is available for reporting. Supplemental to the Ordinance on Climate Reporting, formal agreements between the Swedish EPA and the concerned agencies have been signed, detailing the requirements regarding content and timetable from each agency.
Sweden also has legislation which indirectly supports climate reporting efforts by providing a basis for estimating greenhouse gas emissions and removals. Environmental reports are submitted under the Environmental Code (SFS 1998:808), and the Official Statistics Act (SFS 2001:99) imposes an obligation to submit annual data. In addition, government agencies in Sweden must comply by the Information and Secrecy Act2 (SFS 2009:400).
1.3.2. Institutional arrangements
Preparing the annual inventory and other reports is done in collaboration between the Ministry of the Environment and Energy, the Swedish EPA and other government agencies and consultants. Depending on the role of these agencies in the climate-reporting process, this responsibility may range from supplying data and producing emission factors/calorific values to performing calculations for estimating emissions or conducting a national peer review. Figure 1.14 illustrates the institutional arrangements for the yearly inventory report, as well as for other reporting, to the European Commission and the UNFCCC.
Information on GHG emissions and removals and trends, GHG inventory including information on national system | 13
The Ministry of the Environment and Energy is responsible for the national system and for ensuring that Sweden meets international reporting requirements in the area of climate change. The Swedish EPA is responsible for coordinating the national system for climate reporting, for maintaining the necessary reporting system and for producing data and drafts for the required reporting and submitting the material to the Government.
Under contract to the Swedish EPA, the consortium SMED3 processes data and documentation received from
the various government agencies, as well as their own data, to calculate Swedish greenhouse gas emissions and removals.
1.3.3. Contact details of organisation responsible
The Swedish Ministry of the Environment and Energy is the national entity with overall responsibility for the inventory. Ministry of Environment and Energy
Address: SE 103 33 Stockholm, Sweden Telephone: +46 8 405 10 00
Contact: Ms. Nilla Thomson m.climate@regeringskansliet.se
1.3.4. Inventory planning, preparation and management
The Swedish greenhouse gas inventory is compiled in accordance with the various reporting guidelines drawn up by the Intergovernmental Panel on Climate Change (IPCC) and the UNFCCC. The national system is designed to ensure the quality of the inventory, i.e. to ensure its transparency, consistency, comparability, completeness and
3 SMED = Svenska Miljö Emissions Data (Swedish Environmental Emissions Data), a consortium comprising Statistics Sweden (SCB), the Swedish Meteorological and Hydrological Institute (SMHI), IVL Swedish Environmental Research Institute and the Swedish University of Agricultural Sciences (SLU)
accuracy. The Swedish quality system is based on the structure described in UNFCCC Decision 20/CP.7 and applies a PDCA (plan–do–check–act) approach.
Planning and development
In any given year, priorities are set on the basis of
recommendations received from international and national reviews, the results of key category analysis, uncertainty analysis, ideas for improvements from the Swedish EPA and the SMED consultants, and new requirements arising from international decisions, for example.
Based on these criteria, the Swedish EPA decides on development projects, which are undertaken by the SMED consultants. On completion of these projects, the results are implemented in the inventory.
Preparation
Government agencies supply activity data to the Swedish EPA and SMED, which also gather activity data from companies and sectoral organisations, and from environmental reports. Emission factors may be plant-specific, developed at a national level, or IPCC default factors. Methods used to estimate emissions comply with current requirements and guidelines.
Quality control and quality assurance
All data are subjected to general inventory quality control (Tier 1), as described in the IPCC Good Practice Guidance (2000), Table 8.1. Certain sources also undergo additional checks (Tier 2). All quality control is documented by SMED in checklists. Data are also validated using the checks built into the CRF Reporter tool.
GOVERNMENT AGENCIES
Swedish Energy Agency Transport Analysis Swedish Chemicals Agency Swedish Board of Agriculture Swedish Forest Agency Swedish EPA
Swedish University of Agricultural Sciences (SLU)
Swedish Transport Administration Swedish Transport Agency Swedish Armed Forces Swedish Meteorological and Hydrological Institute (SMHI) Statistics Sweden (SCB)
Swedish International Development Cooperation Agency (SIDA)
Geological Survey of Sweden (SGU) Medical Products Agency
Swedish Civil Contingencies Agency (MSB)
MINISTRY OF ENVIRONMENT AND ENERGY CONSULTANTS SMED IVL – Swedish Environmental Research Institute
SMHI – The Swedish Meteorological and Hydrological Institute SCB – Statistics Sweden SLU – Swedish University of Agricultural Sciences
UNFCCC
SWEDISH ENVIRONMENTAL PROTECTION AGENCY
EU
14 | Information on GHG emissions and removals and trends, GHG inventory including information on national system
Quality assurance is carried out in the form of a national peer review by government agencies, as provided in the Ordinance on Climate Reporting (2014:1434). This national review covers choice of methods, emission factors and activity data and is a guarantee of politically independent figures. The reviewers also identify potential areas for improvement in future reporting. Their findings are documented in review reports. The timetables for quality assurance are included in the agreements between the government agencies and the Swedish EPA. The government authorities conducting the national review are marked in bold in Figure 1.19. From the 2016 submission, quality assurance is conducted in two steps, with an annual quality control and verification of the trends, national statistics used and changes in methods, if any. Every year there is also an in-depth review of one sector. In addition, reporting is reviewed annually by the EU and UNFCCC. An in-depth review of each sector will take place every five years as long as there are no specific recommendations from the EU or UNFCCC reviews, there were no changes in methodology, or the first-step review did not signal any problems. Sweden has also initiated meetings with experts from Denmark, Finland and Norway where GHG
inventory compilers discuss problems, the need for revised methods and other relevant matters.
Finalisation, publication and submission
The preliminary results are published nationally in late November or early December each year. The Swedish EPA supplies a draft report to the Ministry of the Environment in the beginning of January. The EPA submits the inventory to the EU on 15 January and to the UNFCCC on 15 April.
Follow-up and improvements
Each year, suggestions for improvements from the national and international reviews, and from SMED and the Swedish EPA, are compiled into a list. Based on this list,
4 http://www.lagboken.se/Views/Pages/GetFile.ashx?portalId=56&cat=24593&docId=22326 59&propId=5
priorities are set and development work is carried out in preparation for the next year’s reporting. Any suggestions not implemented one year remain on the list for
consideration in subsequent years.
1.3.5. Information on changes in the national system for GHG inventory
There have been no changes in the Swedish national system since the previous Biennial Report.
1.4. The national system for policies
and measures and projections
According to Article 12 of Regulation (EU) No 525/2013 of the European Parliament and the Council on a mechanism for monitoring and reporting greenhouse gas emissions and for reporting other information at national and Union level relevant to climate change every member state needs to have this national system. The Swedish national system for policies and measures and projections was established in 2015. Its aim is to ensure that policies and measures and projections to the Secretariat of the Convention (UNFCCC), the Kyoto Protocol (19/CMP.1) and the European Commission are reported in compliance with specified requirements.
1.4.1. Legal arrangements
The legal basis for Sweden’s national system for policies and measures and projections is the same as for the annual greenhouse gas inventory and is provided by the
Ordinance on Climate Reporting4 (SFS 2014:1434). See
more information of the Ordinance under section 1.2.1.1. The Ordinance includes all reporting according to (EU/ No 525/2013/EC on a mechanism for monitoring and reporting greenhouse gas emissions and for reporting other information and Union level relevant to climate change (EU/No/525/2013)).
GOVERNMENT AGENCIES
Swedish Energy Agency
Swedish Transport Administration Swedish Transport Agency
Transport Analysis
Swedish Board of Agriculture
Swedish University of Agricultural Sciences (SLU)
Swedish Forest Agency
MINISTRY OF ENVIRONMENT AND ENERGY CONSULTANTS SMED IVL – Swedish Environmental Research Institute
SMHI – The Swedish Meteorological and Hydrological Institute SCB – Statistics Sweden SLU – Swedish University of Agricultural Sciences
UNFCCC
SWEDISH ENVIRONMENTAL PROTECTION AGENCY
EU
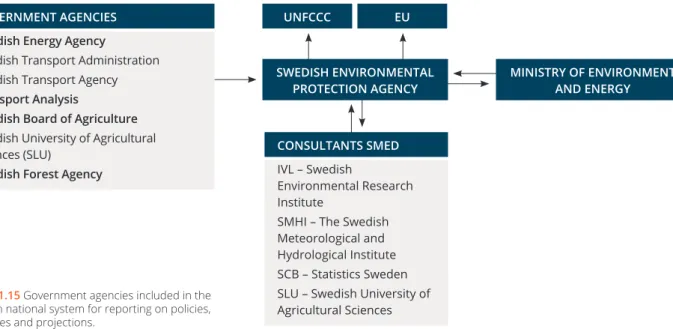
Figure 1.15 Government agencies included in the Swedish national system for reporting on policies, measures and projections.
Information on GHG emissions and removals and trends, GHG inventory including information on national system | 15
Accompanying the Ordinance on Climate Reporting, formal agreements between the Swedish EPA and the concerned agencies have been established, specifying in detail the content and timetable for each agency for providing information on policies and measures and projections.
1.4.2. Institutional arrangements
To prepare the reporting on policies and measures and projections, cooperation takes place between the Ministry of the Environment and Energy, the Swedish EPA and other government agencies, see Figure 1.15.
The Ministry of the Environment and Energy is responsible for the national system and for ensuring that Sweden meets international reporting requirements in the area of climate change.
The Swedish EPA is responsible for producing the reports for the required reporting. The agency is thus responsible for coordinating Sweden’s national system and for maintaining the necessary reporting system.
The other government agencies are responsible for providing the data and documentation necessary for reporting. In some cases, the agencies are responsible for peer review of different sectors.
The same contract to consultants (SMED5) as for the
GHG inventory is used in the institutional process of policies and measures and projections.
1.4.3. Contact details of organisation responsible
The contact details are the same as for Sweden’s national system for the GHG inventory (section 1.3.3).
1.4.4. Inventory planning, preparation and management
The national system is designed to ensure the quality of the reporting on policies and measures and projections, i.e. to ensure its transparency, consistency, comparability, completeness, accuracy and timeliness. The process for reporting applies a plan-do-check-act approach.
Planning and development
The report on policies and measures and projections are planned in due time before reporting. The report is compiled and includes quality control activities.
Work on the report on projections starts one year before submission and includes planning and defining assumptions and sensitive alternatives. Underlying projections on activity data are provided by several government agencies. The projections on emissions are then produced and compiled by the Swedish EPA.
Work on the Policies and Measures (PaMs) report starts one year before submission and includes planning activities. The information on policies and measures is compiled by the Swedish EPA. Government agencies, in accordance with the Ordinance, then perform quality assurance activities.
5 SMED = Svenska Miljö Emissions Data (Swedish Environmental Emissions Data), a consortium comprising Statistics Sweden (SCB), the Swedish Meteorological and Hydrological Institute (SMHI), IVL Swedish Environmental Research Institute and the Swedish University of Agricultural Sciences (SLU).
Preparation
The relevant assumptions, methodologies and models for producing the report on policies and measures and projections, are selected when planning the report. The work is based on established methods and models that have been used for many years and assessed to be the most relevant and suitable. The methodologies and models are continuously assessed and improved. Assumptions are made based on available data and on expert knowledge. Several government agencies are responsible for providing data according to the Ordinance and agreements. The Swedish EPA collects the additional data needed for reporting on policies, measures and projections and produces the reports.
Quality control and quality assurance
To ensure timeliness, transparency, accuracy, consistency, comparability and completeness, quality control activities are performed in parallel with work on projections and compilation of the information on policies and measures. Quality assurance activities are then performed according to the Ordinance before decision and submission of the report. The timetables for quality assurance are included in the agreements between the government agencies and the Swedish EPA.
All data are subjected to general quality control activities throughout the process before submission. Quality assurance is carried out in the form of a national peer review by relevant government agencies, as provided in the Ordinance. The national review covers transparency, completeness, consistency, accuracy and comparability.
Finalisation and submission
After quality assurance activities and, if needed, adjustments of the report, the Swedish EPA submits the reports to the EU on 15 March biennially, in years when the Biennial Report is not produced.
Follow-up and improvements
The review identifies potential areas for improvement in future reporting. The findings are documented in the review report. For projections, sensitivity analyses are performed by applying a range of lower and higher estimates to the key assumptions.
1.4.5. Information on changes in the national system for policies and measures and projections
There have been no changes in the Swedish national system since the previous Biennial Report.
16 | Information on GHG emissions and removals and trends, GHG inventory including information on national system
1.5. References
National Inventory Report Sweden 2017, Greenhouse gas emission Inventory 1990 – 2015, Submitted under UNFCCC and the Kyoto Protocol.
EU/No/525/2013, Regulation No 525/2013/EC on a mechanism for monitoring and reporting greenhouse gas emissions and for reporting other information and Union level relevant to climate change and repealing decision No 280/2004/EC
(SFS 2014:1434), Svensk Författnings Samling; Klimatrapporteringsförordning, 2014:1434
SFS 2009:400, Svenska Författnings Samling Offentlighets- och sekretesslag, SFS 2009:400.
19/CMP.1, Guidelines for national systems under Article 5, paragraph 1, of the Kyoto Protocol
24/CP.19, Revision of the UNFCCC reporting guidelines on annual inventories for Parties included in Annex I to the Convention
Quantified economy-wide emission reduction target | 19
2.
Quantified economy-wide
emission reduction target
6 FCCC/SB/2011/INF.1/Rev.1 of 7,June 2011
7 The EU submission is documented in FCCC/AWGLCA/2012/MISC.1 from 24 April 2012 with the title “Additional information relating to the quantified economy-wide emission reduction targets contained in document FCCC/SB/2011/INF.1/Rev.1”
8 Presentation provided by Arthur Runge-Metzger on ‘Clarification of developed country Parties’ pledges’ at UNFCCC Workshop on clarification of the developed country Parties quantified economy-wide emission reduction targets and related assumptions and conditions (AWG-LCA 15) on 17 May 2012, available at: https://unfccc.int/files/bodies/ awg-lca/ application/pdf/02_eu.pdf.
This chapter explains the pledge of the EU and its Member States under the Climate Change Convention and the Swedish national target for 2020 and 2045.
2.1. The pledge of the European
Union and Members States under
the Climate Change Convention
The EU submitted a pledge in 2010 to reduce GHG emissions by 20 % compared with 1990 levels by 2020 (FCCC/CP/2010/7/Add.1). Because this target under the Convention was only submitted by the EU and its 28 Member States together (EU-28) and not by each Member State, there are no specified Convention targets for individual Member States. For this reason, Sweden, as part of the EU-28, takes on a quantified economy-wide emission reduction target jointly with all other Member States. See Table 2.1 for key facts of the Convention target of theEU-28. In addition to the Convention target, the EU and its Member States have a commitment under the Kyoto protocol for the period 2013–2020. For the EU as a whole, the Kyoto commitment is the same as the Convention target except that it also includes LULUCF (excluding aviation emissions).
The definition of the Convention target for 2020 is documented in the revised note provided by the UNFCCC secretariat6. In addition, the EU provided additional
information relating to its quantified economy-wide emission reduction target in a submission as part of clarifying the developed country Parties’ targets in 20127. In a workshop
that also formed part of this clarification process, the EU gave a presentation of its target in May 20128.
With the 2020 climate and energy package, the EU has set internal rules which underpin the implementation of the target under the Convention. The 2020 climate and energy
Table 2.1 Key facts of the Convention target of the EU-28 and by that also Sweden
Parameters Targets
Base year 1990
Target year 2020
Emission reduction target –20 % in 2020 compared with 1990
Gases covered CO2, CH4, N2O, HFCs, PFCs, SF6
Global warming potential AR4
Sectors covered All IPCC sources and sectors, as measured by the full annual inventory, partly international aviation. Land Use, Land-Use Change,
and Forests (LULUCF) Excluded
Use of flexible mechanisms Possible to certain extent under the EU Emissions Trading System (EU ETS) and the Effort Sharing Decision (ESD). Others
Conditional offer to move to a 30 % reduction by 2020 compared with 1990 levels as part of a global and comprehensive agreement for the period beyond 2012, provided that other developed countries commit themselves to comparable emission reductions and that developing countries contribute adequately according to their responsibilities and respective capabilities.
20 | Quantified economy-wideemission reduction target
package introduced a clear approach to achieving the 20 % reduction of total greenhouse gas emissions from 1990 levels, which is equivalent to a 14 % reduction compared with 2005 levels. This 14 % reduction objective is divided between two sub-targets, where two thirds (21 %) of the reduction effort was assigned to the Emission Trading System (ETS EU Directive No 2009/29) and one third (10 %) to non-ETS sectors (EU Decision No 406/2009). Under the revised EU ETS Directive (EU Directive No 2009/29), one single EU ETS cap covers all EU Member States and the three participating non-EU Member States (Norway, Iceland and Liechtenstein), i.e. there are no further differentiated caps by country. For allowances allocated to the EU ETS sectors, annual caps have been set for the period from 2013 to 2020; these decrease by 1.74 % annually, starting from the average level of allowances issued by Member States for the second trading period (2008–2012). The annual caps imply interim targets for emission reductions in sectors covered by the EU ETS for each year until 2020. For more information on the EU ETS, see the third Biennial Report from EU.
Historical emissions Domestic aviation Trajectory ESD
National target 2020 Emissions ESD
2030 Emissions EU ETS (exkl. aviation)
Mt CO 2 -eq. 0 20 40 60 80 2035 2040 2045 2030 2025 2020 2015 2010 2005 2000 1995 1990
Figure 2.1 Historic and projected GHG emissions, separated into emissions included in the EU ETS and emissions covered by ESD9,10.
In 2015, verified emissions from stationary installations covered under the EU ETS in Sweden totalled 19.2 Mt CO2-eq. With total GHG emissions of 53.7 Mt CO2-eq (without LULUCF), the share of ETS emissions is 36 %. The monitoring process for the ETS is harmonized for all EU Member States,(Commission Regulation No 601/2012). The use of flexible mechanisms is possible under the EU ETS. For more information on the use of CER and ERU under ETS, see the third Biennial Report from EU. Non-ETS emissions are addressed under the Effort Sharing Decision (ESD) (Decision No 406/2009). The ESD covers emissions from all sources outside the EU ETS, except for emissions from international maritime, domestic and international aviation (which were included in the EU ETS from 1 January 2012) and emissions and removals from LULUCF. It thus includes a diverse range of small-scale emitters in a wide range of sectors: transport
9 Note1: GHG emissions (submission 2017) excluding sources and sinks of LULUCF.
10 Note2: ETS emissions are corrected to take into account the extended scope of the EU ETS for the third trading period.
(cars, trucks), buildings (heating in particular), services, small industrial installations, fugitive emissions from the energy sector, emissions of fluorinated gases from appliances and other sources, agriculture and waste. Such sources currently account for about 60 % of total greenhouse gas emissions in the EU.
While the EU ETS target is to be achieved by the EU as a whole, the ESD target was divided into national targets to be achieved individually by each Member State. In the ESD, national emission targets for 2020 are defined as shares of the emission levels in 2005. These shares have been translated into binding quantified annual reduction targets for the period 2013 to 2020 (EU Commission decision of 26 March 2013) (Commission Implementing Decision of 31 October 2013), expressed in Annual Emission Allocations (AEAs). Sweden has committed to reducing emissions in sectors covered by the ESD by 17 % compared with 2005 emissions. The quantified annual reduction target is 41.7 million AEAs for 2013, decreasing to 37.2 million by 2020 (adjusted to 2013–2020 ETS period). The binding quantified annual reduction targets were revised (Commission Decision No 2017/1471), for the years 2017–2020, in August 2017, which means that the allocation for 2020 was reduced from 37.2 million AEAs to 36.1 million AEAs.
The modalities and procedures for monitoring and review under ESD are harmonised for all EU member States by Monitoring Mechanism Regulation (EU/No/525/2013). The use of flexible mechanisms is possible under the ESD. The ESD allows Member States to make use of flexibility provisions for meeting their annual targets, with certain limitations. There is an annual limit of 3 % for the use of project-based credits for each Member State. These are not used in any specific year; the unused part for that year can be transferred to other Member States or banked for own use until 2020. Because Sweden (together with Austria, Belgium, Cyprus, Denmark, Finland, Ireland, Italy, Luxemburg, Portugal, Slovenia and Spain) fulfils the criteria for using additional credits as stipulated in ESD Article 5(5), an additional use of credits is possible from projects in Least Developed Countries (LDCs) and Small Island Developing States (SIDS) up to an additional 1 % of their verified emissions in 2005. For Sweden these are 0.456 million ERs and ERUs. These credits are not bankable or transferable.
2.2. Sweden’s national emission
reduction targets – exceeding European
targets
2.2.1. The Swedish target for 2045
In June 2017, the Riksdag adopted a proposal on a climate policy framework for Sweden which will give Sweden an ambitious, long-term and stable climate policy. The climate policy framework consists of a climate act, new climate
Quantified economy-wideemission reduction target | 21
Historical emissions Climate target Climate targets in new Climate Policy Framework
Sweden’s emissions in total –25 %
1990–2015 Zero netby 2045
Max 15 % supplementary measures
Emissions from sectors
outside the EU ETS 1990–2015–27 % –40 %by 2020
Max 33 % supplementary measures
–63 % by 2030
Max 8 % supplementary measures
–75 % by 2040
Max 2 % supplementary measures
Emissions from domestic transports
–11 % 1990–2015
Excl. domestic aviation
–70 % by 2030
Compared to 2010
targets and a climate policy council. For more information about the climate policy framework, see Sweden’s Seventh National Communication on Climate Change.
Targets
• By 2045, Sweden is to have no net emissions of greenhouse gases into the atmosphere and should thereafter achieve negative emissions. This means emissions from activities in Swedish territory are to be at least 85 % lower by 2045 compared with 1990. Supplementary measures may count towards achieving zero net emissions, such as increased uptake of carbon dioxide in forests and land, and investments in other countries. International accounting guidelines will be followed for this.
• Emissions in Sweden outside of the EU ETS should, by 2030, be at least 63 % lower than emissions in 1990, and by 2040 at least 75 % lower. To achieve these targets by 2030 and 2040, no more than 8 and 2 percentage points, respectively, of the emissions reductions may be realised through supplementary measures.
• Emissions from domestic transport are to be reduced by at least 70 % by 2030 compared with 2010. Domestic aviation11 is not included in the goal since this subsector
is included in the EU ETS.
2.2.2. The Swedish target for 2020
To provide a clear structure for environmental efforts in Sweden, the Riksdag has adopted 16 environmental quality objectives. One of these, Reduced Climate Impact, forms the basis for climate change action in the country. Current climate policy is also set out in two Government Bills, entitled An Integrated Climate and Energy Policy, passed by the Riksdag in June 2009 (Govt. Bills 2008/09:162 and 163). The first of these Bills sets a national milestone target for climate, calling for a 40 % reduction in emissions by 2020 compared with 1990. If the target in 2020 is met,
greenhouse gas emissions from the non-ETS sector would be around 20 million tonnes of carbon dioxide equivalent lower than in 1990. This target applies to activities not
11 The emissions only includes CO2.
included in the EU Emissions Trading System and does not include the LULUCF sector. In addition, the Bills also set targets for energy efficiency and renewable energy (see Boxes 2.1 and 2.2).
BOX 2.1 Sweden’s renewables target for 2020
The EU has adopted a mandatory target requiring a 20 % share of energy from renewable sources in overall energy consumption by 2020. Responsibility for meeting the target has been divided among the Member States. Based on the agreed burden sharing, the target for Sweden’s renewable energy share in 2020 is 49 %. The Riksdag has decided that, by that year, renewable sources are to provide at least 50 % of total energy consumed. The share of renewable energy in the transport sector, meanwhile, is according to an EU target to be at least 10 %.
BOX 2.2 Sweden’s energy efficiency target for 2020
The EU has adopted a target of a 20 % improvement in energy efficiency by 2020. This target has not been broken down among the individual Member States. Sweden has chosen to express its national target for improved energy efficiency by 2020 as a 20 % reduction in energy intensity between 2008 and 2020, which means that the energy supplied per unit of GDP at constant prices shall decrease over that period.
22 | Quantified economy-wideemission reduction target
2.3. Reference
FCCC/SB/2011/INF.1/Rev.1 of 7, June 2011,
Compilation of economy-wide emission reduction targets to be implemented by Parties included in Annex I to the Convention
EU Directive 2009/29, of the European Parliament and of the Council of 23 April 2009 amending Directive 2003/87/EC so as to improve and extend the greenhouse gas emission allowance trading scheme of the Community (OJ L 140, 05.06.2009, p. 63) (http:// eur-lex.europa.eu/LexUriServ/ LexUriServ.do?uri=OJ:L:2009:140:00 63:0087:en:PDF). Commission Regulation (EU) No 601/2012 of 21 June 2012 on the monitoring and reporting of greenhouse gas emissions pursuant to Directive 2003/87/EC of the European Parliament and of the Council EU Commission decision of 26 March 2013 on determining Member States’ annual emission allocations for the period from 2013 to 2020 pursuant to Decision No 406/2009/EC of the European Parliament and of the Council
(2013/162/EU). Commission Implementing Decision of 31 October 2013 on the adjustments to Member States’ annual emission allocations for the period 2013 to 2020 pursuant to Decision No 406/2009/ EC of the European Parliament and of the Council (2013/634/EU).
Commission Decision (EU) 2017/1471 of 10 August 2017 amending Decision 2013/162/EU to revise Member States’ annual emission allocations for the period from 2017 to 2020 (notified under document C(2017) 5556) EU/No/525/2013, Regulation No 525/2013/EC on a mechanism for monitoring and reporting greenhouse gas emissions and for reporting other information and Union level relevant to climate change and repealing decision No 280/2004/EC
Govt. Bill 2008/09:162: En sammanhållen klimat- och energipolitik – Klimat. Ministry of the Environment. Govt. Bill 2008/09:163: En sammanhållen klimat- och energipolitik – Energi. Ministry of Enterprises, Energy and Communications.