83
1AgriMet Program Coordinator, U.S. Bureau of Reclamation, Pacific Northwest
Region, 1150 N. Curtis Road, Suite 100 Boise, Idaho 83706-1234, (208) 378-5283. ppalmer@pn.usbr.gov
ABSTRACT
Competition for limited water resources in the western United States continues to increase. In most western states, irrigated agriculture is the largest single
consumer of water. To help improve irrigation efficiency, the Bureau of
Reclamation and Bonneville Power Administration partnered to create a network of automated agricultural weather stations - called “AgriMet” - in the Pacific Northwest. These stations collect and telemeter the meteorological parameters required to model crop evapotranspiration (ET). The information is used by irrigation districts, farmers, resource conservation agencies, and agricultural consultants for irrigation scheduling and related purposes. Since the initial installation of 3 stations in 1983, the network has grown to over 60 stations in Reclamation’s Pacific Northwest region, 21 stations in the Great Plains Region in Montana, and seven stations in the Mid Pacific region. These automated weather stations transmit their data by the GOES satellite, and the information is used in the Kimberly-Penman 1982 evapotranspiration model to compute reference ET at each station. Crop coefficients are then applied to estimate water use for specific crops grown at each station for every day of the growing season. This
information is available on the Internet, and is integrated into various on-farm technical assistance programs by local agricultural consultants, the Cooperative Extension Service, and the USDA Natural Resources Conservation Service. Use of AgriMet information in irrigation scheduling results in water and energy savings, reduced soil erosion, and protection of surface and ground water
supplies. Various agricultural consultants have reported water and power savings ranging from 15 to 50 percent (Dockter, 1996). Some irrigators have reported real savings of as much as $25 per acre in pumping costs after using AgriMet ET data to schedule their irrigations (Palmer, 2004).
INTRODUCTION
Modeling evapotranspiration (ET) with weather data has evolved over the years with refinements in modeling procedures and data collection methods. Current technologies typically involve automated agricultural weather stations and data transfer by satellite, phone, radio, or wireless networking. Powerful computers
now make fast work of the typically complex mathematical ET models, and the Internet makes the information almost instantly available to the users.
The U.S. Bureau of Reclamation partnered with Bonneville Power Administration in 1983 in an effort to promote efficient irrigation water use. This partnership resulted in the installation of a network of automated agricultural weather stations called “AgriMet” (for Agricultural Meteorology) in the Pacific Northwest. These stations collect and telemeter the meteorological parameters required to model crop evapotranspiration (ET). Since the initial installation of 3 stations in 1983, the network has grown to over 60 stations in Reclamation’s Pacific Northwest region, 21 stations in the Great Plains Region in Montana (east of the Continental Divide), and seven stations in the Mid Pacific region. Reclamation has
established partnerships with more than 25 entities, including other federal and state agencies, soil and water conservation districts, universities, public utilities, and private businesses to help fund the operation of the AgriMet network. The Northwest Energy Efficiency Alliance, a consortium of electric utilities in the Northwest, provides significant financial support for the AgriMet network.
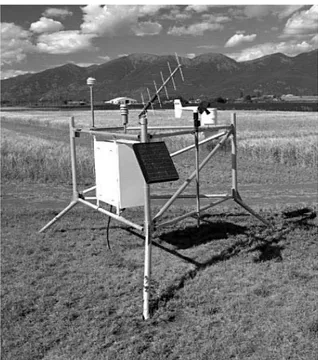
Figure 2. Typical AgriMet Weather Station
AGRIMET DATA COLLECTION AND TRANSMISSION
AgriMet stations are located in agricultural areas throughout Idaho, Montana, Oregon, and Washington, with additional stations located in northern California, western Wyoming, and Nevada. The stations are typically located on the edge of irrigated fields so that the observed weather data approximates the meteorological conditions affecting the cultivated crops in the area (Fig. 2). Each AgriMet station is configured with a standard set of sensors, including air temperature, precipitation, solar radiation, wind speed and direction, and relative humidity. These standard sensors measure the meteorological parameters required for modeling crop ET. Some sites have special sensors, including soil temperature, diffuse pyranometers for special solar radiation studies, crop canopy temperature, leaf wetness, and evaporation pan sensors.
All the weather station components, including sensors, solar panel, antenna, data logger and transmitter are mounted on a sturdy aluminum tripod. Sensors are mounted at standard sensor heights for agricultural weather data collection requirements. Power for each weather station is provided by a heavy duty lead acid storage battery that is recharged daily by a solar panel.
The data logger at the site monitors each of the sensors once every second. These readings are used to derive the final data parameters for subsequent transmission, such as 15 minute air temperature observations, total hourly precipitation, etc. These parameters are transmitted from the weather stations via the GOES satellite
(Geostationary Operational Environmental Satellite) to a receive site at the
Bureau of Reclamation’s Pacific Northwest Regional Office in Boise, Idaho. The receive site also down-links data for other Reclamation programs, as well as for other cooperating federal agencies. An effort is currently underway to upgrade all AgriMet stations from one transmission every four hours to hourly transmissions, improving the timeliness and hence the usefulness of the weather data. As of 2006, well over half the AgriMet stations have been upgraded to transmit on an hourly basis.
All AgriMet sites receive an annual maintenance and inspection visit in the spring that includes calibration and maintenance of all sensors. Data logger and
transmitter parameters are checked for conformance to specifications. System battery voltage, solar panel output, and voltage regulator output are checked; these items are replaced or adjusted as needed. All sensors are compared against laboratory calibrated standards and are adjusted or replaced as needed. This special attention given to the sites during these annual calibration and
maintenance visits provides high quality meteorological data not only for crop water use modeling, but also for a variety of research and other weather related applications.
Data Quality Control Procedures
Upon receipt of the weather data from the GOES satellite, it is subjected to a variety of automated quality control procedures. These validation tests include a check of satellite transmission data quality parameters, upper and lower value limit tests, and rate of change tests. If the incoming data fails any of these checks, it is marked with a flag indicating the nature of the failure before being added to the database. These flagged values are not used in subsequent calculations, such as computation of average daily temperatures or daily ET rates. After these automated quality control processes are completed, the 15 minute (and hourly) data are stored in a “dayfiles” database. Standard AgriMet dayfile parameters include instantaneous air temperature and relative humidity, computed dew point, peak wind gust, average wind speed and wind direction -- all on 15 minute intervals. Hourly data includes accumulated wind run, accumulated solar radiation, and accumulated precipitation.
Between 5:00 and 5:30 am each morning, several automated processes run on the dayfiles data, producing summary parameters for the previous day, including daily maximum, minimum, and average air temperatures, total daily wind run, average wind direction, peak wind gust, total daily precipitation, total daily solar radiation, mean relative humidity, mean dew point, and reference ET. These data are stored in an “archive” database. All of the historical weather information (both hourly/15 minute and daily summaries) are available on the AgriMet website for the period of record.
In addition to the automated checks, a manual quality control review is performed on the data each working day. These procedures include review of satellite transmission quality parameters that may point to data quality problems not detected by the automated procedures. Other checks include graphical review of sensor data by groups of sites that have similar climatic characteristics. Apparent anomalies are examined for possible data quality problems, and bad data are removed or estimated. Archive parameters and ET values are then recalculated using the revised data parameters. These changes are then reposted to the
AgriMet website. AgriMet’s quality control procedures result in a very complete, accurate, and timely database of meteorologic information, easily available on the Internet.
EVAPOTRANSPIRATION MODELING
AgriMet uses the 1982 Kimberly-Penman equation for computing reference ET, adapted by Dr. James L. Wright of the USDA Agricultural Research Service through his research performed in Kimberly, Idaho (Jensen et al., 1990). This procedure requires several meteorological inputs for modeling ET, including maximum and minimum daily air temperatures, relative humidity, daily solar radiation, and daily wind run. All of these parameters are collected by the AgriMet system.
The 1982 Kimberly-Penman uses alfalfa as the reference crop with reference conditions defined as a well-watered alfalfa crop with 30 to 50 cm of top growth. The equation, as implemented in the AgriMet program, is represented as:
6.43 W (e -e ) + + G) -R ( + = ET r n γ f s a γ γ λ ∆ ∆ ∆ (1) Where:
λ ETr is reference evapotranspiration
∆ is the slope of the saturation vapor pressure-temperature curve
γ is the psychrometric constant Rn is the net radiation
G is the soil heat flux
6.43 is the constant of proportionality in MJ/m2/d/kPa. Wf is the dimensionless wind function
(es - ea) is the mean daily vapor pressure deficit in kPa.
Because of the variability of ET rates from crop to crop and the complexity of modeling ET, the accepted standard for deriving crop specific ET (ETc) is to model ET for a reference crop, such as alfalfa (ETr), and then apply this reference ETr value to specific crops through the use of crop coefficients (Kc). These crop coefficients are unique to the reference crop and the individual specific crop, and
they vary through time with the growth stage of the plant. These crop coefficients typically are expressed as percent of water use compared to the reference crop (see figure 3). In equation form, the crop coefficient methodology is represented as:
ETc = ETr * Kc (2)
Where:
ETc = Crop specific evapotranspiration
ETr = Reference evapotranspiration (alfalfa reference) Kc = Crop coefficient for a specific crop.
Figure 3. Example of Crop Coefficient Curve used by AgriMet These crop coefficients have been developed by a variety of researchers and research methods (Jensen, et al., 1990). Most of the crop coefficients used by AgriMet, however, were developed using weighing lysimeters at the USDA ARS Research Center in Kimberly, Idaho. Application of these crop coefficients requires, at a minimum, knowledge of the emergence date (or green up date, in the case of perennial plants) for each crop in the vicinity of each weather station. Local contacts (such as county extension agents, crop consultants, or producers) provide this input each spring in order to calibrate the AgriMet crop models to local conditions for that year. The result is a table of daily ET for each crop grown in the vicinity of each AgriMet station (Table 1).
DISSEMINATION OF AGRIMET INFORMATION
There are four major products provided by the AgriMet program:
• A table of daily ET values for the last five days for a reference crop (Alfalfa) and specific crops grown in the area. This table includes a 7-day, 14-day, and growing season ET total. In addition, a forecast of ET for the current day is displayed (based on the average of the last three days ET value) (see Table 1). • A table of weather parameters for the last 5 days or 10 days for each station. • A summary of ET for each day of the growing season for each crop grown in
the vicinity of each station.
• Historical weather and crop water use data for all stations for the entire period of record.
All of these products are available from Reclamation’s AgriMet website at http://www.usbr.gov/pn/agrimet. Information for the Great Plains AgriMet program (east of the continental divide in Montana) is available at
http://www.usbr.gov/gp/agrimet/index.cfm. Several local newspapers in the region publish AgriMet crop water use during the growing season, providing an additional means of local dissemination. AgriMet information is further
distributed to the user by county extension agents, producer cooperatives, and crop consultants.
USES OF AGRIMET PRODUCTS AND INFORMATION
AgriMet crop water use information is integrated into various on-farm technical assistance programs by local agricultural consultants, the Cooperative Extension Service, and the USDA Natural Resources Conservation Service. As competition for limited water supplies increases - as well as the cost of pumping for irrigation - farmers are turning more and more to scientific irrigation scheduling.
Table 1. Daily AgriMet Crop Water Use Chart
| ESTIMATED CROP WATER USE - JUL 6, 1998 Ashton, Idaho | | ---| | | DAILY | | | | | | | | | CROP WATER USE-(IN) | DAILY| | | | 7 | 14 | | CROP START| PENMAN ET - JUL | FORE |COVER| TERM| SUM | DAY| DAY | | DATE|---| CAST | DATE| DATE| ET | USE| USE | | | 2 3 4 5 | | | | | | | |---|---|---|---|---| |ALFALFA 501| 0.35 0.32 0.29 0.23 | 0.28 | 625 | 925 | 9.3 | 2.0| 3.3 | |---|---|---|---|---| |PASTURE 420| 0.24 0.22 0.20 0.16 | 0.19 | 610 | 925 | 8.1 | 1.4| 2.3 | |---|---|---|---|---| |LAWN 420| 0.28 0.26 0.23 0.18 | 0.22 | 601 | 925 | 9.9 | 1.6| 2.7 | |---|---|---|---|---| |W GRAIN 415| 0.35 0.32 0.29 0.23 | 0.28 | 625 | 815 | 12.1 | 2.0| 3.3 | |---|---|---|---|---| |S GRAIN 520| 0.34 0.31 0.29 0.23 | 0.28 | 801 | 901 | 5.6 | 2.0| 3.2 | |---|---|---|---|---| |POTATO 620| 0.12 0.12 0.11 0.09 | 0.11 | 815 |1015 | 1.2 | 0.7| 1.1 |
---The most common method for irrigation scheduling is known as the “checkbook method,” accounting for deposits and withdrawals to the soil moisture balance. For this procedure, the farmer must first know the plant root depth and water holding capacity of his soil. This information is typically available from detailed soil surveys of the area, or from site specific soil tests. After each irrigation during the growing season, the farmer tracks the daily crop specific ET, available from AgriMet. When the cumulative water use equals the Management
Allowable Depletion (MAD) for that crop, it’s time to irrigate again. Specific knowledge of the irrigation system, combined with ET information from AgriMet, allows a farmer to apply the right amount of water at the right time for optimum crop production. Not only does the farmer realize savings in water and pumping costs, but reduced leaching results in reduced costs for fertilizer, herbicides, and pesticides. Various agricultural consultants have reported water and power savings ranging from 15 to 50 percent through the use of AgriMet supplied ET data (Dockter, 1996). Some irrigators have reported real savings of as much as $25 per acre in pumping costs after using AgriMet ET data to schedule their irrigations (Palmer, 2004). Indirect benefits of scientific irrigation scheduling include reduction in non-point source surface water pollution (through reductions in nutrient and chemical laden irrigation tail water) as well as protecting ground water supplies through reduced leaching of agricultural chemicals.
AgriMet ET information is being extensively used by irrigators for on-farm irrigation water management. In a study conducted for the Bonneville Power Administration, “on-line services, primarily AgriMet, are the most commonly used source for obtaining this (ET) information and account for 45 percent of cases. These figures, however, under-represent the actual use of ET information, particularly from AgriMet, since they do not take into account cases where commercial irrigation service providers provide this data” (Kema-Xenergy, Inc., 2003).
Through scientific irrigation scheduling, AgriMet offers significant opportunities for farmers and irrigators to reduce their use of limited irrigation water supplies. There are financial incentives to do so, beyond just the costs of water and the power required to move it. For example, in a case study conducted by Oregon State University (English, 2002), an economic analysis was conducted on a 125 acre center pivot of potatoes in Washington supplied by a pump with 700 feet of total lift . Assuming 19% excess water use (a typical value, according to the study), and a low sensitivity to the excess water (resulting in a 3% yield loss), the extra costs to the farmer included:
Energy Cost: $ 1,490 Nitrogen Leaching: $ 5,625 Yield Reduction: $ 10,890
In the Lake Chelan area of Washington, the local irrigation district uses AgriMet data for site-specific irrigation scheduling (Cross, 1997). Manual soil moisture measurements are taken weekly at 2-4 sites per orchard in over 60 fruit orchards in the area. Daily AgriMet data is used to monitor the crop water use between field measurements. The soil moisture is plotted on a time series graph, showing soil moisture content at several depths through the growing season. When the AgriMet ET data indicates that the soil moisture has dropped to the management allowable depletion level, the producer irrigates the orchard. The next field measurement shows the new soil moisture levels, and the daily consumptive use values from AgriMet are systematically subtracted from the soil moisture levels until the next irrigation is scheduled. This process is repeated throughout the growing season, and updated information is provided to each producer on the same day the soil moisture measurements are taken.
AgriMet weather data are used for a variety of applications in addition to ET computation, and requests for current and historical weather information from the AgriMet network are common. Agricultural producers depend on wind speed and direction for scheduling such practices as field burning and pesticide applications. Weather data is used by state DEQ’s for investigating pesticide application and ground water contamination issues. The National Weather Service uses AgriMet weather data for short term forecasting and forecast verification. Several electric utilities use the weather information to forecast daily energy requirements,
including peaking power. University researchers frequently use AgriMet data for a variety of applications, ranging from regional consumptive water use modeling to locating new orchards. ET information is being used by other agencies, such as the National Resources Conservation Service, to document compliance with irrigation water management practices on individual farm tracts. Increasingly, ET information from weather station networks is being used in water rights
management by state water resource agencies.
SUMMARY
In the early 1980’s, the U.S. Bureau of Reclamation, in partnership with
Bonneville Power Administration, developed a network of automated agricultural weather stations in the Pacific Northwest. From the original three sites installed in 1983, the AgriMet system has now grown to over 90 sites in Idaho, Oregon, Washington, Montana, Wyoming, and California. Reclamation has cultivated partnerships with over 25 federal, state, and private interests to help fund the operation of the network.
AgriMet stations collect the weather data required for modeling crop
evapotranspiration and transmits this information via satellite to Reclamation’s Regional Office in Boise, Idaho. Every day during the growing season, crop water use charts are developed for crops grown in the vicinity of each AgriMet
station. This information is available daily through the Internet and is also published in many local newspapers throughout the region. The information is used by federal and state agencies, conservation districts, irrigation districts, extension agents, agricultural consultants, corporate farms, and individual irrigators for water management purposes. The weather data collected is also used for a wide variety of other applications. A rigorous field calibration and maintenance program, and data quality assurance program ensures a high level of data quality and integrity.
Competition for limited water resources is increasing, cost of irrigation water and pumping is rising, and concerns for surface and ground water quality are
heightening. In response to these factors, scientific irrigation scheduling is becoming more commonplace. AgriMet is providing the information required to meet these challenges in the Pacific Northwest.
REFERENCES
Cross, Paul., 1997. Lake Chelan Reclamation District, Personal Communication, October, 1997.
Dockter, Douglas T., 1996. “AgriMet - Applied Technology for Agricultural Conservation”. Proceedings of Conserv96, January 4-8, 1996, Orlando, Florida, pp. 41-45. Proceedings published by American Water Works Association, Denver, Colorado.
English, Marshall, 2002. PowerPoint Presentation on Irrigation Scheduling. Oregon State University.
Jensen, M.E., Burman, R.D., and Allen, R.G., editors, 1990. “Evapotranspiration and Irrigation Water Requirements.” Committee on Irrigation Water
Requirements of the Irrigation and Drainage Division of the American Society of Civil Engineers, New York, N.Y.
Kema-Xenergy, Inc., 2003. “A Study of Irrigation Scheduling Practices in the Northwest”. Prepared for Bonneville Power Administration, Portland, Oregon, September 5, 2003. Principal Investigators: Hossein Haeri, Kema-Xenergy and Marshall English, Oregon State University
Palmer, Peter L., 2004. Personal communication with Jeff Harper, an irrigator in Mountain Home, Idaho, who farms 1400 irrigated acres. April 19, 2004.