Impact of Climate Change on Wetland Functions
Duck Gil Kim1, Hui Seong Noh, Na Rae Kang, and Hung Soo KimDepartment of Civil Engineering, Inha University, Korea
Abstract. Recently, there is a growing interest in the wetland management for biodiversity and preservation of ecosystem. One of the problems of the wetland management is climate change due to the global warming, and many studies have shown that the climate change influence on wetlands. Therefore, in this study, we estimated impact of climate change on wetland functions such as hy-drologic, biogeochemical, plant habitat, and animal habitat functions. The study site is the Upo wetland in Korea which is the largest natural wetland in Korea, and the wetland is designated as a ‘Protected Wetland’ by the international Ramsar Convention. We assessed impact of climate change on the wetland functions using climate scenario, climate model, and analysis techniques of climate change. We performed functional assessment of wetland using Hydrogeomorphic (HGM) method. As a result, we found that the about 10% of wetland functions of will change in the future due to the climate change. This case study could be useful as a reference for the future wetland management planning.
Keywords: Climate change, Wetland Function, HGM
1. Introduction
In the past, a lot of wetlands were destroyed due to urbanization and industrialization. But recently, as the fact that wetlands are performing diverse functions has been known to the public, the importance of protection and preservation of wetland has been emphasized. Accordingly, many countries are exerting efforts to protect and preserve wetlands. In case of Korea, the importance of preservation and protection of wetlands has been recog-nized since 1990s and have been exerting diverse efforts to protect and preserve wetlands as well ever since.
Wetlands are ecologically very important as habitats for diverse lives. However, even though there are efforts to assess the influence of climate change in order to establish a wetland management plan, accurate assessment is experiencing difficulties. Climate change will also change the environment of wetland, causing changes in the environment of habitats of living things and the numbers of individuals or species, and the studies for influence of climate change on wetland are underway to assess them. Mortsch (1998) had made an analysis on the influence of climate change on the ecology of wetland and hydro-logical characteristics with the shoreline of the Great Lakes as the subject, and Dawson, etc. (2003) had carried out the water-balance analysis in application of climate change scenario. As a result of their research, it was analyzed that there was a change in water-balance of wetland due to climate changes, and also, there was a change in diversity of species of the living things due to changes in environment of habitats because of the changes in
balance. Withey and Van Kooten (2011) had analyzed the influence of climate change on wetland and water birds. As a result, it was analyzed that there was a change in the area of wetlands due to temperature rise and increase in the amount of precipitation, and the changes in the area of wetland had showed changes in the number of individuals of water birds. Erwin (2009) explained that the environment of wetland habitats is influenced by discharge and water quality, and such discharge and water quality are influenced by cli-mate change, causing changes in the environment of wetland habitats.
Like the above, many researchers have been carrying out studies about the influence of climate change on wetland. Accordingly, in this study, it was intended to assess the influ-ence of climate change on the functions of wetland with the wetlands of Korea as the sub-jects, and to apply HGM (Hydrogeomorphic) Method to assess the functions of wetland. 2. Climate Change Scenario and Climate Model
In this study, SRES A1B Scenario was applied to assess the influence of climate change on the functions of wetland. This scenario, which is generally referred to as SRES, was released as the Special Report on Emission Scenario, together with the 3rd Report of IPCC, which is widely divided into the storylines of A2, B1 and B2. Among them, A1 Scenario is divided into the Scenarios of A1F1 (mainly, fossil fuel is used), A1T (mainly, non-fossil fuel is used) and A1B (fuel considering future energy resources is used) accord-ing to what type of fuel shall be mainly used by the humans in the future. In this study, A1B Scenario was chosen because the entire world is now exerting considerable efforts to maximize the efficiency of the present energy resources and to find out the alternate ener-gy.
It was intended to choose the climate model which is suitable for Korea among the 24 GCM climate models developed from 12 countries through DDC of IPCC. Kyeong, Min-Soo (2010) had examined BCM2, CNCM3, FGOLS and MIHR Models, which are simu-lating the Korean Peninsulas as a land among the GCM Models, and as a result, it was ana-lyzed that CNCM3 is the most suitable climate model for Korea. Accordingly, CNCM3 Model was applied in this study.
3. HGM Method for Wetland Function Assessment
In this study, HGM (Hydrogeomorphic method) developed by US Army Corps of En-gineers was applied to assess the functions of wetland. This method is classifying the wet-lands into riverine, depressional, slope, mineral soil flats, organic soil flats, estuarine fringe and lacustrine fringe in consideration of hydrological aspects and geomorphological as-pects. Study on wetland and reference wetland is required to assess the functions in appli-cation of HGM method. Among the HGM Methods, it was intended to apply the functional assessment method for the riverine, while functional assessment is separated into the as-pects of Hydrologic, Biogeochemical, Plant Habitat and Animal Habitat to carry out with the method to compare the study area and reference area (Brinson, 1993). Each function is displayed in index and the range of such index is from 0.0 to 1.0.
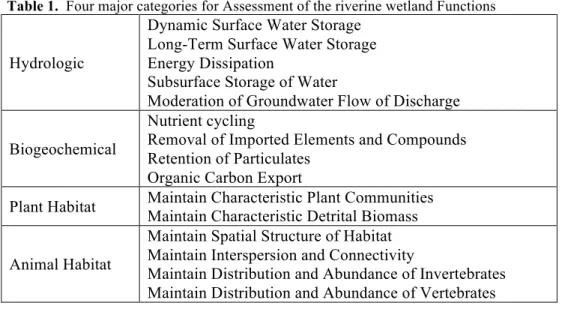
Table 1. Four major categories for Assessment of the riverine wetland Functions
Hydrologic
Dynamic Surface Water Storage Long-Term Surface Water Storage Energy Dissipation
Subsurface Storage of Water
Moderation of Groundwater Flow of Discharge Biogeochemical
Nutrient cycling
Removal of Imported Elements and Compounds Retention of Particulates
Organic Carbon Export
Plant Habitat Maintain Characteristic Plant Communities Maintain Characteristic Detrital Biomass Animal Habitat
Maintain Spatial Structure of Habitat Maintain Interspersion and Connectivity
Maintain Distribution and Abundance of Invertebrates Maintain Distribution and Abundance of Vertebrates 4. Application and Results
In this study, future climate data was simulated in application of Climate Scenario and Climate Model, and such was applied to the functional assessment method of wetland to analyze the influence of climate change on the function of wetland.
4.1 The Study Area
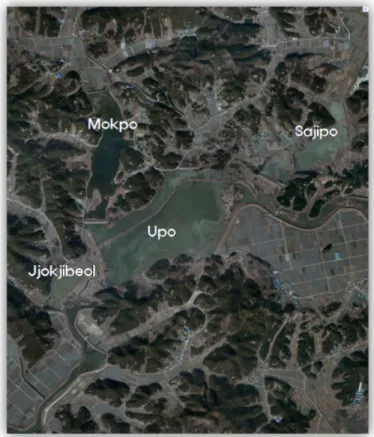
The subject area of this study was Upo wetland, where the yearly average temperature and the amount of precipitation are 13.2°C and 1,112.5mmrespectively. Upo wetland is the largest natural wetland in Korea, located at Changnyeong-Gun. Upo wetland comprises 4 small wetlands; Upo, Mokpo, Sajipo and JJokjibeol (Fig.1). Overall width of Upo wetland is approx. 2.5km, the length is 1.6km, and the area is 2,132,926km2 (Ministry of Construc-tion & TransportaConstruc-tion, 2004). This area has been generally known as Upo Wetland because Upo is the largest among the 4 wetlands. In addition, Upo wetland was designated as a “Protected Wetland’ according to the Ramsar Convention.
4.2 Simulation of Future Weather Data under Climate Change
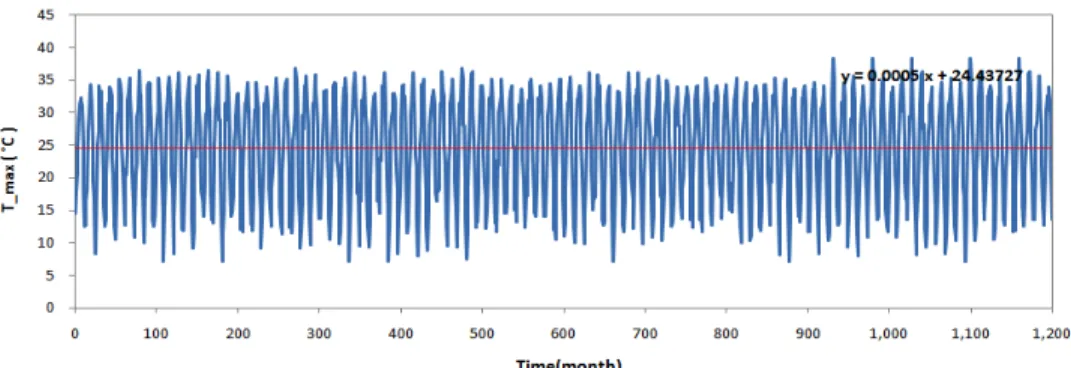
In this study, the future climate data was simulated in application of CNCM3 climate model to examine the influence of climate change on the functions of wetland. Two types of downscaling technique (spatial downscaling and temporal downscaling) were applied to simulate the climate data. Artificial Neural Network Model was applied as the spatial downscaling technique, while NN-GA (Kim, Soo-Jeon, 2011) was applied as the temporal downscaling technique). Simulation period of the future climate data was 100 years (2000~2099).
Monthly climate data during the future period for the place of Weather Station located in the subject area was spatially downscaled in application of the Artificial Neural Network Model. As a result, it was simulated that the monthly average amount of precipitation after 100 years is to increase by approx. 23mm, while the lowest and the highest temperatures
Figure 1. The Upo Wetland
Figure 4. Monthly highest temperature for the future period
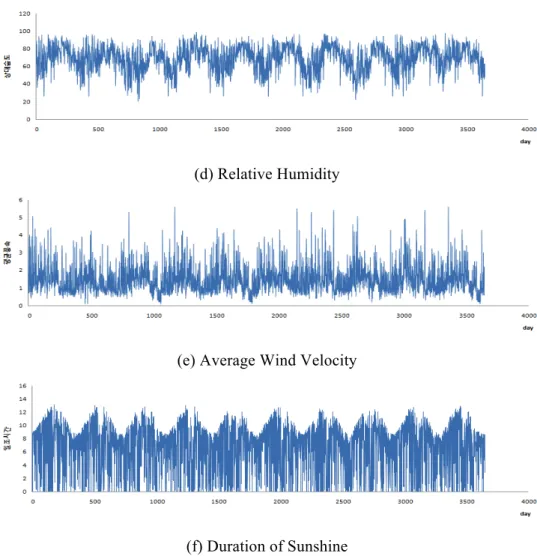
Daily climate model was simulated in application of NN-GA Technique to the monthly climate data simulated in accordance with the Artificial Neural Network Model. NN-GA Technique is a method presented by Kim, Soo-Jeon (2011) in a method to spatially downscaling the climate data. Daily climate data simulated according to NN-GA Tech-nique are the lowest temperature, the highest temperature, amount of precipitation, relative humidity, wind velocity and the quantity of solar radiation. The simulation period of daily climate data is for 100 years (2000~2099), and in this study, the daily climate data for the period from 2090 till 2099 was used to examine the influence of climate change on the functions of wetland (Fig. 5).
(a) Lowest Temperature
(C) Amount of Precipitation
(d) Relative Humidity
(e) Average Wind Velocity
(f) Duration of Sunshine
Figure 4. Daily Climate Data simulated according to NN-GA Technique (2090~2099) 4.3 Impact analysis of climate change on wetland functions
In this study, the functions of wetland were assessed to evaluate the influence of cli-mate change on the wetland functions. Assessment of wetland functions was executed in comparison of the wetland functions at the present and in the future. HGM (Hydrogeo-morphic Method), which was presented by the US Army Corps of Engineers, was applied to assess the wetland functions. HGM is a method to display the wetland function in Index of Function in comparison of the reference wetland and the wetland subject for assessment. The reference wetland is the present Upo wetland, while the target wetland is Upo wetland in the future. Index of Function, FCI) of wetland is calculated by each function of Table 1. And then, diverse variables are to be applied to calculate each Index of Function. Values of variables to be applied to calculation of Index of Function are calculated through compari-son of the reference wetland and the target wetland. Here, the values of variables and Index of Function are distributed from 0 to 1. The formula of Index of Function) of each function is as in the Table 2 (Brinson et al., 1995).
Table 2. FCI Calculation for Each Function
Functions FCI Calculation
Hydrologic
Dynamic Surface Water Stor-age
[VFREQ×{(VINUND+VMICRO+VSHRUB
+VTREE)/4}]0.5
Long-Term Surface Water
Storage (VSURWAT+VMACRO)/2
Energy Dissipation
[VFREQ
×{(VMACRO+VMICRO+VDTREE)/3}]0. 5
Subsurface Storage of Water (VPORE+VWTF)/2
Bio- geochemi-cal
Nutrient cycling VPROD
Removal of Imported Elements and Compounds
[{(VFREQ+VSURFIN)/2}+{(VMICRO+
VSORPT)/2}]/2
Retention of Particulates [{(VFREQ+VSURFIN)/2}×{(VHERB+V SHRUB+VDTREE+VMICRO)/4}]0.5
Organic Carbon Export [{(VV FREQ+VSURFIN+VSURFCON)/3}×
ORGAN]0.5
Plant Habi-tat
Maintain Characteristic Plant
Communities (VCOMP+VCANOPY+VDTREE)/3
Animal Habitat
Maintain Spatial Structure of
Habitat (VSTRATA+VGAPS)/2
Maintain Interspersion and Connectivity
(VFREQ+VDURAT+VMICRO+VSURFCON
)/4 Maintain Distribution and
Abundance of Invertebrates (VSINVT+VAQINVT)/2
Maintain Distribution and
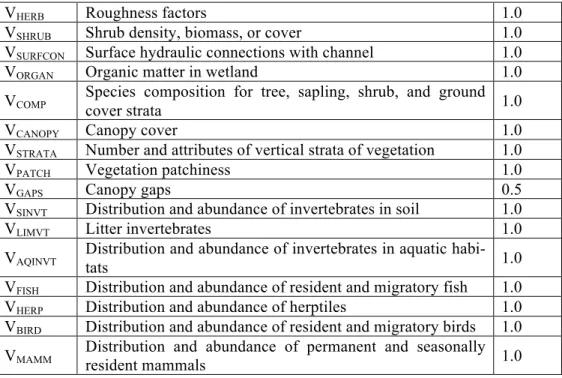
Abundance of Vertebrates (VFISH+VHERP+VBIRD+VMAMM)/4 Values of Variables applied to FCI Formula are like in the Table 3. Table 3. Estimation Variables in Upo wetland for FCI calculation
Variable Definition Value
VFREQ Frequency of overbank flow 1.0
VINUND Average depth of inundation 0.5
VMICRO Microtopographic complexity 1.0
VSHRUB Shrub and sapling density, biomass, or cover 1.0
VDTREE Tree density 0.5
VBTREE Tree basal area 0.5
VCWD Coarse woody debris 0.0
VREDVEL Reduction in flow velocity 1.0
VMACRO Macrotopographic relief 1.0
VPORE Soil water content 1.0
VWTF Fluctuation of water table 1.0
VSUBIN Subsurface flow into wetland 1.0
VHERB Roughness factors 1.0
VSHRUB Shrub density, biomass, or cover 1.0
VSURFCON Surface hydraulic connections with channel 1.0
VORGAN Organic matter in wetland 1.0
VCOMP Species composition for tree, sapling, shrub, and ground cover strata 1.0
VCANOPY Canopy cover 1.0
VSTRATA Number and attributes of vertical strata of vegetation 1.0
VPATCH Vegetation patchiness 1.0
VGAPS Canopy gaps 0.5
VSINVT Distribution and abundance of invertebrates in soil 1.0
VLIMVT Litter invertebrates 1.0
VAQINVT Distribution and abundance of invertebrates in aquatic habi-tats 1.0
VFISH Distribution and abundance of resident and migratory fish 1.0
VHERP Distribution and abundance of herptiles 1.0
VBIRD Distribution and abundance of resident and migratory birds 1.0
VMAMM Distribution and abundance of permanent and seasonally resident mammals 1.0
Like in the Table 3, the calculated variables were applied to the formula of Index of Function. As a result, the Index of Function by each function of wetland in consideration of Climate Change was calculated as in the Table 4.
Table 4. FCI of Each Function for a Target wetland
Functions FCI
Hydrologic
Dynamic Surface Water Storage 0.775
Long-Term Surface Water Storage 1.000
Energy Dissipation 0.791
Subsurface Storage of Water 1.000
Moderation of Groundwater Flow of Discharge 1.000
Bio-geochemical
Nutrient cycling 1.000
Removal of Imported Elements and Compounds 0.833
Retention of Particulates 0.816
Organic Carbon Export 1.000
Plant Habitat Maintain Characteristic Plant Communities 0.833 Maintain Characteristic Detrital Biomass 1.000
Animal Habitat
Maintain Spatial Structure of Habitat 0.833 Maintain Interspersion and Connectivity 1.000 Maintain Distribution and Abundance of
Inver-tebrates 1.000
Maintain Distribution and Abundance of
Verte-brates 1.000
5. Conclusions
The Index of Function for wetland function was calculated in application of the values of variables calculated in consideration of climate change. As a result, it was analyzed that
density, tree basal area and canopy gap, and it was calculated that the values of Index of Function using these variables were changed (Table 4). Such results are the values calcu-lated assuming that the entire Index of Function of the present Upo wetland is 1.0, display-ing that the wetland function of Upo Wetland has been reduced due to climate change. However, the result of this study is the one that has considered the climate change for vari-ables from the hydrological aspect. Accordingly, the ecological aspect was not considered. Therefore, it is considered that the studies in consideration of climate change from the eco-logical aspect in addition to the hydroeco-logical aspect should be carried out more diversely in the future in order to more accurately examine the influence of climate change on the wet-lands.
Acknowledgements. This work was supported by the National Research Foundation of Korea (NRF) grant funded by the Korean government (MEST) (No.2011-0028564)
References
Kim, S.J., 2011: Impact of Climate Change on Water Resources and Ecological Habitat in a River Basin. Ph.D. Dissertation, INHA University.
Brinson, M.M., Rheinhardt, R.D., Hauer, F.R., Lee, L.C., Nutter, W.L., Smith, R.D., and Whigham, D., 1995: A Guidebook for Application of Hydrogeomorphic Assessments to Riverine Wetlands. Wet-land Research Program Technical Report WRP-DE-11, US Army Corps of Engineers.
Dawson, T.P., Berry, P.M., and Kampa, E., 2003: Climate change impacts on freshwater wetland habitats. Journal for Nature Conservation, 11, 25-30.
Erwin, K.L., 2009: Wetlands and global climate change; the role of wetland restoration in a changing world. Wetland Ecology Management, 17, 71-84.
Ministry of Construction and Transportation, 2004: The report of channel improvement plan (Topyeong-cheon).
Mortsch, L.D., 1998: Assessing the Impact of Climate Change on the Great Lakes Shoreline Wetlands. Cli-mate Change, 40, 391-416.
Withey, P., and van Kooten, G.C., 2011: The Effect of Climate Change on Wetlands and Waterfowl in West-ern Canada; Incorporating Cropping Decisions into a Bioeconomic Model. Resource Economics & Policy Analysis Research Group, Department of Economics, University of Victoria.