This is the published version of a paper presented at 9th International Space Syntax Symposium.
Citation for the original published paper: Abshirini, E., Koch, D. (2013)
Visibility Analysis, Similarity and Dissimilarity in General Trends of Building Layouts and their Functions.
In: Young Ook Kim, Hoon Tae Park, Kyung Wook Seo (ed.), Proceedings of Ninth International Space Syntax Symposium (pp. 11:1-11:15). Seoul: Sejong University Press
N.B. When citing this work, cite the original published paper.
Permanent link to this version:
VISIBILITY ANALYSIS, SIMILARITY, AND DISSIMILARITY IN
GENERAL TRENDS OF BUILDING LAYOUTS AND THEIR FUNCTIONS
011
Ehsan Abshirini KTH e-mail : ehab@kth.se Daniel Koch KTH e-mail : daniel.koch@arch.kth.seAbstract
Visibility analysis is one of the key methods in space syntax theory that discusses visual information conveyed to observers from any location in the space that is potentially directly visible for the observer without any obstruction. Visibility – simply defined as what we can see – not only affects the spatial function of buildings, but it also has visual relation to the perception of buildings by inhabitants and visitors. In this paper we intend to present the result of visibility analysis applied on a sample of building layouts of different sizes and functions from a variety of places and periods. The main aim of this paper is to statistically explore the general trends of building layouts and show if and how visibility properties such as connectivity, clustering coefficient, mean depth, entropy, and integration values can make distinctions among different functions of buildings. Our findings reveal that there are significant correlation coefficients among global properties of visibility in which we consider the mean value of properties, a similarity suggesting that they are not intensively manipulated by the architects. On the other hand, there are correlations although less so than the previous, still significant among local properties of visibility in which we consider the (max-min) value of properties, suggesting that social, cultural or other physical parameters distinguish buildings individually. We also show that functions such as ‘museum’ and ‘veterinary’ are relatively well-clustered, while functions such as ‘ancient’ and ‘shopping’ show high diversity. In addition, using a decision tree model we show that, in our sample, functions such as ‘museum’ and ‘library’ are more predictable rather than functions such as ‘hospital’ and ‘shopping.’ All of these mean that –at least in our sample – the usability and applicability of well-clustered and well-predicted functions have been predominant in shaping their interior spaces; vice versa, in well-diverse and unpredicted functions, the pragmatic solutions of people’s daily life developed in material culture affect the visual properties of their interior spaces.
Keywords: Visibility Analysis, Building Layouts and Functions, Statistical Analysis, Similarity and
Dissimilarity, Socio-cultural Factor
E Abshirini and D Koch : Visibility analysis, similarity and dissimilarity in general trend of building layouts and their functions
011: 2
1. Introduction
Space syntax as a set of theories and tools used for morphological analysis originally emerging in the field of architecture and analysis of settlements (Hillier and Hanson1984; Markus 1993; Hillier 1996; Hanson 1998) has since been spread over wider areas of research and developed in manifold directions. Specific applications in urban environment include movement pattern and walkability (Raford and Ragland 2003; Choi 2012), computing of network properties of build environment (Hillier and Hanson1984; Markus 1993; Hillier and Iida 2005; Hillier 2009) as well as the networks of cities (Hillier et al. 2010; Psarra and Kickert 2012; Marcus and Legeby 2012), and analysis of visibility in both buildings and cities (Hanson 1998; Turner and Penn 1999, Peponis 2012), amongst many other things. Many, if not most, of these studies, however, concern analyses of individual buildings or small sets of buildings, with notable exceptions including the early studies of settlements (Hillier and Hanson 1984), Hanson’s (1998) study of homes, and Peponis’ studies of general tendencies in buildings (2012). This paper aims to contribute methodologically and theoretically to how larger sets of buildings can be analyzed, and to begin to unearth whether there are morphologically identifiable types or typologies that somehow concur with the normally considered function-type (Markus 1993). This analysis is based on what is commonly called Visibility Graph Analysis (VGA).
Within the field, visibility is commonly analyzed through isovists, brought into syntax theory from Benedikt (1979) originally as analysis of single viewpoints but developed into numerically computable syntactic analysis through, amongst others, the work of Turner and Penn (1999) and Turner (2001). The VGA analysis, in brief, is defined as a set of points distributed symmetrically in space between which intervisibility can be analyzed through isovists.
Specifically of interest for this paper, visibility analyses of buildings as spatial structures have been developed and used in furtherance of finding general similarity or specific differentiation among them. For instance Hillier, Hanson, and Graham (1987) investigated a sample of rural houses from different areas of France to explore the geometry of houses. The aim was to show the different relationships between social arrangements and morphological structures of buildings. In their paper title "Ideas are in Things" they show that in the half sample of 17 house layouts a space labeled as ‘hall’, which played an intermediate role between living rooms and offices, was the most integrated area and was mostly occupied by women. The rest of the samples showed that a space labeled as ‘vestibule’ had the same role as the ‘hall’, which is why they suggest that ‘gender’ (here, femininity) as a socio-cultural property participated in the formation and control of the spatial configuration of buildings. This is an idea also expressed by Hanson (1998) proposing that the study of interior space could fix a connection between space configuration and space usability instilling the idea of seeing how space is basically designed to transmit socio-cultural information in its form and organization.
To find the evolution of Turkish indoor space over a period of time Güney (2007) applied a visibility analysis on a sample of 108 Turkish floor plans of apartments covering a period from 1920 to 1990. The result generally showed that all groups of buildings were similar in the spaces with the highest integration value. The research also revealed that there was a difference in integration values in the guest spaces and bedrooms between different groups of buildings. She finally stressed that the visibility analysis has the means for disclosing the spatial character of houses, such as the size of the connection area between different parts of a building, for instance, while it was not measurable in previous research done by permeability analysis. In another work, Shpuza and Peponis (2008) using two different measurements - relative grid distance and convex fragmentation - followed the effect of building shapes on the spatial structure of 50 office layouts using an axial line map method with special stress on integration
E Abshirini and D Koch : Visibility analysis, similarity and dissimilarity in general trend of building layouts and their functions
011: 3 value. Their finding showed that the integration value of different layouts has different and, in some cases, opposite relationships to the shape of floor plates. For instance, office layouts put up in floorplates with low convex fragmentation such as ‘bars’ tend to be highly integrated, while when put up in floorplates such as ‘pavilion’ and ‘wing’ with high convex fragmentation, they tend to be of lower integration. They finally concluded that the results of their research could be used by building stockholders to have a better assessment of a building’s suitability regarding their layouts, as well as by individual designers to freely work on restrictions applied to shape of buildings.
In a recent paper, Peponis (2012) sets a computational and statistical method on a collection of 67 building layouts of different sizes, functions and history to show the importance of basic analysis of relationships between intelligibility – in terms of relationship between any pairs of grid cells (tiles) and cognition of complex buildings. For this purpose, Peponis proposes the idea of purview and purview interface as an interface between spaces with limited perception to a few and/or small parts of a building and main spaces with a high perception of many or all areas, and convincingly shows that there are few tiles with very high values of comparative ‘direct purview’. These tiles with a high percentage of direct purview are also close to most parts of the buildings: most other locations are less than two turns away from the nearest ‘overview tile’ which is a tile with a high percent of purview. Similarly, there is only a small set of tiles with a high number of ‘mean turns’ to other tiles. He also stresses the significant role of overview in improvement of cognitive presentation of buildings and shows that all locations in a building are accessible from an overview tile with a very low mean distance (less than one turn). Considering a better collaboration between cognitive science and architectural research, he notes that such analysis on a large sample of buildings could provide a potential knowledge base of different aspects of spatial cognition. While we are not going to discuss visibility usage in connection with the spatial configuration of building layouts further it should be recognized that there are many other contributors to its development; the discussion here has centered on the most relevant for the following analysis of larger samples.
In this paper, we present the result of visibility analysis applied on a sample of 98 building layouts of different sizes and functions from a variety of places and periods. The main aim of this paper is to statistically explore the general trends of similarities or differences among building layouts and show if and how visibility properties such as connectivity, clustering coefficient, mean depth, entropy and integration values can make distinctions among buildings with different functions. What makes this study different from others is that in this paper, we use VGA conducted on a large sample of building layouts including different sizes, functions, and periods of time. Additionally, using many visibility properties (over 10 parameters) in our analysis provides better understanding of spatial relationships between properties while at the same time making us more confident about our findings and further clarifying similarities and differences between measurements. Last but not least, in this paper as noted earlier, we not only investigate the similarity and dissimilarity of building layouts in general, but we also go one step further and try to make a contrast among buildings with different functions in relation to their visibility properties.
The rest of this paper is outlined as follows: In section two we introduce our sample used in this research followed by a background-to-visibility graph analysis, and the method used in this paper. In section three we present our findings based on statistical analysis conducted on our sample in the form of an initial brief correlation study, followed by the main clustering and decision tree model investigations. Finally, we complete the paper with a conclusion in section four.
E Abshirini and D Koch : Visibility analysis, similarity and dissimilarity in general trend of building layouts and their functions
011: 4
2. Data and methodology
A sample of 98 building layouts is collected from different sizes from a variety of places and periods and grouped by 10 different functions: ‘museum’, ‘office’, ‘hospital’, ‘veterinary hospital’, ‘residential’, ‘library’, ‘shopping’, ‘hall’, ‘ancient’ and finally ‘other’ for buildings which belong to none of groups mentioned above such as a hotel, supermarket, or a multi-purposes building, and so on which belong to none of groups mentioned above. Figure 1(a) shows the number of buildings in each group and (b) is VGA conducted on an example building of each group colored to show its integration value. It is necessary to note that all building layouts are real and currently available, although some buildings may have been changed from the state in which they are represented in this sample. Gathering data for the analysis, we had free access to CAD files of buildings in a few cases, so most are modeled and prepared based on Depthmap’s requirements for a VGA analysis specifically for this investigation. We need to acknowledge that due to a broad sample and lack of time to check them thoroughly, we do not claim the sample to be statistically representative; this is a first paper investigating such analysis and a broad sample is considered enough for the current stage of research.
Figure1 (a): Number of buildings per function
Figure1 (b): Integration value of exemplary building layouts from different functions
0 5 10 15 20 25
E Abshirini and D Koch : Visibility analysis, similarity and dissimilarity in general trend of building layouts and their functions
011: 5 Visibility analysis and the use of isovists, as brought into syntax theory was, as briefly noted earlier, introduced in the form of analysis of isovists and isovist fields by Benedikt (1979), in which he defines the isovist as "[…] a set of all points visible from a given vantage point in the space", which can then be measured by properties such as area, perimeter, and occlusivity. The isovist field is a set of contour lines that show changes in size and shape of an isovist from all locations in the space. However, it seems the use of the term ‘visibility’ in the field of spatial configuration and build environment was primary initiated by Braaksma and Cook (1980) where they calculated the co-visibility of various parts of an airport and built up an adjacency matrix to specify the relationships between locations in a way of assigning ‘1’ in the matrix for those locations which are mutually visible and ‘0’ in which they are not visible.
In early space syntax development (e.g. Hillier and Hanson 1984), isovists were rarely used, if ever, and while visibility played a key role in the definitions of convex and axial spaces, it was not a direct analysis of visibility that was constructed. Peponis et al., at the University of Georgia (1998), however, developed methods called end point and e-partition based on joining any pairs of a discontinuous part of a shape and extending all diagonals that connect edges and corners without crossing a barrier for the explicit purpose of creating an analysis of where significant changes in visual information appear. It was through the work of Turner et al. (Turner and Penn 1999; Turner et al. 2001; Turner 2001) that a formulized methodology called VGA (Visibility Graph Analysis) was created. For their analysis, they plotted a grid of points on the plan of a building and used isovists to extract different relationships of visibility between points that could then be analyzed as a graph using isovist origins as nodes and employing the isovist to create links between these nodes. The advantage of this method was that the authors could associate different space syntax theories together and develop their own analytical methods from space syntax, isovist analysis, and small-world concept (Lu 2011). Properties extracted from VGA are grouped into global and local properties. The global measures such as mean depth, integration value, and entropy were based on making the shortest paths from each node to all other nodes. The local measures including clustering coefficient, control, and controllability were based on the relationships between each node and the node directly connected to, as well as for some measures of their immediate neighbors (Turner 2004). For our analysis, we conducted VGA on each building using Depthmap software (Turner 2001) and extracted different properties of visibility for each. These analyses are then used in two different ways. In the first derivation of VGA, we calculate the mean value of all properties for each building. The dataset prepared for all buildings in this way is hereafter called ‘First group’. The second derivation is a subtraction based on maximum and minimum value of each property to highlight the discrimination among building layouts, hereafter called ‘Second group’. Comparison between these two derivations in accordance with the result is also of interest. Since our sample includes building layouts of different sizes, we normalize the visual connectivity value gained from each building to be comparable to each other among different buildings. For this purpose, we simply divide the mean visual connectivity over the number of nodes (grid cells) in each building which is to some extent equivalent to the building area. Finally, the statistical analysis that we exert in this paper consists of an initial brief correlation study, followed by the two main studies of clustering and the decision tree model.
3. Result and discussion
In this section we present the results in different parts. The first part serves as a basis for the next parts where we simply make correlations between different pairs of VGA parameters to quantitatively show how buildings from different functions may be similar in their spatial
E Abshirini and D Koch : Visibility analysis, similarity and dissimilarity in general trend of building layouts and their functions
011: 6 configurations. In the second and third parts, which comprise the main results of this paper, we perform a cluster analysis and a decision tree model on our sample respectively, and discuss our results.
3.1 Correlation coefficient
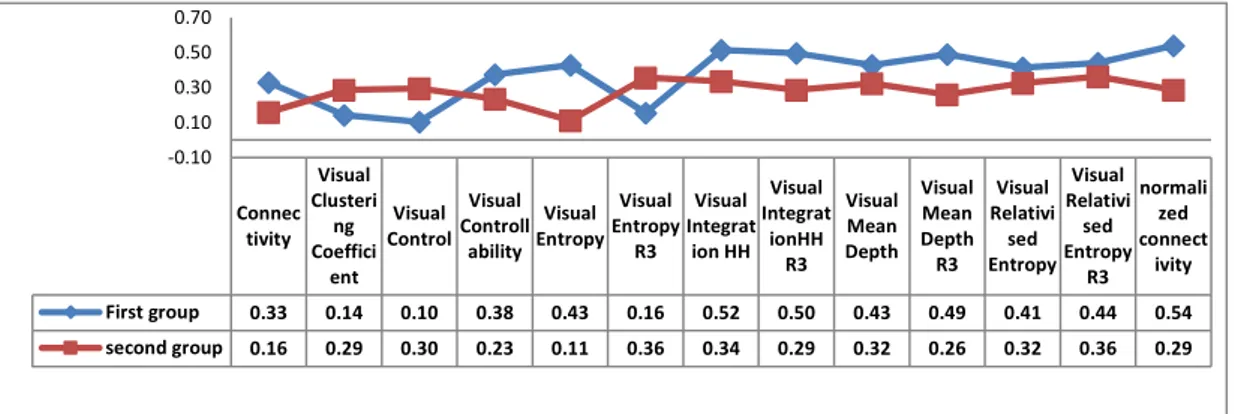
As expected, and known to most who work with VGA analysis, many of the values show high correlation to one another. The correlation coefficient provided for both groups of data indicates that there are significant correlations between properties such as integration value and normalized connectivity, entropy and mean depth on the positive side and between controllability and mean depth, entropy and integration value and Visual Control and normalized connectivity on the negative side, which are relatively the same in both groups. The highest correlations are between pairs of visual entropy and visual mean depth, with R= 0.95 in the First group and visual entropy with 3 steps and visual relativized entropy with 3 steps with R= 0.90 in the Second group, and a high correlation between integration value and integration value with 3 steps with almost the same R= 0.92 in both groups. In addition, the properties with the highest total average value of correlation coefficient among others are normalized connectivity and visual integration value in the First group and visual relativized entropy with 3 steps and visual entropy with 3 steps in the Second group (Figure 2). Comparing the correlation values between the two groups as shown in Figure 2, we realize that the average correlation value for all properties in the First group is higher than the Second group, except for visual entropy with 3 steps, clustering coefficient and visual control.
Figure 2: Diagram of total average of correlation value for each visibility property 3.2 Clustering
In this section, we try to find distinctions among buildings based on their functions and explore if and how the visibility properties of buildings can make particular separation among buildings regarding their functions. This analysis is based on analysis of data clustering. Clustering is an unsupervised classification of objects into different groups (clusters) so that objects in each cluster are more similar to each other and dissimilar to objects in other clusters. Clustering is a common technique in data mining and is usually applied to extract information from raw data. Among many different clustering models we chose K-means clustering, which is one of the simplest and most commonly used algorithms for grouping numerical datasets. In this method, the algorithm randomly chooses cluster centers equal to K (chosen by user) and then each object regarding its distance (Euclidian distance here) is assigned to the closest center. The distance measures are different and chosen by the user according to the data sample. In the next step, new cluster centers recalculate using the current cluster objects. The process of assigning objects and recomputing centers is repeated until convergence is met (Jain et al., 1999
Connec tivity Visual Clusteri ng Coeffici ent Visual Control Visual Controll ability Visual Entropy Visual Entropy R3 Visual Integrat ion HH Visual Integrat ionHH R3 Visual Mean Depth Visual Mean Depth R3 Visual Relativi sed Entropy Visual Relativi sed Entropy R3 normali zed connect ivity First group 0.33 0.14 0.10 0.38 0.43 0.16 0.52 0.50 0.43 0.49 0.41 0.44 0.54 second group 0.16 0.29 0.30 0.23 0.11 0.36 0.34 0.29 0.32 0.26 0.32 0.36 0.29 -0.10 0.10 0.30 0.50 0.70
E Abshirini and D Koch : Visibility analysis, similarity and dissimilarity in general trend of building layouts and their functions
011: 7 and MacQueen 1967). An issue in K-means clustering, is determining the number of clusters, K, in a sample, because the result of a clustering may be affected by the optimal choice of K. Choosing K is a debatable problem in clustering, and there is no fully principled way of choosing K and no fully agreed upon solutions; sometimes, users just select the value subjectively. But intuitively, it is significant that the value of K makes a balance between the illustration of the specific characters of objects in the dataset while at the same time being considerably smaller than the number of objects (Pham et al., 2004). In our sample, the K-value chosen for the clustering algorithm is 10. We chose this value by performing the cluster analysis with different values of K and comparing the different results together and then selecting the one perceived to provide the most information. Furthermore, according to the number of building functions in our sample – 10 different functions – it seems choosing 10 clusters will provide us a better description to find out how differently building functions are distributed.
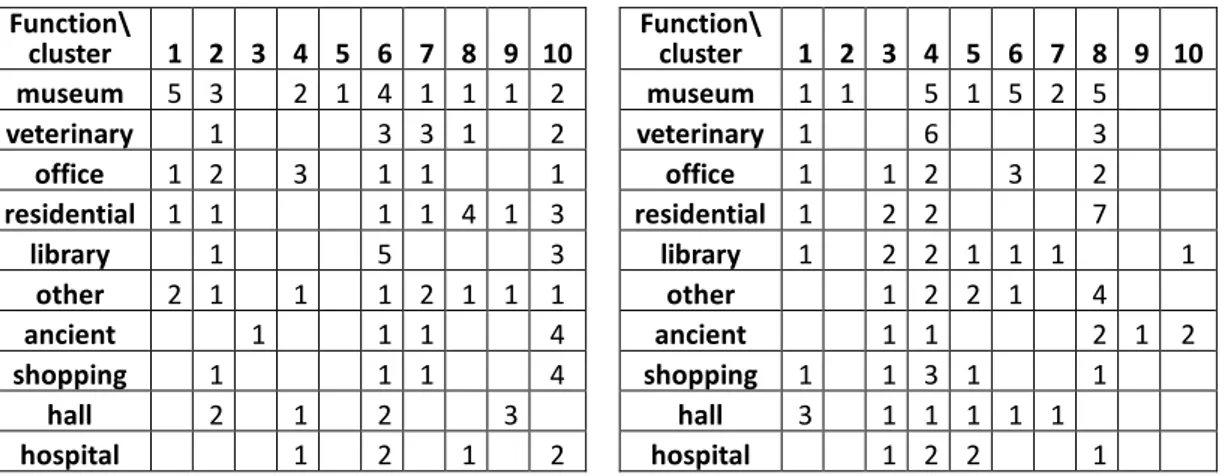
As it is suggested from Table 1, the number of buildings included in some clusters such as 3 and 5 in the First group, and 2, 9, and 10 in the Second group is very few; meanwhile, clusters such as 2, 6, and 10 in the First group, and 3, 4, and 8 in the Second group contain several buildings from different functions. Having a better observation of functions distributed in clusters, a distribution factor is computed for each function by dividing the number of classes occupied by each function over the total number of buildings in that function. This factor is a value between 0 and 1 which shows the degree to which each function spreads over different clusters. A higher value of distribution factor shows that a function is distributed in more classes according to the number of its buildings and vice versa.
Table 1: Number of buildings distributed in different clusters according to their functions; First group (left), and Second group (right) Function\ cluster 1 2 3 4 5 6 7 8 9 10 museum 5 3 2 1 4 1 1 1 2 veterinary 1 3 3 1 2 office 1 2 3 1 1 1 residential 1 1 1 1 4 1 3 library 1 5 3 other 2 1 1 1 2 1 1 1 ancient 1 1 1 4 shopping 1 1 1 4 hall 2 1 2 3 hospital 1 2 1 2 Function\ cluster 1 2 3 4 5 6 7 8 9 10 museum 1 1 5 1 5 2 5 veterinary 1 6 3 office 1 1 2 3 2 residential 1 2 2 7 library 1 2 2 1 1 1 1 other 1 2 2 1 4 ancient 1 1 2 1 2 shopping 1 1 3 1 1 hall 3 1 1 1 1 1 hospital 1 2 2 1
As can be seen in Figure 3, functions such as ‘museum’ and ‘veterinary’ show the lowest distribution value on average among other functions, whereas functions such as ‘hospital’, ‘shopping’ and ‘other’ have the highest diversity among others. However, some functions like ‘library’, ‘residential’ and ‘hall’ show a significant difference in their distribution factor between ‘First group’ and ‘Second group’. In other words, these functions show both diversity and similarity at the same time based on which value (mean or max-min) of their visibility properties is of consideration.
E Abshirini and D Koch : Visibility analysis, similarity and dissimilarity in general trend of building layouts and their functions
011: 8
Figure 3: Distribution factor of each function per each group of data and their average
To conclude this part of the analysis, we can note that functions with a low distribution factor, show shared properties of spatial configuration. This suggests that diversity for these types is more restricted than in types with a higher distribution factor, which indicates that the social and cultural parameters strongly affect the diversity of those buildings, and that they are built based on different preferences and interests of their owners or perhaps their architects. Furthermore, if types can vary greatly in spatial properties, their configuration cannot be explained simply by functional or use requirements; in some cases this is simply because the ‘function’ does not provide enough guidance for how to configure the space, thus allowing a wide range of solutions, and, in some cases, because the function ‘itself’ can be realized in different ways. It is worth noting that the results suggest that groups conceptually not restricted by their function – such as museums – show less variation than some groups (office, residential). The results thus support Hanson’s (1998) proposal that the main purpose of housing is to communicate social and cultural norms, and widens it to, more or less, the whole sample of types.
3.3 Decision tree
Decision trees are commonly used in data mining and statistics, and feature a tree-shape model with a root at the top and branches spreading downward that predict the target feature based on input variables. In this model structured by leaves and branches, each leaf indicates a predicted feature of a dataset, and each branch represents the process of decision making and classification rules that resulted in a specific feature. Processing starts by splitting a dataset into subsets based on classification rules applied on feature values, and this process is repeated on each consequent subset in a recursive mode until the subsets are resulted in a pure target feature or when the splitting process adds no value to the predicted results (Quinlan 1986). We ran a decision tree model based on all properties of the buildings and found to what extent each function might be predictable and differentiable from the other functions. Figures 4, 5, 6, and 7 show the final models for each group of our sample. As a general finding of all models, ‘museum’, ‘library’ and ‘ancient’ in most of the models are separated and predicted from the other functions with the minimum of expansion or minimum of splitting; on the other hand functions such as ‘hospital’, ‘shopping’ and ‘veterinary’ usually have to traverse a long way to be anticipated as a unique function.
museu m veterin ary residen tial hospita
l library office hall ancient shoppi ng other First Group 0.45 0.5 0.58 0.8 0.33 0.67 0.5 0.57 0.57 0.67 Second Group 0.35 0.3 0.33 0.5 0.78 0.56 0.75 0.71 0.71 0.67 Average 0.4 0.4 0.46 0.55 0.56 0.61 0.63 0.64 0.64 0.67 0 0.2 0.4 0.6 0.8
E Abshirini and D Koch : Visibility analysis, similarity and dissimilarity in general trend of building layouts and their functions
011: 9
Figure 4: prediction model derived from a decision tree applied to the first group; method is the Information Gain model with a maximum split of 10
Figure 5: Prediction model derived from a decision tree applied to the first group; method is the Gini-Index model with a maximum split of 10
E Abshirini and D Koch : Visibility analysis, similarity and dissimilarity in general trend of building layouts and their functions
011: 10
Figure 6: Prediction model derived from of a decision tree applied to the second group; method is the Information Gain model with a maximum split of 10
Figure 7: Prediction model derived from a decision tree applied to the first group; method is the Gini-Index model with a
maximum split of 10
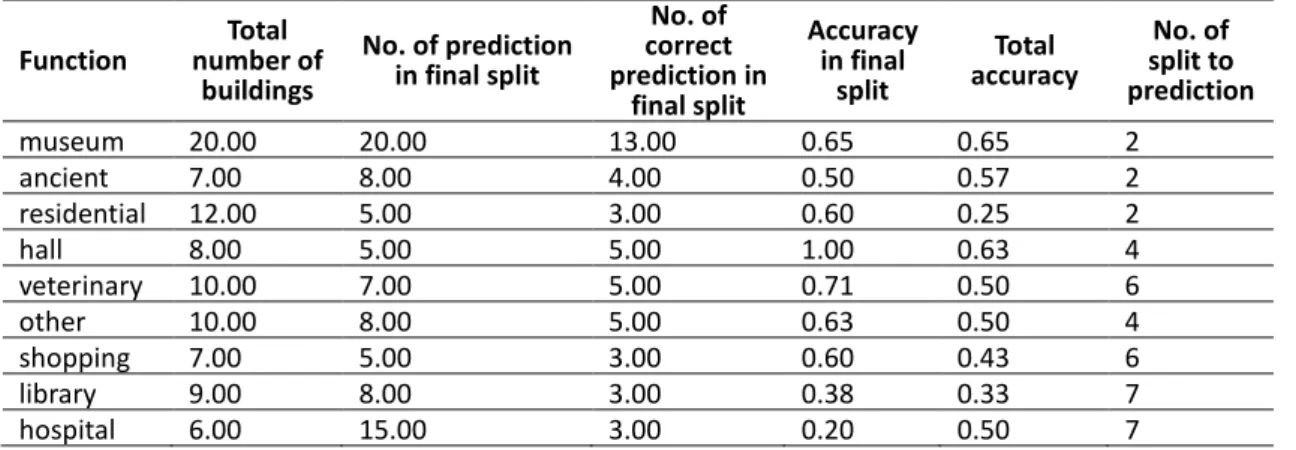
Being more informative about the results, we also in Tables 2, 3, 4, and 5 derived from tree models numerically show the degree to which each function is predictable. The accuracy assessment of predicted functions is calculated by two measurements: The first is including accuracy in the final split, which is obtained by dividing the number of correctly predicted buildings of a function in a final split (leaf) over the number of all predictions at the same split;
E Abshirini and D Koch : Visibility analysis, similarity and dissimilarity in general trend of building layouts and their functions
011: 11 the second is total accuracy, which is also calculated by dividing the same number of correct predictions over the total number of buildings in each function. As an overall result extracted from Tables 2-5, we find that ‘museum’ has the highest percentile of accuracy in most cases. Figure 8 shows a better interpretation of outcomes highlighted in Tables 2-5. As we can see in Figure 8, ‘museum’ and ‘library’ are the most predicted functions and they show the highest percentile of average accuracy among others; this suggests that they mostly follow a general trend in their interior spaces in terms of visibility properties which makes buildings of each function more identical and similar to each other. On the contrary, functions such as ‘hospital’, ‘shopping’ and ‘office’ show the lowest percentile of average accuracy in the prediction model; this demonstrates that they follow a high diversity in their visibility properties which makes buildings of each function less predictable and more divergent from one another.
Table 2: Results of the decision tree model in function prediction applied to the First group; Information Gain model
Table 3: Results of the decision tree model in function prediction applied to the First group; Gini-Index model
Table 4: Results of the decision tree model in function prediction applied to the Second group; Information Gain model
Function Total number of buildings No. of prediction in final split No. of correct prediction in final split Accuracy in final split Total accuracy No. of splits to prediction museum 20.00 28.00 14.00 0.50 0.70 2 ancient 7.00 9.00 6.00 0.67 0.86 2 library 9.00 9.00 7.00 0.78 0.78 3 shopping 7.00 9.00 2.00 0.22 0.29 3 office 9.00 7.00 3.00 0.43 0.33 3 residential 12.00 10.00 4.00 0.40 0.33 4 Function Total number of buildings No. of prediction in final split No. of correct prediction in final split Accuracy in final split Total accuracy No. of split to prediction museum 20.00 9.00 7.00 0.78 0.35 4 hall 8.00 9.00 6.00 0.67 0.75 3 ancient 7.00 5.00 3.00 0.60 0.43 2 office 9.00 5.00 3.00 0.60 0.33 4 other 10.00 5.00 3.00 0.60 0.30 3 residential 12.00 5.00 3.00 0.60 0.25 4 library 9.00 13.00 7.00 0.54 0.78 5 veterinary 10.00 11.00 5.00 0.45 0.50 4 Function Total number of buildings No. of prediction in final split No. of correct prediction in final split Accuracy in final split Total accuracy No. of split to prediction museum 20.00 20.00 13.00 0.65 0.65 2 ancient 7.00 8.00 4.00 0.50 0.57 2 residential 12.00 5.00 3.00 0.60 0.25 2 hall 8.00 5.00 5.00 1.00 0.63 4 veterinary 10.00 7.00 5.00 0.71 0.50 6 other 10.00 8.00 5.00 0.63 0.50 4 shopping 7.00 5.00 3.00 0.60 0.43 6 library 9.00 8.00 3.00 0.38 0.33 7 hospital 6.00 15.00 3.00 0.20 0.50 7
E Abshirini and D Koch : Visibility analysis, similarity and dissimilarity in general trend of building layouts and their functions
011: 12
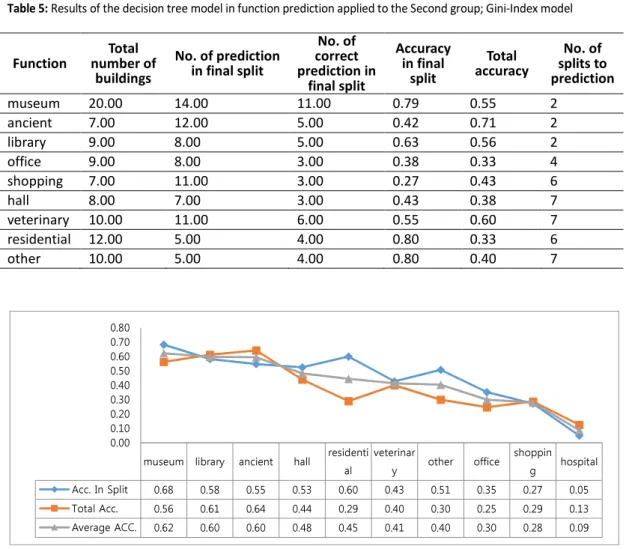
Table 5: Results of the decision tree model in function prediction applied to the Second group; Gini-Index model
Figure 8: Different accuracy assessments of functions derived from decision tree models
What we can conclude from this result is that there is a ‘universal’ type for museums, as well as libraries that is perpetuated across cultures; whereas buildings often thought of as simply pragmatic solutions to everyday problems show a wider range of diversity. It can be derived from considering Hanson (1998), however, that this variety does not come from their pragmatic, functional solution to everyday activities, but comes predominantly from the way the architecture for these buildings is used to communicate social and cultural ideas rather than utilitarian needs primarily. That is, it can be speculatively argued that on one hand there is a group of types with a shared cultural and social norm that is perpetuated across the sample, and then there is also another group of types that is used to express difference in social and cultural values. Whether this explanation counts for all the diversified cases remains to be investigated, but it is interesting to note that there seems to be a larger emphasis on cultural investment in ‘pragmatic buildings’ such as houses than in ‘museums’, if we, with cultural investment, mean the way society reifies itself and differentiates itself from other societies through architectural and spatial formulation. It is worth noting that it does not mean that all museums are the ‘same’; it means that from many measurable properties, they formulate similar socio-spatial descriptions of their content, and how this content relates to visitors.
museum library ancient hall residenti al veterinar y other office shoppin g hospital Acc. In Split 0.68 0.58 0.55 0.53 0.60 0.43 0.51 0.35 0.27 0.05 Total Acc. 0.56 0.61 0.64 0.44 0.29 0.40 0.30 0.25 0.29 0.13 Average ACC. 0.62 0.60 0.60 0.48 0.45 0.41 0.40 0.30 0.28 0.09 0.00 0.10 0.20 0.30 0.40 0.50 0.60 0.70 0.80 Function Total number of buildings No. of prediction in final split No. of correct prediction in final split Accuracy in final split Total accuracy No. of splits to prediction museum 20.00 14.00 11.00 0.79 0.55 2 ancient 7.00 12.00 5.00 0.42 0.71 2 library 9.00 8.00 5.00 0.63 0.56 2 office 9.00 8.00 3.00 0.38 0.33 4 shopping 7.00 11.00 3.00 0.27 0.43 6 hall 8.00 7.00 3.00 0.43 0.38 7 veterinary 10.00 11.00 6.00 0.55 0.60 7 residential 12.00 5.00 4.00 0.80 0.33 6 other 10.00 5.00 4.00 0.80 0.40 7
E Abshirini and D Koch : Visibility analysis, similarity and dissimilarity in general trend of building layouts and their functions
011: 13
4. Conclusion
In this paper we attempt to find general similarities and specific dissimilarity in a sample of building layouts from different sizes, functions, and different periods of history regarding the analysis of their visibility properties. In the first step, we simply statistically compared different VGA measures to see the degree to which they correlated, showing statistical support for the expected similarity between values, which suggests that for many intents and purposes, which exact measure (e.g., entropy or integration) is used has no large or significant effect on the result. However, this does not mean that for specific research questions they cannot give different answers, which can be seen in the third part, where we see that they have different degrees of predictive power of different function-types. In the second and third part of this paper we try to show that there is still discrimination among different functions of buildings regarding dissimilarities in visibility properties of each building. In order to elucidate these differences, statistical analyses such as the clustering and decision tree models were applied on our sample to find how well the visibility properties make discrimination among building functions and to what extent each function is predictable based on its visibility properties. Results of clustering show that functions such as ‘museum’ and ‘veterinary’ are relatively well-clustered, which means that they form not only function-types but spatial morphology types; however, it is vice versa in well-diverse functions such as ‘ancient’ and ‘shopping’ where the pragmatic solutions of people’s daily lives provide a range of diversity that formulate differentiated material cultures that affect the visual properties of their interior spaces. This means that while they serve something that can be grouped ‘functionally’, they do not constitute spatial types. The results of the decision tree analysis also show that functions such as ‘museum’ and ‘library’ are more predictable rather than functions such as ‘hospital’, ‘shopping’ and ‘office’. This suggests that uniformity of architectural ideas and formulation eclipses the range of diversity in buildings such as museums, perpetuating distinct spatial and socio-cultural types which are seldom deviated from. Especially for museums, this has been argued repeatedly (c.f. Bennet 1995), but the results of our analysis gives this statistical support in as far as spatial morphology is concerned.
The results of our analysis suggest that many of these norms, predominantly from the 18th and
19th century especially for museums, are still perpetuated as spatial morphologies in spite of
theoretical and architectural challenges in many other ways. It should be noted, however, that otherwise diverse types such as ‘residential’ can be identified early on morphologically in some properties even if these identifications are not ‘clean’, and the question is thusly not as simple as to whether some types are diverse and some not. With this in mind, it is worth raising the question of why the most distinctly identifiable and ‘restricted’ functions in terms of spatial morphology are also the types which are distinctly public buildings, while the more ‘private’ buildings are more diverse. Finally, we intend to again acknowledge that we are not claiming that our sample is statistically representative, but see this as a pilot study that has both interesting results in their own right, and that shows that the study of large samples can make significant contributions to architectural research in general and space syntax research specifically. The introduction of clustering and decision tree analysis rather than correlation analysis allowed us to unearth how spatial properties relate to a range of functions in a way that opens up for many ways forward in developing an understanding of the emergence of spatial or morphological types not restricted to specifically originate from function-types, but rather possible to unearth from the perspective of spatial properties.
E Abshirini and D Koch : Visibility analysis, similarity and dissimilarity in general trend of building layouts and their functions
011: 14
References
Benedikt, Michael L. 1979. “To Take Hold of Space: Isovists and Isovist Fields.” Environment and
Planning B: Planning and Design 6 (1): 47 – 65.
Bennett, Tony.1995.The birth of the museum: history, theory, politics. Routledge.
Braaksma, John P., and W. Jordan Cook. 1980. “Human Orientation in Transportation Terminals.”
Transportation Engineering Journal 106 (2): 189–203.
Choi, Eunyoung. 2012. “Urban Diversity and Pedestrian Behavior: Refining the concept of land-use mix for walkability.” In Proceedings: Eighth International Space Syntax
Symposium. Santiago, PUC.
Güney, Yasmin. I. 2007. “Analyzing Visibility Structures in Turkish Domestic Spaces.” In 6th
International Space Syntax Symposium, Istanbul.
Hanson, Julienne. 1998. Decoding Homes and Houses. Cambridge University Press.
Hillier, Bill, Alasdair Turner, Tao Yang, and Hoon-Tae Park.2010. “Metric and topo-geometric properties of urban street networks: some convergences, divergences and new results.”
The Journal of Space Syntax 1(2): 279.
Hillier, Bill, and Julienne Hanson. 1984. The Social Logic of Space. Cambridge University Press. Hillier, Bill, and Shinichi Iida. 2005. “Network and Psychological Effects in Urban Movement.” In
Spatial Information Theory, edited by Anthony G. Cohn and David M. Mark, 475–490.
Ellicottville, NY: Springer.
Hillier, Bill, Julienne Hanson, and Hillaire. Graham. 1987. “Ideas are in things-An application of the space syntax method to discovering house genotypes.” Environment and Planning B 14(4): 363–385.
Hillier, Bill. 2009. “Spatial Sustainability in Cities: Organic Patterns and Sustainable Forms.” In
Proceedings of the 7th International Space Syntax Symposium, Stockholm.
Hillier, Bill. 1996. Space is the Machine. Cambridge University Press
Jain, Anil K., M. Narasimha Murty, and Patrick J. Flynn. 1999. “Data clustering: a review.” ACM
computing surveys (CSUR) 31(3): 264-323.
Lu, Yi. 2011. “Directed Visibility Analysis: Three Case Studies on the Relationship Between Building Layout, Perception and Behavior.” PhD diss., Georgia Institute of Technology, Atlanta, USA.
MacQueen, James. 1967. “Some methods for classification and analysis of multivariate observations.” In Proceedings of the fifth Berkeley symposium on mathematical
statistics and probability. Berkeley.
Marcus, Lars, and Ann Legeby. 2012. “The need for co-presence in urban complexity: Measuring social capital using space syntax.” In Proceedings: Eighth International Space Syntax
Symposium. Santiago, PUC.
Markus, Thomas A. 1993. Buildings & power: Freedom and control in the origin of modern building types. London: Routledge.
Peponis, John, Jean Wineman, Mahbub Rashid, S. Kim, and Sonit Bafna. 1998. “On the Generation of Linear Representations of Spatial Configuration”, Environment and
E Abshirini and D Koch : Visibility analysis, similarity and dissimilarity in general trend of building layouts and their functions
011: 15 Peponis, John. 2012. “Building Layout as Cognitive data: Purview and Perview Interface.”
Cognitive Critique 6: 11–37.
Pham, Duc Truong, Stefan S. Dimov and C. D. Nguyen. 2004. “Selection of K in K-means clustering.” In Proceedings of the Institution of Mechanical Engineers, Part C: Journal of
Mechanical Engineering Science 219(1): 103-119.
Psarra, Sophia and Conrad Kickert. 2012. “DETROIT–THE FALL OF THE PUBLIC REALM: the street network and its social and economic dimensions from 1796 to the present.” In
Proceedings: Eighth International Space Syntax Symposium. Santiago, PUC.
Quinlan, J. Ross. 1986. “Induction of decision trees.”Machine learning1(1): 81-106.
Raford, Noah and David R. Ragland. 2003. “Space Syntax: An Innovative Pedestrian Volume Modeling Tool for Pedestrian Safety” Journal of the Transportation Research Board 1878(1): 66-74.
Shpuza, Ermal, and John Peponis. 2008. “The Effect of Floorplate Shape Upon Office Layout Integration.” Environment and Planning B: Planning and Design 35 (2): 318 – 336. Turner, Alasdair and Alan Penn.1999. “Making isovists syntactic: isovist integration analysis.”
In2nd International Symposium on Space Syntax, Brasilia.
Turner, Alasdair and Alan Penn.2002. ”Encoding natural movement as an agent-based system: an investigation into human pedestrian behaviour in the built environment.”Environ Plann B29( 4): 473-490.
Turner, Alasdair, Maria Doxa, David O’Sullivan, and Alan Penn. 2001. “From Isovists to Visibility Graphs: a Methodology for the Analysis of Architectural Space.” Environment and
Planning B 28 (1): 103–121.
Turner, Alasdair. 2001. “Depthmap: A Program to Perform Visibility Graph Analysis. Paper Presented At.” In The Third International Space Syntax Symposium, Georgia Technological Institute.
Turner, Alasdair. 2004. “Depthmap 4: a Researcher’s Handbook.” Report. London, UK: Bartlett School of Graduate Studies, University College London.