Cost effects by implementing LEAN
Master thesis
Advance level, 30 credits
Product and process development
Production and logistics
Hemin Adam
Report Nr:
Supervisor (Company): Tommy Svensson
Supervisor (University): Antti Salonen
Examiner: Prof. Sabah Audo
i
Abstract
This report is a result of master thesis performed at Volvo Powertrain in Koping, Sweden. Today Volvo Powertrain processes and assembles gearboxes for many of Volvo trucks, buses and dump trucks. It also sends gearbox components to Volvo’s plants in North and South Americas, and additionally produces Volvo Penta’s revolutionary marine gear called “IPS” within the company.
In order to meet customer requirements for reduced lead time/ freezing time for order placement of products in Koping, Volvo Powertrain wants to achieve a more resource-efficient production. What will the economic costs be in order to reduce the lead time and implement improvements? Since all decision includes cost investment.
The aim of this thesis is to make a deep analysis of Order-To-Delivery process between the customers of Volvo Penta, Volvo VCE as well as aftermarket and clarifying the impact of lead time shortening both in practical and economical point of view.
After completing the Value Stream Mapping on the current state, problems and non-value adding time are identified. Problems that are found are the long waiting time between the machines, which is the majority of the throughput time. Other issues are the long setup time, and operations that are not performed correctly. Other types of waste were also observed included the long waiting time of material handling between the different buildings. Based on the Value Stream Mapping and through other Lean tools, various proposals have been presented to simplify and increase machine time availability and flexible the production. There have also been various scenarios calculated about what the economic costs will be if the selected items in this thesis are prioritized over other products.
ii
Sammanfattning
Denna rapport är resultaten av examensarbete som utfört på företaget Volvo Powertrain Köping, Sweden. Arbetet omfattar 30 högskolepoäng på D-nivå, och är det slutgiltiga momentet för att få civilingenjörsexamen inom innovation, produktion & logistik vid Mälardalen Högskola Eskilstuna/ Västerås.
Idag bearbetas och monteras växellådor till många av Volvos lastbilar, bussar och dumprar. Det skickas även växellådskomponenter till Volvos fabriker i Nord- och Sydamerika och dessutom produceras Volvo Pentas revolutionerande marina drev kallat ”IPS” inom företaget. För att kunna möta kundens önskemål om sänkt ledtid/ frystid vid orderläggning av produkter i Köping vill Volvo Powertrain åstadkomma en alltmer resurssnål produktion. För att minska ledtiderna vill man se vilka ekonomiska kostnader som tillkommer. Eftersom alla beslut inkluderar kostsamma investeringar.
Syftet med detta examensarbete var att göra en djupanalys av Order-To-Delivery process mellan kunderna PENTA, VCE samt eftermarknad och tydliggöra effekterna av
ledtidsförkortning. Påverkan rent praktiskt samt ekonomiskt.
Efter genomförd värdeflödesanalys på nuläget av två valda artiklar, kunde problem och icke värdeskapande tid identifieras. Problem som påträffades handlade om långa inventeringar mellan maskinerna, vilket var majoriteten av genomloppstiden. Andra problem handlade om de långa ställtiderna, och arbetsmoment som inte utfördes korrekt. Andra sölerier som observerades var bland annat de långa väntetiderna av material hantering mellan olika de byggnaderna.
Utifrån värdeflödesanalysen samt med hjälp av andra Lean verktyg har det presenterats olika förslag för att effektivisera och få öka maskintid tillgänglighet samt ett smidigare och mer resurssnål produktion. Det har även kalkylerats olika scenarion om vilka ekonomiska kostnader det fås om de utvalda produkterna i detta examensarbete prioriteras framför andra produkter.
iii
Acknowledgment
I would like to thank all the people that have been involved in this project and have been supportive by taking their time and answering questions and providing information. I would like to give a special thanks to my executives Claes Wilhelmsson, Nevenka Salamurovi and my supervisor Tommy Svensson how have given me this opportunity to perform my master thesis at Volvo Powertronic, and I also thank the production mangers Roger Jansson and Johan Isaksson for guidance and support. I would also like to thank all the people involved for showing great interest and optimism in this project.
Finally I would like to thank my supervisor Antti Salonen at Malardalen University for the guidance through this project, in addition to Prof. Sabah Audo the examiner.
iv
Abbreviation list
APS Advance Planning System
CICS Customer Information Control System
CPO Central Planning Office
EDA Electronic Data System
EDI Electronic Data Interchange
EOQ Economic Order Quantity
ERP Enterprise Resource Planning
GASS Global Assembly Steering System
ITR Inventory Rate
JIT Just-in- Time
Lean Lean production, philosophy and tools for improvements
MMS Material Management System
OEE Overall Equipment Effectiveness
OP Operation Development
RFID Radio Frequency identification
PDCA Plan-Do-Check-Act
SCM Supply Chain Management
VPS Volvo Production System
VSM Lean tool, Value Stream Mapping
VTC Volvo Truck Operations
WIP Work in process
v
Table of Contents
1 Introduction ... 1
1.1 Back ground ... 1
1.2 Problem Statement ... 1
1.3 Aim and Research questions ... 2
1.4 Project limitation ... 2
2 Methodology ... 2
2.1 Description ... 2
2.1.1 Case study ... 3
2.1.2 Case company ... 3
2.1.3 Volvo Production System ... 5
2.1.4 Classification ... 6
2.1.5 Qualitative and quantitative ... 6
2.2 Approach ... 6 2.2.1 Data Collection ... 6 2.2.2 Literature study ... 7 2.2.3 Interview ... 7 2.2.4 Observation ... 7 2.2.5 Documentation ... 8
2.2.6 Reliability and Validity ... 8
3 THEORETICAL BACKGROUND ... 9
3.1 Lean ... 9
3.1.1 Lean principals ... 11
3.1.2 5S ... 16
3.2 Logistics ... 19
3.3 Supply chain management ... 20
3.3.1 Value stream map ... 21
3.3.2 Material flow mapping ... 22
3.3.3 Tied-up capital ... 22
3.4 Production concepts and mathematical models ... 24
3.4.1 Manufacturing Lead-time ... 24
3.4.2 Cost Information ... 25
3.4.3 Setup cost ... 26
3.4.4 Production rate ... 26
vi
3.4.6 Work-in-process (WIP) ... 28
3.4.7 EOQ ... 28
3.5 From zero inventory to holding inventory ... 30
4 Current state analysis ... 31
4.1 THE PLANNING SYSTEM ... 31
4.1.1 Central Planning Office ... 31
4.1.2 Material Management System ... 32
4.1.3 Customer Information Control System (CICS) ... 32
4.2 Lead Time... 33
4.3 Process description ... 33
4.3.1 Description of Product A ... 34
4.3.2 Description of Product B ... 35
4.4 Result of value analysis of current state ... 36
4.4.1 Item A ... 36
4.4.2 Inventory ... 36
4.4.3 SV01 ... 37
4.4.4 Setup time ... 37
4.4.5 Batch size ... 37
4.4.6 Article per machine ... 38
4.4.7 Panel ... 38 4.4.8 Transportation ... 38 4.4.9 Trail ... 39 4.5 Item B ... 40 4.5.1 Inventory ... 40 4.5.2 Batch sizes ... 41 4.5.3 Transportation ... 41
4.5.4 Article per machine ... 42
4.6 Future improvement item A ... 43
4.6.1 Inventory ... 43
4.6.2 SV01 ... 44
4.6.3 Setup time ... 45
4.6.4 Article per machine ... 45
4.6.5 Panel ... 45
4.6.6 Batch Size ... 46
4.6.7 Transportation ... 46
4.6.8 Trail ... 47
vii
4.7 Future improvement of item B ... 48
4.7.1 Batch ... 48
4.7.2 Article Per machine ... 48
4.7.3 Transportation ... 49
4.7.4 Setup Time ... 49
4.7.5 Inventory ... 49
5 Cost scenarios calculation ... 50
6 Conclusions and Recommendation ... 59
7 References ... 62
7.1.1 Study material: ... 64
viii
List of figures
Figure 1 – Volvo Group Production Facilities. Volvo Group intranet 3 Figure 2 – Volvo Group Organization, GOT. Volvo Group Intranet 4 Figure 3 – Group Truck Operations, GTO. Volvo Group Intranet 4 Figure 4 – Volvo production System Matrix, Volvo Group Intranet 5
Figure 5 – The 4P model, (Liker, 2004), Pg.13. 9
Figure 6 – The TPS house, (Liker, 2004), Pg.33. 10
Figure 7 – Necessary elements of a pull system, (Martin, 2008), Pg.341. 12 Figure 8 – Process layouts alternative for pull system, (Martin, 2008), Pg.343. 13 Figure 9 – Logistics management process, (Jonsson, P. and Matsson, S. 2005), Pg.61. 19 Figure 10 – The value chain, (Christopher M, 20011), Pg.10. 20 Figure 11 – The Network of Chain, (Christopher M, 2011), Pg.3. 21 Figure 12 – VSM example, (Krajewski, et al. 2007), Pg. 361. 21
Figure 13 – Material flow chart example, (Jonsson P, 2008), Pg.112. 22
Figure 14 – Sources of loss, (Salonen, 2013). 27
Figure 15 – Machine hours, (Salonen, 2013). 28
Figure 16 – The cycle inventory, (Roach, 2006). 29
Figure 17 – Annual total cost, (Roach, 2006). 30
Figure 18 – CPO, order handling. 31
Figure 19 – Process flow item A 33
Figure 20 – Process flow item B 33
Figure 21 – Process flow Item A-2 34
Figure 22 – Process flow Item B 35
Figure 23 – VSM item A 36
Figure 24 – Panel item A 37
Figure 25 – Spare Parts 38
Figure 26 – Trailers 39
Figure 27 – VSM item B 40
Figure 28 – Panel for item B 41
Figure 29 – Spare parts 42
Figure 30 – Inventory calculation for IPS1 44
Figure 31 – Production capacity Marin 2012-13 45
Figure 32 – L1 box 46
Figure 33 – K1 box 46
Figure 34 – New trailers 47
ix
Figure 36– Correct lead time item A 47
Figure 37 – Panel for item B 48
Figure 38 – Production capacity for Powertronic 2012-13 48
1
1 Introduction
An empirical thesis has been performed at Volvo Powertrain in Koping, Sweden, where the aim is to analyze the material flow and the economic cost for improvement suggestions.
1.1 Back ground
There is not much written on how to implement lean at manufacturing companies. Some firms stumble through with trials and errors, while others rely on repeated kaizen events (Lee, 2007). For many companies, getting lean right the first time does not always happen. The concept of lean was developed for maximizing the resource utilization through minimization of waste, which later on was formulated in response to the fluctuating and competitive business environment (Sundar, et al., 2014). But the focus of lean is continuous flow of materials and eliminating waste, however to achieve valuable future improvements it is significant to evaluate the current state and bring all the problems to the surface. (Liker, 2004)
To develop a lean manufacturing strategy and implementation plan, five general steps are recommended: 1. Evaluate the current state. 2. Determine the future state workflow (in principle). 3. Identify future state infrastructure (in principle). 4. Identify precedents and priorities. 5. Develop the plans. (Lee, 2007). But for Lean to be implemented at ground floor and truly be successful tool the management have to believe in that it will work and go forward with it slowly and step by step.
1.2 Problem Statement
The general problem that many manufacturing companies of today face is how to implement lean at site. But going forward to implement lean is not an easy task, because it involves the entire supply chain organization of the company.
Lean is time consuming and costly, which takes time implement. But in the long term it is vital tool that helps the company to be very competitive in today’s market. The problem is that companies of today cannot see the complete picture of the benefits, drawback and effects it has in order to determine if it is possible to make any improvements or not, but also in economical term.
Some of the question that have to be answered is how to reduce the lead time/ freezing time of order placement of products in production line, how to achieve a more resource-efficient production. What will the economic costs be in order to reduce the lead time and implement improvements since all decision includes cost investment?
2
1.3 Aim and Research questions
The aim of this project is to clarify the effects of lead time reduction and economical cost. Can the lead time be reduced? How can it be reduced? How will the lead time effect other products? What will the cost be? Which elements should be contained within for more accurate cost estimation?
1.4 Project limitation
The main limitation for this project has been the time. If more time had been given then it would have been possible to present a more accurate assessments of the current situation. Different method would be explored to solve the problem. That is why limited project time leads to premature conclusions and a reduced amount of detailed work, with a variety of methods untested.
2 Methodology
A method refers to a scientific way to approach the topic one has chosen to write about and what it intends to do with the subject. The method chosen affects and influents the entire essay. One can choose to do a simple description, binding itself to make comparisons, formulate hypotheses or make predictions. The methodology refers to the way in which the collected material is used to describe, compare, set up hypotheses or predict anything (Ejvegård, 2003).
Method selection and method of application is an important way to pursue science. The same is true of methodology being used. One should always write in clear text to specify the method one has used and how the implementation occurred. Each method can of course be modified in different ways (Ejvegård, 2003).
2.1 Description
Description is a method which clarifies how a company works. It can be seen that the description method is a simple step, but it is later shown to be a difficult step. It must have a systematic method; in which way the information that is being gathered must be categorized and sorted so that it shows how the company works. There must be contexts in the petition so that important information is emphasized. What is essential is to determine, among other things, the purpose of the essay. The fact which has been described should not only be real but also relevant (Ejvegård, 2003).
The aim of this project has been clear since day one, all collected data has been thoroughly analyzed by the means of the projects aim and research questions.
3
2.1.1 Case study
The purpose of a case study is simply to take a minor part from a passage of an event and describe the reality. The advantage of this approach is not to submerge a big description, but in limited space give the reader a perception of how it looks like or being completed. The difficulty is that a single case never fully represents reality. It is important to have drawn some conclusions. Conclusions can be seen as evidence only when there are other evidence that points in same direction and obtained by other research methods (Ejvegård, 2003). Thus any finding or conclusion in a case study is likely to be much more convincing and accurate if it is based on several different sources of information, following a corroboratory (Yin, 1994). Through documentation, data collections, interviews and observation at the work shop, the necessary data have been collected to achieve the improvement suggestions.
2.1.2 Case company
Assar Gabrielsson and Gustaf Larsson had a vision of manufacturing a car that could endure the weather climate and roads in Sweden. The vision of the company became reality in year 1927, and since then the key element of the company has been to keep sustainability in the design of their products. There deep commitment of quality, safety and environment has let them to become a leader in sustainable transportation solutions. Volvo Group is one of the largest suppliers in the world when it comes to trucks, buses, industrial engines, construction equipment and marine. The company has established itself in term of sales and marketing channels in more than 190 markets. Figure 1, shows in which part of the world Volvo Group established its production facilities.
Figure 1 - Volvo Group Production Facilities. Volvo Group intranet
This report is based on empirical studies at Volvo Power Train Logistics department in Koping, which is a part of Volvo Group Trucks Operations (GTO). Figure 2 shows how the Volvo Group organization is divided in eight different units. GTO is based on; North America Trucks Operations, Volvo Trucks Global Manufacturing, Renault Trucks manufacturing, Asia Trucks Operations, Volvo Logistics, Volvo Powertrain Operations, Parts Logistics and
Remanufacturing in Volvo Parts, Volvo Production System (VPS) and Operation development (OD) from Volvo Technology.€
4
Figure 2 - Volvo Group Organization, GTO. Volvo Group intranet
The Logistics Services seen below in Figure 3 is a global leader in automotive, transportation and aerospace industries. The department involves design, management and optimization of the supply chain on all Volvo Group's brands and selected automotive industry. Logistics Services department ensure that parts are available worldwide, when needed. Volvo GTO has three central warehouses in Europe located in; Sweden, Belgium and France.
5
2.1.3 Volvo Production System
The Volvo Way is the company's values, culture and leadership. Volvo Production System (VPS) focuses on maintaining values of the Volvo Way while creating customer value and eliminate waste in processes, striving to achieve sustainable profitability and operational efficiency. VPS covers the entire value chain areas and individuals engaging in the Volvo Policy, and contributing to the Volvo Group Transformation.
The principle of VPS is to oriented people to help the company achieve good result. The main principle of VSP are; Customer, Built-In Quality, continuous improvement, Just-in-Time, process stability, teamwork and the values of the Volvo Way. Without satisfied customers the company will not survive, Built-in Quality is to achieve zero-defect mindset, and not
toleration poor quality and eliminate underlying causes. Continuous improvement implicates on standardize work and future state vision.
Producing the right thing, in the right quantity and at the right time is the vision of Just-in-Time, aiming at the shortest possible lead times and minimal inventory. Process stability is about understanding the business and reduces waste and variation in processes, through standardized work, production smoothing and 5S.
6
2.1.4 Classification
Classification is a method to help analyzing collected data. It is common that the researcher must consider the classification before even collecting raw data to understand what he/ she should look for. Classification can be of infinite number or types. It is vital that classification satisfies certain logical requirements. The requirements are that they must be reliable, valid, collective, and comprehensive (Ejvegård, 2003).
Due to the amount of article being involved in both products, two critical products have been selected to make the information more manageable.
2.1.5 Qualitative and quantitative
Before a term is given a precise definition, one should choose a method that is appropriate to what he is trying to find out (Hartman, 2004). There are two different methodological
approaches in research methodology, the qualitative and the quantitative method. The qualitative research points out the properties which can be measured with numerical values (Hartman, 2004), but quantitative data can also be known as raw data that can be treated as statistic (Ejvegård, 2003). While quantitative research involves planning, collection and analysis phase, which in turn means different stages requiring disciplinarily (Hartman, 2004). The contrast between quantitative and qualitative evidence does not distinguish the various research strategies (Yin, 1994). The amount of material that has been collected and shown says nothing. It must be understood, analyzed and interpreted (Ejvegård, 2003).
By the clear understanding of the project, it has been point out that the research presented in this thesis has taken a quantitative approach.
2.2 Approach
Combined with earlier mentioned methods, the writer has chosen then following tool method to achieve the given improvement suggestions.
2.2.1 Data Collection
Data collection for case studies can rely on many sources of evidence. The major data collection sources for case studies are divided into six categories; documentation, archival records, interviews, direct observation, participant-observation, and physical artifacts. For maximum benefits of these six sources of evince, three principals should be as followed; Use Multiple Sources of Evidence, Create a Case Study Data Base and Maintain a Chain of Evidence (Yin, 1994).
The gathered raw data in this thesis have been achieved by the company’s database,
observation and interviews. Thus the theoretical data gathered has been achieved by literature study through library database.
7
2.2.2 Literature study
Literature studies refer to research context to all virtually printed material such as books, reports, articles, essays etc. In order to obtain evidence, it is more appropriate to use the library database. Often, the researcher uses keywords for information; the writer should therefore consider what keywords are more suitable to use (Ejvegård, 2003).
Literature studies such as books have been partially gathered at the university library, and somewhat from previous courses within the program. Certain books have been found by examining references of similar literature. Scientific papers have been collected with the help of the university's database ABI/INFORM Global that searches through an extensive number of other scientific databases. Main keywords to find relevant literature have been: lean production, supply chain management, logistics.
2.2.3 Interview
The idea of interviewing a person is letting them tell you the resources being studied. An interview can be made in various ways; in general it has a high level of standardization and structuring. Standardization is a high level of quantitative studies, therefore meaning that all the people who may be interviewed will receive the same questions in the same order. While structuring refers to the extent to which questions limit the response (Hartman, 2004). Interviews can take time both on empirical level and working level. One must therefore be careful about which people are chosen for interview and prepare each interview thoroughly so it does not have to be taken again (Ejvegård, 2003).
Through interviews and documenting by taking notes, a deeper perspective has been given of what the production managers and operators think of the root cause analyses. The people being interviewed are all involved in the process flow. The question given was aimed to help gather valuable information of both positive and negative aspects in the process.
2.2.4 Observation
There are quantifiable, and standardized observation schedules; observation is not generally seen as very important method of data collection in quantitative research. This is because it is difficult to conduct observational studies on larger samples. Quantitative researchers argues that observation is not a very reliable data-collection method because different observers my record different observations. If used at all, observation is held to be only appropriate at a preliminary or ‘exploratory’ stage of research (Silverman, 2005).
Observation has been the key element in this project. It has given a broader perspective of how the production works, what to document, measure and where the failures occur.
8
2.2.5 Documentation
For case studies, the most important use of documents is to verify and increase the evidence from other sources. First, documentation is helpful in verifying the correct spellings and titles or names of the organization that might have been mentioned in an interview. Second,
documentation can provide other specific details to verify information from other sources. If the documented evidence is contradictory rather than corroboratory, then the case study investigator has specific reason to inquire further investigation into the topic. Third,
inferences can be made from documents. For example by observing the distribution list for a specific document, one may find new questions about communications and networking within an organization. However, this inference should be treated only as clues worthy of further investigation rather than as definitive findings, because the inferences could later turn out to be false leads. Because of their overall value, documents play an explicit role in any data collection in doing case studies (Yin, 1994).
In fact it is important in reviewing any document to understand that it was written for some specific purpose and specific audience other than those of the case study being done (Yin, 1994).
During this project the companies’ database and intranet has been used to collect data such as layout plants, measured time etc.
2.2.6 Reliability and Validity
In a scientific context, it is important that the observations satisfy the requirements of reliability and validity (Hartman, 2004). According to (Ejvegård, 2003) there are some specific aspect that must be taken into account in the technique being used, for example parameters, measurements, tests and research methods most be reliable and valid for being useful and appropriate. Not meeting these requirements, the research findings do not reach scientific value.
Reliability refers to make the same observation repeatedly, and that others can make the same observations (Hartman, 2004). One may be observant with reliable measurement within all sciences, because scientists often construct their own measurements question that diminishes its confidence (Ejvegård, 2003).
Validity refers to the researcher to really measure what is intending to be measured (Ejvegård, 2003). Validity has to do with how accurate observation is, that is how well it shows us the world as it is. The problem here is how to avoid confounding factors that undermine the validity, and how to assess the validity of different situations (Hartman, 2004).
Due to the long lead time of the selected products, all the collected data were prepared via the company’s own operative system, Customer Information Control System (CICS) also known as, Enterprise Resource Planning- system (ERP). The gathered data have been discussed with the supervisors and been confirm if the results are consistent with the real production time or not. These results have been accepted to be used in this thesis. The average times of 20 batches can also vary due to the available data in the CICS-system.
9
3 THEORETICAL BACKGROUND
3.1 LeanAccording to Womack, Jones, 1996 in (Liker, 2004) lean is defined as a five-step process: defining customer value, defining the value stream, making it “flow,” “pulling” from customer back, and striving for excellence. According to (Liker, 2004) Toyota's success in implementing these tools in their production systems is based on their philosophy to motivate their employees and be a learning organization. Their ambition of long-term thinking is what has made Toyota into today’s leading automaker.
The heart of lean is eliminating waste (Liker, 2004). In other terms it strives to optimize process over time, eliminate waste related to defect, unnecessary motion, job setup, unnecessary movements of materials, waiting and transportation of materials and jobs, in addition to high quality highly flexible cross-trained worker, to name few characteristics (Martin, 2008). It is important to know that the workers are the main pillar in any company, in which that they are the ones how are adding value to the process. This helps companies to achieve the absolute and perfect lean.
The advantage of the lean principle is the usage of simple tools and methods, which includes both workers from shop-floor up to the office floor (Martin, 2008). It creates
cost-effectiveness by increased flexibility and productivity. Nevertheless, Lean is nothing that is just implemented; it is a culture – a long term philosophy (Liker, 2004) the foundation of the Toyota Production System (TPS) comprises of 14 principals that can be divided into 4P model. The four principal groups are: Philosophy, Process, People and Partner and Problem
solving, as seen in figure (5) above.
10
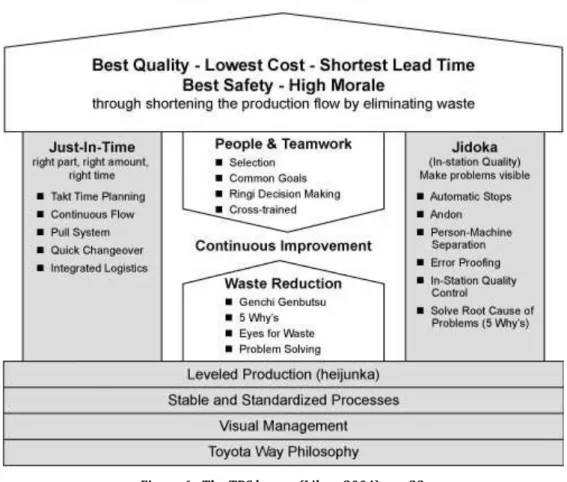
The Toyota production system “TPS house” is one of the most recognizable symbols in modern manufacturing.
Teaching TPS to supply workers was never ending stories, which lead Taiichi Ohno to assign Fujio Cho, his apprentice, to develop a simpler representation of its principle “a house”, as seen in figure (6) above. The principle of a house relies on stability, which implicates by using different tools and methods to achieve the basis of lean manufacturing. The roof
demonstrates the goal: best quality, lowest cost, shortest lead time, safety. The pillars are Just-in-Time: right part, right amount, right time and Jidoka: make problem visible. The
foundation involves Heijunka: stand for leveling the work flow, reliability and standardizing processes. The core of the house is people who add value by continuously improving and by eliminating waste. The philosophy of TPS is only strong if the roof, pillars and the foundation are strong, because a weak link weakens the whole system (Liker, 2004).
11
3.1.1 Lean principals
In this case study several of the 14 lean principles have been used to implicate a result that is needed to improve the lean production and work flow at the company. These methods are described below.
3.1.1.1 Building high-performance team
Well-performed team workers are not an accident. It is a vital asset within all companies. To create a high-performance team it has to be diverse and consist of all people that have a range of skills. It is important that the team is properly facilitated using standardized team-building, meeting management methods and also techniques. The team has to identify and understand the root cause of the problem to eliminate the waste. It’s been suggested that high –
performance teams undergo four stages of the process: evaluation; forming, storming, and performing (Martin, 2008). It is also important to know that individuals add value to the group as well (Liker, 2004).
3.1.1.2 Reliable and thoroughly tested technology
When a new technology is implemented without being truly tested, it can have a negative impact on the process. The technology must be first tested and evaluated carefully to prove that it adds value to the process. Nonetheless, it should current existing process before it is implemented. It’s important to understand that the people create real added value and the technology should only help them (Liker, 2004).
The new technology should be highly visual and intuitive and be used where it is needed. The most important factor is that it should support the actual work and not distract people from the value-added work. The technology should be implemented smoothly without any resistance and process disturbance (Liker, 2004).
3.1.1.3 Data collection
The most important step in data collection is asking the right question, to help support
activities that are related to the process of workflow. It is important that the team, who works on an initial set of question, collects the necessary data to complete the root cause analysis. A periodic evaluation of a team’s data collection is very important for the success of the project (Martin, 2008).
12
3.1.1.4 Continuous flow
In the manufacturing industry, the one-piece flow is desired to be a perfect ideal lean, but in reality this is not possible. By implementing several of lean tools and methods it is possible to create the near ideal of one-piece flow.
Continuous flow is when the material moves continuously through the process with minimal waiting time in between machines and shortest distance traveled. Continuous flow does not only increase efficiency in the process but also reduces time, but it shortens the cost to clash cycle and improves quality (Liker, and Meier, 2006).
The philosophy of continuous improvement associates with total quality management tool. To achieve high quality within flow, the teams make moderate process improvements within a function over an extended time period (Martin, 2007).
To achieve what is called a decent continuous flow that reduces lead time, following efforts should be taken to achieve (Petersson, et al., 2009):
Small buffers
Small packaging units
Frequent transportation
Short distance between machines
A buffer can be defined as staging area for work in process (WIP) or products in the queue; this causes a stoppage of the flow by which extends the lead time. Intermediate storage is necessary to compensate the losses in the flow, but it should be as small as possible. To define the reason behind the existence of a buffer, it is important to define the variances and
opportunities. Examples for intermediate storage are, long setup time, which in turn leads to larger batch sizes. The ideal of continuous flow strives for a specific amount of items in a batch. Minimizing batches also helps to achieve a proper continuous flow. To achieve smaller batch size, frequent transportation is needed, but if the batches are to be split in smaller sizes and the transportation are not increased, there is no gain in the flow. In ideal continues flow pieces are transported one by one to the next operation, e.g. on conveyer or carrier (Petersson, et al., 2009).
3.1.1.5 Pull system
A pull system/ scheduling is driven by external customer demand pattern (Martin, 2008). It creates flexibility in production so that exactly what has been ordered will be produced, when it is has been ordered, and in which quantity ordered it has been ordered. This leads to
eliminate overproduction-the most critical of the seven wastes (Kanban for the shopfloor, 2002). A pull system is an accumulation of several necessary elements that supports the process seen in figure (7) (Martin, 2008). Pull system is characterized by having small batches and relatively few products in the process. At the same time it can be difficult to implement pull system if the external demand changes rapidly.
13
This leads that many companies creates inventory at the company.
Deploying a team is necessary to carefully analyzing operational cycle times versus the required tact time, waste related to scrap and rework, distance traveled, operational motions, and other relevant factor associated with workflow configuration, so that the right shape pattern is designed. There are four types of shapes: Straight line, U-shaped pattern, L-shaped pattern, S-shaped pattern seen in figure(8) below. The U-shaped pattern is the most difficult shape to implement because workers can be both added and removed from the process, as tact time changes. If the cross-training has been performed well according to the lean tools and methods listed in figures, the Kanban system can be deployed to balance the work flow between work-cells and supplies. Kanban is described more in detail under the Kanban headline. The final step of pull system and Kanban is an implementation of single-piece flow. Single-piece flow is characteristic for transferring batches (Martin, 2008).
14
3.1.1.6 Heijunka; level out the workload
Heijunka has two different meanings, which are correlated as: one is the leveling of production by volume. The second term is, leveling the production by product category or mix (Jones, 2006). Leveling of production integrates the concept of leveling and line
balancing. Leveling is used in terms of balancing the work load to accomplishing the capacity or capability of the process (machine and workers). Heijunka incorporates the norm of
leveling, by attempting to balance work load at each process (Colemman, and Vaghefi, 1994). Leveling production puts customers order in a sequence of day-to-day to meet long-term demands. It eliminates peaks in the workload as well as excess production,
The advantages of implementing Heijunka are (Colemman, and Vaghefi, 1994):
Reduction in overall inventories.
Reduction of required productive capacity.
Reduction of lead time to the customer.
3.1.1.7 Just In Time
As written by (Epps, 1995), in the early 1980’s a new concept, known as “zero inventories” appeared in manufacturing industry. The “zero inventories” concept would save companies the cost of inspection, stocking, material handling, inventory tracking, carrying the inventory, and risk of damage and obsolescence. The concept is now formulated as just-in-time (JIT). The inventory has evolved into a corporate philosophy that seeks to do the process right at the first time and to eliminate any non-value added activities (Epps, 1995).
There are three basic stages of what JIT is and how it works. These stages are termed: (1) Kanban, (2) Production planning, and (3) Global management philosophy. These are not three separate stages but rather a migration path from using JIT, simply as a shop-floor-control tool (Kanban) to the installation of a factory wide global management philosophy (Epps, 1995). Other great advantages from implementing JIT are (Liker, 2004):
Flexibility
Reduced cycle-time
Reduced lead-time
Problem being clarified
To simplify just-in-time (JIT), deliver the right items at the right time in the right amount (Liker, 2004).
15
3.1.1.8 Jidoka (Autonomation)
One of Toyota’s main pillars is Jidoka, which means build in quality, certify that everything is done right the first time and stop the process if a problem occurs. Jidoka main principles are; build in quality and stop on failure. The most important prerequisite for a quality assured process is that all employees have the right skills and follow the established way of working. (Petersson, et al., 2009). Jidoka is also known as automation, which gives human-like
intelligence to a machine so it can stop itself when problems occur (Liker, 2004), making it possible to constantly certify the product quality (Petersson, et al., 2009).
Jidoka is supported by four key element of quality assurance:
Genchi Genbutsu,
Andon,
Standardization
Poka-Yoke
3.1.1.9 Visual control
Besides going to the actual place and see for yourself (Genchi Genbutsu) and see if that standardized work is followed, visual control can be implemented to see if the work is
performed to support pull flow and reduce the amount of reports, possibly on a piece of paper. Visual inspection is all about having a clean and organized workplace to eliminate waste. This can be achieved by using 5S; Sort, Straighten, Shine, Standardize and Sustain (Liker, 2004), Visual control can be performed in various forms. To make a problem visual, following procedures are used (Acord, 2001):
1. Color coding
2. Checklist, check sheets 3. Signal lights
4. Picture checks 5. Shadow boards
16
3.1.2 5S
5s is a tool to monitor and uplift the waste that contributes to errors, defects, and injuries in workshop. It certifies to give better quality and safety. 5S helps to achieve continuous flow in the process without any disturbance. The principals of 5s are according to (Liker, 2004):
1. Sort – sort through items and keep only what is needed while disposing of what is not needed
2. Straighten (orderliness) – “A place for everything and everything in its place”. 3. Shine (cleanliness) – The cleaning process often acts as a form of inspection that
exposes abnormal and pre-failure conditions that could hurt quality or cause machine failure.
4. Standardize (create rules) – Develop system and procedures to maintain and monitor the first three S’s.
5. Sustain (self-discipline) – Maintaining a stabilized workplace is an ongoing process of continuous improvement.
3.1.2.1 Go and see for yourself (Genchi Genbutsu)
To really understand and grasp the problem one must go and see for himself (Genchi Genbutsu), (Liker, 2004). Do not let someone else describe the problem for you and do not make decisions based on their description. Instead take advantage of the people around you. It is important to understand all aspects of the situation on your own. Your assumption should be based on facts which you have gained by analyzing and testing the product (Liker, 2004).
3.1.2.2 Standardization
Standardization is an important aspect in every manufacturing industry. But it is very difficult to implement and sustain the standardization. It has to be analyzed and documented in
slightest detail, while at the same time easy to understand. A good way to standardize work is to get the support from top management to initiate standardization (Martin, 2007).
Communication is another important feature of getting employees to understand the aspects of standardization and implementing techniques and methods that are good for the process. The easiest way to collect data and document on how work should be done is by implementing a local workgroup (Martin, 2007).
Standardization work is a combination of the best way to do a job, which is relevant to floor layout and diagrams that describe how the work is done most effectively. It shall include an analysis of the work, established standardization times on how to complete the work, list all the tools and methods that ensure the work is carried out correctly by the operator (Martin, 2007).
When the manual has been completed, each worker will be provided one, on how long time it takes to perform each task including material handling and walking distance to charge and discharge the process. There should also be a chart available which shows the flow of work between machines (Martin, 2007).
17
3.1.2.3 The seven + one wastes
There are seven types of waste in the Toyota production system (Hines, and Rich, 1997): 1. Over production: is considered a serious waste as it discourages a smooth flow,
inhabit quality and productivity. This tends to lead to overproduction, unnecessary lead and storage time. As a result its defects may not be detected.
2. Waiting: due to atomization, waiting have become one factor of waste. This clues to that the worker have to wait during the process which affects both goods and workers. Failure during previse process can also be an effect to waiting.
3. Transport: the customer demand has expended what the customers are paying for. So any unnecessary transportation is a waste. The company should have in mind to process the layout right the first time.
4. Inappropriate processing: machinery and tools that are used in a wrong way to recover large investment, when the same process can be made in a smaller machine. 5. Unnecessary inventory: large inventory are results of overproduction and storage cost.
It prologs the lead time and increases space.
6. Unnecessary motion: refers to where operators have to walk, stretch, search, bend or pick up are likely to lead to poor productivity and, often, to quality problems. 7. Defects: direct cost of rework and repair
8. Unused creativity: one should not ignore the workers thoughts and opinions
concerning how they carry out the work and creates value for the customer. One loses time, ideas, skills and learning opportunities.
3.1.2.4 Poka-Yoke
Poka-Yoke is a technical method which in Japanese means “mistake proofing”. It prevents undetected defected quality parts to go through workflow from the beginning. Poka-Yoke was introduced by Shigeo Shingo in the 1961 at Toyota Motor. One element of implementing Zero Quality Control (ZQC) is just Poka-Yoke. The core of Poka-Yoke is respect for human rights, and above all intelligence (Dudek-Burlikowska, and Szewieczek, 2009). To continue
improving the final product of the quality policy the PDCA cycle is used, as explained below.
3.1.2.5 PDCA
Plan-Do-Check-Act cycle (PDCA) is a key element to Poka-Yoke. It means continuous improvements of the quality measurement by using Poka-Yoke method (Dudek-Burlikowska, and Szewieczek, 2009):
Plan: select created defect and find its cause. Try to find as many as possible solutions to this problem and as many possible ways of Poka-Yoke.
Do: select the best Poka-Yoke solution, meeting the criteria and enter them.
Check: gather all the data of the problem and dissolution; after a thorough analysis one has to judge if Poka-Yoke method brings the expected effects. It is necessary to give a precise documentation regarding the audit and control of all mechanisms Poka-Yoke (there are special credit control Poka-Yoke).
18
3.1.2.6 Kanban
Kanban system, previously known as nervous system, is responsible for determining the production quantities. The benefit of Kanban is reducing overproduction and aiming to produce only what is ordered, when it is ordered, and in which quantities it’s been ordered. In Japanese the word “Kanban” means “card” or “sign”. It is an essential work order that moves with the material. The card categorizes part of subassembly units and indicates where each item comes from and where they are going. The key point of Kanban is to integrate information of the plant, connect the entire process one to another and to connect value stream and customer demand, so it stays harmonious. There are two different Kanban systems that can be used in manufacturing industry (Kanban for the shopfloor, 2002):
Transport Kanban: indicates numbers of orders to be removed from the production line or between processes in production or assembly. In addition to identifying the part and quantity, transport Kanban indicates where the part is from and where it is going. Within transport Kanban there is two types of Kanban; supplier and withdraw
Kanban’s.
- Supplier Kanban: are sent as orders to outside supplier
- Withdraw Kanban: are used between processes in the factory.
Production Kanban: indicates operation instruction for specific processes. Within this step there are also two types of production Kanban; production-ordering and signal Kanban.
- Production-ordering: is a type of Kanban routine used at process that do not
require changeover.
19
3.2 Logistics
The traditional base of logistic is within science and education with the purpose of doing things right in every way (Lumsden, 2006). Logistic can be said to be the science of effective’s material flow (Bjornland, et al., 2008). The logistic term includes both strategic and operational characteristics in material flow. The strategic concept means helping companies by out looking material-orientation to achieve an external efficiency, by doing
things right (Lumsden, 2006). The operational concept implies that the technician obtains a
high internal efficiency, by doing things right. It has become increasingly important to consider the logistics system as a supply chain, i.e. not to draw the line for the logistics system at the boundaries of the firm, without involving the entire material flow from raw materials to final consumption in the same system. Material handling is more complex in reality, therefore a simpler concept is illustrated in figure(9) below, (Jonsson, and Mattsson, 2005).
Figure 9 - Logistics management process, (Jonsson, and Mattsson, 2005), pp.61.
Supplier Procurement Operations Distribution Customers
Materials flow
20
3.3 Supply chain management
Supply chain management (SCM) strives to build a framework linkage of co-ordination between entities in the network, i.e. supplier and customers, and the organization itself. SCM’s goal in manufacturing is defined as reducing or eliminating the buffers of inventory that exists within an organization as well as demand and its current stock levels. The enhancement off SCM involves a significant change of the traditional thinking that typified buyer/supplier relationships in the past. Its focus is creating a co-operation, trust and the recognition it deserves for managing the “whole can be greater than the sum of its parts” (Christopher, 2011).
To define the management of upstream and downstream relationships with suppliers and customers in order to deliver superior customer to value at less cost to the supply chain as a whole.
To achieve a profitable outcome for all parties in the chain the focus is upon the management of relationship. The management thinking has been developed during the past two decades and in search for new strategies of providing great customer value. Michael Porter developed the concept of value chain. The value chain can be divided into two activity categories; the primary (operations, inbound logistics, outbound logistics,
service, marketing and sales) and support activities (human resource management,
infrastructure, procurement and technology development), illustrated in figure (10) above. The challenge’s that may occur is the self-interest of one party subsuming benefit of the chain as a whole(Christopher, 2011).
The phrase “supply chain management” is nowadays widely used. One can argue to change the phrase to “demand chain management” which should be driven by the market and not the supplier. Similarly the word “chain” should be replaced by “network” since there are
normally multiple suppliers and, indeed, suppliers to suppliers as well as multiple customers and customers’ customers to be included in the total system. The figure (11) seen below illustrates the firm being at the center of a network of suppliers and customer (Christopher, 2011):
21
Figure 11 – The network of chain. (Christopher, 2011), pp.3.
“A network of connected and interdependent organization mutually and co-operation working together to control, manage and improve the flow of materials and information from suppliers to end users” is a more accurate definition by (J. Aiteken, 1998, pp. 3, cited in
Christopher, 2011).
3.3.1 Value stream map
Value stream map (VSM) is a widely used qualitative lean tool to eliminate waste or Muda (Krajewski, et al., 2007) the value stream is the process flow from the “point of request” to “closure of all activity”. VSM has also brought us a valuable process mapping technique that enables everyone in an organization to visualize and understand a process; it makes it simple to differentiate value from waste. Drawing the process makes VSM pictures simple yet logical and powerful because it documents both the current state (i.e., reality) and the future state (i.e., the goal) (Nash, and Poling, 2008).In many processes the waste can be as high as 60 percent, and by drawing the VSM, its techniques enables us to see where the waste occurs and eliminate it (Krajewski, et al., 2007)
22
3.3.2 Material flow mapping
A good way to start analyzing the capital and logistic cost, is to map the flow of materials, which can be done by various charts. This is a good foundation for working with reduced turnaround time and tide-up capital cost (Jonsson, 2008). Nevertheless, VSM is a better way to identify the material flow because it takes into account various factors in the chain. (Krajewski, et al., 2007) Figure(13) seen below illustrates an example of a material flow chart.
Figure 13 - Material flow chart example, (Jonsson, 2008), pp.112.
3.3.3 Tied-up capital
Assets of a company can be divided into fixed and current assets. When investing in a tied asset it bounds capital, which effects the company’s cash flow and ability to pay. The material that flows within the supply chain represents a part of current assets that affects the
company’s total tide-up capital. Tied-up capital has a direct effect on profit and also indirect by affecting its deliveries. To be able to measure and analyze the logistic-performance it requires calculating the tied-up capital. The average tied-up capital expresses how much in total its bound to material flow or divided on inventory, work-in-process, finished goods, transportation etc. This can be expressed as tide-up capital in absolute terms, current assets or average lying time in current inventory items (Jonsson, and Mattsson, 2005).
If one wants to compare tide-up capital between stocks or departments and the company, it is not possible to use tied-up capital in absolute terms. Same goes for compare tied-up capital over time. Instead one may use inventory turnover (ITR) a simpler measurement which enables to compare directly between different measurement and items at the same point. ITR relates to how many times per year the average stock turnover happens. This expresses the total value of material flow during a certain period of time, often one year, but in relation to the average capital within same period that the bound existed in current flow. The
measurements can be applied to different parts in the flow but for an individual item to be calculated following formula can be used (Jonsson, and Mattsson, 2005):
23
ITR = 𝑎𝑛𝑛𝑢𝑎𝑙 𝑛𝑢𝑚𝑏𝑒𝑟 𝑜𝑓 𝑐𝑜𝑛𝑠𝑢𝑚𝑒𝑑 𝑢𝑛𝑖𝑡𝑠𝑎𝑣𝑒𝑟𝑎𝑔𝑒 𝑛𝑢𝑚𝑏𝑒𝑟 𝑜𝑓 𝑢𝑛𝑖𝑡𝑠 𝑖𝑛 𝑠𝑡𝑜𝑐𝑘
It is often more interesting to calculate ITR for a group of items or all stocked items. One assumes the turnover expressions as outbound value during time period of the average tide capital. A problem that could occur during calculation of ITR is the annual turnover that often is expressed as the annual turnover; however the goods value is based on the sale price while the bound capital is expressed as stock value where commodity value is based on its actual price of the goods. A more accurate calculation of ITR requires same principle as well as turnover for the bound goods (i.e. cost of sold goods and not sale price). An effect that can occur if, for example, the turnover is expressed as sale price and tide-up capital as a prime cost, will be that the turnover rate increases if the sale price increasing while the average stock is unchanged, which is obviously incorrect (Jonsson, and Mattsson, 2005).
For a more accurate calculation of average inventory and turnover rate following formula is used:
ITR = 𝑎𝑛𝑛𝑢𝑎𝑙 𝑡𝑢𝑟𝑛𝑜𝑣𝑒𝑟 𝑒𝑥𝑝𝑟𝑒𝑠𝑠𝑒𝑑 𝑎𝑠 𝑐𝑜𝑠𝑡 𝑜𝑓 𝑔𝑜𝑜𝑑𝑠 𝑠𝑜𝑙𝑑𝑎𝑣𝑒𝑟𝑎𝑔𝑒 𝑐𝑎𝑝𝑖𝑡𝑎𝑙 𝑡𝑖𝑒𝑑 𝑢𝑝 𝑖𝑛 𝑚𝑎𝑡𝑒𝑟𝑎𝑖𝑙 𝑓𝑙𝑜𝑤
Average storage time is one alternative for expressing the ITR rate. The higher inventory rate is, the lower storage time is and vice versa. Occasionally the average inventory or cover-time is used as alternative for average storage time.
Average storage time = 𝑎𝑣𝑒𝑟𝑎𝑔𝑒 𝑡𝑖𝑒𝑑−𝑢𝑝 𝑐𝑎𝑝𝑖𝑡𝑎𝑙 𝑖𝑛 𝑓𝑙𝑜𝑤 ∗ 52𝑑𝑒𝑙𝑖 𝑣𝑎𝑙𝑢𝑒 𝑝𝑒𝑟𝑦𝑒𝑎𝑟 = 𝐼𝑇𝑅1
The reason for using factor 52 is to express throughput time in weeks, without it the throughput time will be expressed in years (Jonsson, and Mattsson, 2005).
24
3.4 Production concepts and mathematical models
Due to the competiveness of the market and customers there are some common manufacturing strategies to apply within a company; these are (Bowersox, et al., 2010):
Make-to-plan (MTP)
Assemble-to-order (ATO)
Make-to-order (MTO)
Make-to-stock (MTS)
These strategies contain series of production steps such as: processing, assembly operations etc. it is important to take into account that there are operation of material handling, storage, inspection, and other nonproductive activities. These activities can be divided into two main categories, operations and nonoperation elements. The different production concepts and characters used in the calculation are shown below (Audo, 2013):
To = operation time
Tno = non operation time
Tsu = set up time
Nm = no of machines/operations
Q = no of units in batch i = operation sequence
W = Work centers or operators Sw = Shifts/Week
H = Hours
Dw = Weekly demand PC = Production Capacity
3.4.1 Manufacturing Lead-time
MLT is a measurement of the forgotten time between release of a work order to the shop floor and the completion of all work necessary to achieve ready-to-ship production status
(Bowersox, et al., 2010). MLT does not include the storage of raw material before its turn. The formula for MLT is defined as (Audo, 2013).
MLT = ∑𝑛𝑚𝑖=1(𝑇𝑠𝑢, 𝑖 + 𝑄 × 𝑇𝑜 + 𝑇𝑛𝑜, 𝑖)
If the operation and nonoperation times are equal, we can therefore summon the process in the following calculation (Audo, 2013):
25
It is convenient to think of lead time as being made up of five distinct components (Silver, et al., 1998):
1. Order preparation time: the time that passes from the moment it is decided to place order until it is actually transmitted from the stocking points.
2. Transit time to the supplier: negligible if the order is placed electronically by phone; several days if a mailing system is used.
3. The time at the supplier: if L is variable, this time is responsible for the most of the variability, and its duration is materially influenced by the availability of stock at the supplier when the order arrives.
4. Transit time back to the stocking point.
5. Time from the moment when the order is receipt until it is available on the shelf: often wrongly neglected; certain activities, such as inspection and cataloging, can take a significant amount of time.
3.4.2 Cost Information
There are three basic costs that are associated with inventories: holding also known as (carrying) cost, transaction (ordering), and shortage costs (Stevenson, 1999).
Holding (carrying) costs – is related to physically items in inventory. Costs includes interest, insurance, taxes (in some states) depreciation etc. Holding cost is stated of two ways: as a percentage of unit price or as a dollar amount per unit (Stevenson, 1999).
Ordering costs – are the costs of ordering and receiving inventory. They are the costs that vary with the actual placement of an order. It determines how much is needed, preparing invoices, and moving goods to temporary storage. Ordering costs are generally expressed as a fixed cost per order, regardless of order size. When a company produces its own inventory instead of ordering from a supplier, the cost of machine setups are analogous to ordering costs; is expressed as fixed charge per run, regardless of the size of the run (Stevenson, 1999).
Shortage cots – results when demand exceeds the supply demand. The costs include of not making sale, loss of customer goodwill late charges, and similar cost. Furthermore, if shortage occurs in an item carried for internal use (e.g., to supply an assembly line), the cost of lost production or downtime is considered a shortage cost. Such cost can easily run into hundreds of dollars a minute or more. Shortage costs are difficult to measure, and maybe subjectively estimated (Stevenson, 1999).
26
3.4.3 Setup cost
The calculation of the total EOQ can either be completed by holding cost or setup cost. Setup cost is also known as ordering cost which includes the cost of order forms, postage, telephone calls, typing of orders, and handling of vendor invoices. The setup cost includes many of these components and other costs that are related to interrupted production. For example the wage of the skilled mechanic that adjusts the production equipment for completing the setup, follows up by production of low quality or slow speed, while the equipment is fined-tuned and the operator adjusts to the new part. This is called the “learning affect” and results in a cost that is considered to be a part of setup cost because the result of the decision takes place in ordering. During the setup and learning period the cost of production and equipment is being lost because other items could be manufactured (Silver, et al., 1998).
Several of these factors can become quite complicated. Considering the wages of the skilled mechanic who performers the setup. If the person is paid only when setting up a machine, then the wages should clearly be a part of the setup cost. If it happens that the person is on salary and whether or not the machine is setup then the wages should be paid, and be a part of the cost. Because it depends on the use of the mechanic’s time when he is not setting up the machine, is he involved in other activates and whether it is on long-term or short-term
perspective is taken. There is another side of this story. If is decided not to setup the machine for this part we do not generate any savings in short-term, and the wages are still paid. This means that in the short-term the cost of the mechanic’s time is fixed and therefore, one can argue that the cost should not be part of the setup. It’s assumed that the mechanic’s time is used for other activities, than the key is whether a long-term or short-term perspective is taken. The long-term view suggests that the wages should be included, because the employee could later on be laid off, and the set up infrequently affects the money the firm pays. While the short-term view suggests that the wages should not be included. The final issue is if the long-term and short-term decision is being made. In most cases the setup cost are to be repeated decisions over a long period of time-say a year. This can lead to that the wages of this mechanic should be included in the fixed cost. In other words all costs that are relevant should be included in decision making (Silver, et al., 1998).
3.4.4 Production rate
Rp is expressed as an hourly rate (e.g. units of product per hour) for manufacturing process or assembly operations.
27
3.4.5 Utilization of OEE
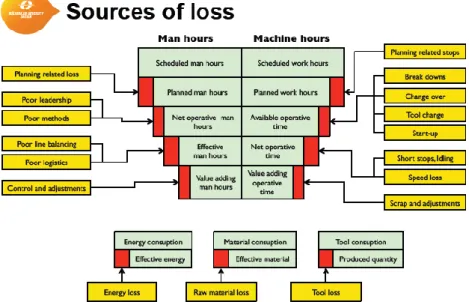
Utilization is the amount of output of a production facility relative to its capacity (Audo, 2013). Overall equipment effectiveness (OEE) is a hierarchy metrics to calculate how effectively a manufacturing operation is utilized. The OEE answers the following question: purpose of measurement, finding factors that are important, methods of measurement, timing and time frame, and owner of the process versus independent party (who should measure it). The main sources of losses that arise in manufacturing industry are listed below, figure(14) Given the sources of loss the machine hours of OEE for one machine can be calculated by the following formulas given below. Figure(15)
The total system loss takes to account of (Salonen, 2013):
Conveyor system between equipment
Overall computer system like MPS
Malfunctioning buffer systems
Power outs
Failures central system e.g. central lubrication
28
Figure 15 - Machine hours, (Salonen, 2013).
3.4.6 Work-in-process (WIP)
WIP is referred to the amount of product that is currently located in the factory that is either being processed or is between processing operations. WIP inventory is the state of being transformed from raw material to finished product. A rough measurement of WIP is as follows (Audo, 2013):
WIP = MLT (PC* U)/ (𝑆𝑤*H)
3.4.7 EOQ
The Economic order quantity (EOQ) is a replacement measurement of minimizing the combination of inventory carrying and ordering cost (Bowersox, et al., 2010). The rule of EOQ is indicating what quantities of items one must order, in so that to minimize the total cost associated with them. The arriving of EOQ is by balancing the fixed ordering cost per lot against the carrying costs. The rules for formulating the EOQ use the following assumption (Roach, 2005).
1. Demand is continuous and constant 2. The process continues infinitely 3. There are no quantity constraints 4. Replenishment is instantaneous 5. No shortages are allowed
29 The characters used in the calculation are listed below; TC = total cost of inventory
Q = order quantity I = inventory Cost = cost per unit R = inventory holding cost H = annual holding costs A = order cost/ per order
D = demand rate pieces per unit time (year) T = cycle period in years.
3.4.7.1 The lot size formula;
The average inventory calculation is Q/2 pieces. Then the period for cycle is T = Q/D where T is in years as seen in figure (16).
The number of cycle per year is also the number of order being placed per year is given by
D/Q. The annual cost of operating the system is given by:
𝑇𝐶 = 𝐶𝐷 + 𝐴𝐷
𝑄+ 𝐻
𝑄 2
In order to find the optimal batch size is by taking the derivative of the above formula with respect to Q and set the result equal to zero, by solving this equation the EOQ is calculated based on the formula below and shown in figure (17):
𝑄∗= √2𝐴𝐷
𝐻
30
The total EOQ can also be calculated by setup cost based on the formula below (Roach, 2005):
𝑄∗= √2𝐴𝐷
𝑆
3.4.7.2 Throughput time
Manufacturing throughput time is defined as the length time between the receiving of an order to the factory floor and its receipt into finished goods inventory or transported to the customer (Krajewski, et al., 2007).
3.5 From zero inventory to holding inventory
Volvo in Koping, Sweden is a make to order company that aims to have zero inventories. But given to the history of back orders, it wants to see economic cost by going back to the old fashion of having inventory if needed.
31
4
Current state analysis
In this following section of the current state there will be a description in detail on how the company's production is structured in the form of planning and production. This chapter reports the mapping of the processes and other data produced for the two articles being examined. All data contained in the value stream mapping is computed average values from the production company.
4.1 THE PLANNING SYSTEM
Below follows a short description of the company’s system to give an understanding of how the data has been collected for current state.
4.1.1 Central Planning Office
Central Planning Office (CPO) is the core system that has been available for about ten years at Volvo. This system handles all customer requests within unassembled condition plus components received by Volvo. The system breaks these two factors into two different directions. Components go on to Cost Control System (KKL/ CCS) and on to Assembly system (SHIP) and later into Global Assembly Steering System (GASS) which then
eventually end up with material handling, which announces that the topic should be delivered to the respective station.
Unassembled parts send its orders on to the Material Management System (MMS) plus CICS (TJ 52) and the OST system. Unassembled parts that are called off go forward to Material handling.
An alarm must be addressed in CPO otherwise it could have major problem or consequence for Volvo. All information will then not be unavailable in subsequent systems (Myberg, B Volvo, 2014)
32
4.1.2 Material Management System
Material management system (MMS) is divided into six external applications within MMS. This application helps to handle material within Volvo. It has similar application handling as APS-system.
MMS shows all order placed in CPO by customers (external customer or Assembly line at Volvo Plant) require a part number.
MMS has an application that show alarms, which material is low or is not on hand for a specific Gearbox. It views information about part number such as price, weight etc. and shows every internal transaction of scrap or batch movements it has been done.
It is also a master of balance that forwards the balance information to PipeChain. PipeChain calculates the demand versus available demand that is sent from MMS, thereafter EDI is sent to supplier.
4.1.3 Customer Information Control System (CICS)
CICS works as an ERP system, where it handles information like, production schedule, cycle time, lead time, start production, actual start time etc. CICS breaks information into four applications; TIPS, OST, ART info and HETS.
TIPS – manufacturing in control planning system
OST – control manufacturing order
ART info – article information
HETS – home delivery system
Codes that start with TJ, hold information of today’s production scheduling and from yesterday. This information is involved within TIPS.
Codes that start with TA, involve information of priority scheduling, effectiveness of machine and external information of how to control manufacturing in most effective way. This
information is placed within OST.
Codes that start with TD, involve more detailed information of each article within Volvo. These codes are broken into ART info application.
Codes starting with TN, handles information when a material is delivered to the factory, and how is responsible for material handling. Information is broken into HETS. (Hemlin, J. Volvo, 20114)