Hydration of Dimethyldodecylamine-N-oxide: Enthalpy and Entropy Driven Processes
Vitaly Kocherbitov*,†and Olle So1derman‡Biomedical Laboratory Science, Health and Society, Malmo¨ UniVersity, SE-205 06 Malmo¨, Sweden, and Physical Chemistry 1, Center for Chemistry and Chemical Engineering, P.O. Box 124, Lund UniVersity, S-221 00 Lund, Sweden
ReceiVed: February 13, 2006; In Final Form: April 13, 2006
Dimethyldodecylamine-N-oxide (DDAO) has only one polar atom that is able to interact with water. Still, this surfactant shows very hydrophilic properties: in mixtures with water, it forms normal liquid crystalline phases and micelles. Moreover, there is data in the literature indicating that the hydration of this surfactant is driven by enthalpy while other studies show that hydration of surfactants and lipids typically is driven by entropy. Sorption calorimetry allows resolving enthalpic and entropic contributions to the free energy of hydration at constant temperature and thus directly determines the driving forces of hydration. The results of the present sorption calorimetric study show that the hydration of liquid crystalline phases of DDAO is driven by entropy, except for the hydration of the liquid crystalline lamellar phase which is co-driven by enthalpy. The exothermic heat effect of the hydration of the lamellar phase arises from formation of strong hydrogen bonds between DDAO and water. Another issue is the driving forces of the phase transitions caused by the hydration. The sorption calorimetric results show that the transitions from the lamellar to cubic and from the cubic to the hexagonal phase are driven by enthalpy. Transitions from solid phases to the liquid crystalline lamellar phase are entropically driven, while the formation of the monohydrate from the dry surfactant is driven by enthalpy. The driving forces of the transition from the hexagonal phase to the isotropic solution are close to zero. These sorption calorimetric results are in good agreement with the analysis of the binary phase diagram based on the van der Waals differential equation. The phase diagram of the DDAO-water system determined using DSC and sorption calorimetry is presented.
1. Introduction
During hydration of surfactants, two types of processes can take place: uptake of water by a single phase (when properties of the phase change continuously with gradual addition of water) and uptake of water with a phase transition (for example, when the addition of water causes a transition from one liquid crystalline phase to another). Hydration of a single phase without a phase transition can in principle be driven by entropy, by enthalpy, or by entropy and enthalpy simultaneously.1Hydration with a phase transition can be driven either by enthalpy or by entropy but not by both potentials simultaneously1(the enthalpic and entropic characteristics of isothermal phase transitions are not independent).
One issue extensively discussed in the literature is the driving force underlying the hydration of surfactants without phase transitions at low water contents (or at low interlamellar distances in lamellar structures). There are two different concepts used to describe the hydration at low water contents: one concept describes the hydration as entropy driven, making use of the so-called “protrusion forces”.2-4According to this idea, the hydration is caused by the thermal motion of the surfactant moleculessthe surfactant molecules protrude into the water layer, giving rise to a repulsive force between the bilayers.
According to another concept,5,6 hydration of bilayers is driven by enthalpy. The forces that arise from strong interactions
between water molecules and surfactant or lipid headgroups are commonly called “hydration forces”. Several studies of surfac-tant and lipid systems7-9 showed that the hydration in those systems is endothermic and therefore driven by entropy. These results were in agreement with the concept of the protrusion forces. On the other hand, there is data in the literature indicating that the hydration of dimethyldodecylamine-N-oxide (Figure 1) is driven by enthalpy.10
A method that can directly measure enthalpic and entropic parameters of hydration is the method of sorption calorimetry.11-13 Using this method, one can directly measure the partial molar enthalpy of mixing of water and the partial molar entropy of mixing of watersthe parameters that quantitatively characterize the driving forces of hydration. Here, we report a sorption calorimetric study of the hydration of DDAO. The driving forces of hydration and of the phase transitions are discussed. The phase diagram of the system DDAO-water determined calori-metrically is also presented.
2. Materials and Methods
DDAO, 98% purity, was purchased from Aldrich Chem. Co. It was dried in a vacuum in contact with 3 Å molecular sieves during 24 h prior to use. To prevent sorption of water by the surfactant, the transfer of the sample from the vacuum-drying pistol to the calorimetric cell was performed in dry nitrogen atmosphere.
Sorption calorimetric experiments were conducted in a two-chamber sorption calorimetric cell inserted in a double-twin microcalorimeter.11,12The studied samples were placed in the
* To whom correspondence should be addressed. Tel: +4640 6657946. Fax: +4640 6658100. E-mail: Vitaly.Kocherbitov@hs.mah.se.
†Malmo¨ University. ‡Lund University.
10.1021/jp060934v CCC: $33.50 © 2006 American Chemical Society Published on Web 06/20/2006
upper chamber, while in the lower chamber pure water was injected. When desorption calorimetric experiments were per-formed, the hydrated sample was placed in the upper chamber, while in the lower chamber a salt solution was injected. The salt solution was used as a vapor sink.13The activity of water in the sorption experiments was calculated as described in ref 14. For accurate calculation of the partial molar enthalpy of mixing of water, the sorption calorimeter was calibrated using magnesium nitrate as a standard substance.15
DSC experiments were done using a differential scanning calorimeter DSC220 from Seiko Instruments in different tem-perature ranges between 10 and 200°C. Samples with masses from 2 to 15 mg were put into aluminum pans and then hermetically sealed. Most of the samples were studied using a scan rate of 1°C/min. In some cases, other scan rates, such as 0.5 and 2°C/min were used. Masses of the pans were controlled before and after the experiments.
3. Results and Discussion
We have performed sorption calorimetric experiments at 25, 40, and 60°C and desorption experiments at 25°C using normal water. We also performed sorption calorimetric experiments using heavy water at 25°C. The data on water activity and the partial molar enthalpy of mixing of water obtained in sorption experiments at all studied temperatures, as well as some DSC data, are presented in the Supporting Information. In what follows, we will use some of these data to discuss the solid-state behavior of DDAO, the driving forces of the hydration of liquid crystalline phases without phase transitions, and, finally, the driving forces of the phase transitions found in this system and the binary phase diagram.
Solid-state Behavior of DDAO. One of the key problems
of the phase behavior of DDAO is the formation and stability of its monohydrate. Sparrman and Westlund16 referring to Lutton17claimed that the monohydrate is not destroyed even after drying in a vacuum. Since they assumed that the sample dried in a vacuum was a monohydrate, the water-to-DDAO mole ratio was presented as a sum of a weighed mole ratio and 1, where 1 mol of water comes from the monohydrate. Neverthe-less, Lutton17reported that DDAO could be completely dried by refluxing in hexane with a moisture trap. For the following reasons, we suggest that the sample we used was not a mono-hydrate but dry surfactant. First, the supplier of the chemical claimed that it was in the waterless state, and the elementary analysis provided by the supplier was consistent with this statement. Second, we dried the sample in a vacuum over 3 Å molecular sieves, which is an efficient drying procedure used to dry such hydrophilic substances as proteins.18Third, our data on water sorption on DDAO (see the discussion below) also show that the sample was not a monohydrate.
All the sorption calorimetric experiments performed on the DDAO-water system can be divided into two groups, repre-senting two different ways of hydration of this surfactant. In one group of the experiments, abrupt changes of both water activity (Figure 2) and partial molar enthalpy of mixing of water (Figure 3) were observed at a water/DDAO mole ratio of 1. In the other group of experiments (shown with dashed curves in Figures 2 and 3), no changes were registered at this composition.
Note that, at higher water contents, the values of aw and Hw m were very similar for both groups of experiments. This means that the water content in the dried initial samples used in the two groups of experiments was practically the same. The abrupt changes of both measured thermodynamic parameters at a mole ratio of 1 can only be explained by the formation of a mono-hydrate in the first group of experiments. This clearly shows that the initial sample was not a monohydrate but a water-free surfactant.
In the curves recorded in the experiment with monohydrate formation, there are two plateaus, corresponding to two different two-phase regions. The first one (from 0 to 1 water per sur-factant) is the formation of the monohydrate from the anhydrous DDAO. The high noise observed in both activity and enthalpy curves in this composition range is due to slow kinetics of this reaction since both anhydrous surfactant and the monohydrate are solid substances (and probably centers of nucleation are required for the reaction). The next regime (from 1 mol/mol) does not show that much noise because the melting of the monohydrate into a liquid crystalline phase goes without kinetic problems. When hydration occurred without the formation of a monohydrate (dashed curves in the Figures 2 and 3), the plateaus Figure 1. Molecule of dimethyldodecylamine-N-oxide (DDAO).
Figure 2. Water activity as a function of water/DDAO mole ratio
(nwater/nDDAO) at the beginning of hydration of DDAO at 25°C. The
dashed curve shows an experiment when the monohydrate was not formed, while the solid curve shows an experiment with formation of the monohydrate.
Figure 3. Partial molar enthalpy of mixing of water as function of
mole ratio (nwater/nDDAO) at the beginning of hydration of DDAO at 25
°C. The dashed curve shows an experiment when the monohydrate was not formed. The solid curve shows an experiment with formation of the monohydrate.
in the curves corresponded to the direct formation of a liquid crystalline phase from the dry surfactant.
Since there are two ways with which the hydration of DDAO can occur (with formation of monohydrate and without), a question arises: which way represents the stable equilibrium process and which way represents a metastable process? To answer this question, one has to compare the Gibbs energies of the system in these two processes. The total Gibbs energy of a binary system consists of two contributions: the first one depends on the properties of pure compounds at the given temperature and pressure and the second one is the Gibbs energy of mixing (Gm). The first contribution is the same in both processes, therefore we will compare Gmof the system in the two processes. The Gibbs energy of mixing can be calculated in the following way
In both of the two considered ways, the hydration of DDAO occurs through two-phase equilibria, where water activities are constant. However, in the real experimental data, the plateaus corresponding to the two-phase situations are not perfectly flat (Figure 2) due to the kinetics of sorption and the heat conduction in the calorimeter. Therefore, in the integration of water activity, we did not use the experimental curves but only constant values of aw, obtained from these curves. The plot of Gmof the system during the two different ways of hydration with respect to water content is presented in Figure 4. From the plot, it appears that the Gibbs energies of the system when the monohydrate is formed are lower than the Gibbs energies of the system observed without the formation of the monohydrate. Therefore, the hydration of DDAO with the formation of monohydrate is the equilibrium path, while the direct transition from the dry surfactant to the liquid crystalline lamellar phase is a metastable process.
Driving Forces of the Hydration of the Liquid Crystalline Phases. For many surfactants and lipids it has been shown that
their hydration is driven by entropy.7-9In contrast to this, Mol et al.10 after measuring water activity in the DDAO-water system at two different temperatures 18 and 49 °C have concluded that the hydration is driven by enthalpy and the hydration forces are more important than the steric-protrusion force. The sorption calorimetric method is another way to determine the driving forces of hydration. Its main advantage is that all the needed data are collected at one temperature and two sets of data (enthalpy and water activity) are recorded simultaneously. This allows one to calculate the entropy of
mixing, thus separating enthalpic and entropic contributions to Gibbs energy of mixing.
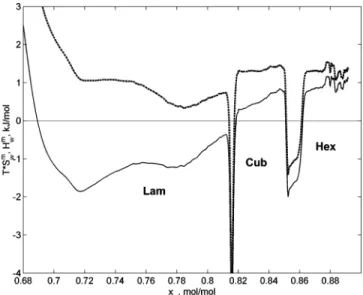
The results of the measurements of the partial molar enthalpy of mixing of water Hwmand the partial molar entropy of mixing of water Swmin an experiment with normal water at 25°C in the concentration region of liquid crystalline phases are presented in Figure 5. The two peaks at approximately 81 and 85 mol % of water are transitions from lamellar to cubic and from cubic to hexagonal phases, respectively. From the enthalpy plot, one can see that Hwmis negative (exothermic) in the lamellar phase, while in the cubic and the hexagonal phases Hwm is positive (endothermic). While the signs of Hwmare different in different phases, Swmis positive in all one-phase regions formed by liquid crystalline phases of the system at these conditions (dashed curve in Figure 5). This means that entropy is one of the driving forces of hydration in all of the liquid crystalline phases of this system. In the cubic and hexagonal phases, hydration is enthalpically unfavorable and is driven only by entropy. In the lamellar phase, however, hydration is driven by both enthalpy and entropy. The driving forces of hydration of the liquid crystalline phases of the system DDAO-normal water at 25°C are summarized in Table 1. These results are in partial agreement with the results of Mol et al.10 Both studies show that the hydration of the lamellar phase is exothermic. However, for the cubic and hexagonal phases, the two studies provide opposite signs of Hwm (although the absolute values of Hwm are rather low according to our data). We suggest that the reason for the difference lies in the fact that in ref 10 the enthalpy was calculated from the temperature dependence of water activity using only two temperatures: 18 and 49°C. This temperature range is rather wide, and since the phase boundaries of the cubic phase in this system have substantial slopes (see the phase diagram section below), a phase transition could occur between the two temperatures. A phase transition does not allow for interpretation of the positive dependence of the water activity Figure 4. Gibbs energy of mixing of DDAO with water calculated
according to eq 1 as a function of the water/DDAO mole ratio (nwater/
nDDAO).
Gm) RT
∫
0nw
ln awdnw (1)
Figure 5. Partial molar enthalpy (solid curve) and entropy (dashed
curve) of mixing of water as functions of the mole fraction of water at 25°C.
TABLE 1: Driving Forces of the Hydration of Liquid
Crystalline Phases in the DDAO-Water System at 25°C
phase sign of Hwm sign of Swm driving force
lamellar - + S and H
cubic + + only S
on temperature at constant composition (observed by Mol et al.) as an evidence for the negative sign of Hwm.
Hydration of the Lamellar Phase. The exothermic enthalpy
of the hydration of the lamellar phase is not the only parameter that differs the hydration of DDAO from that of other surfac-tants. Another interesting feature is the shape of the Hwmcurve in the concentration region of the lamellar phase. The enthalpy curves obtained during the hydration of lamellar phases in other surfactant systems are featureless horizontal lines.7,8,19In the case of DDAO, the enthalpy of hydration of the lamellar phase significantly increases with water content and has a shallow maximum followed by a minimum (Figure 6). Similar results were obtained in experiments with heavy water at 25°C: the shape of the enthalpy curve was similar but the absolute values were lower (more exothermic). Interestingly, the difference in the compositions of the maxima and the minima at all studied temperatures is 0.5 water molecules per DDAO molecule. Moreover, all of the shallow peaks appear approximately at half-integer values. These facts show that the interactions of the DDAO molecule with water molecules are strong (stronger than those in other studied nonionic surfactant systems). This observation is rather interesting, since in the DDAO molecule there is only one polar atom that can interact with water molecules (the oxygen atom), while in glucosides and maltosides (that feature endothermic hydrations of the lamellar phases7,8,19) there are many oxygen atoms. The reason for strong DDAO-water interactions is probably to be found in the high polarity of the nitrogen-oxygen bond of this surfactant, which makes the oxygen atom highly charged and therefore strongly interact-ing with water. The minima on the enthalpy curves coincide with the minima on the entropy curves, which indicates that the DDAO-water mixtures corresponding to the minima are more energetically favored and more ordered than other compositions. The compositions corresponding to the minima can be extra stabilized because of formation of hydrogen-bonded complexes of water with DDAO. The formation of such complexes can be expected at integer water/DDAO mole ratios or half-integer ratios (if one water molecule is shared between two surfactant molecules).
At higher temperatures, both the maxima and the minima on the enthalpy curves are displaced to higher water contents compared with their positions at 25 °C. This fact can be explained by the interplay between enthalpic water-DDAO interactions and entropic interactions of the hydrocarbon chains. The hydrated headgroups can be considered as complexes of the hydrophilic moiety of the surfactant and water molecules.
The relative stability of the complexes depends not only on DDAO-water interactions but also on interactions between surfactants. At higher temperatures, the disorder in the chains leads to an expansion of the hydrophilic layer in the plane of surfactant headgroups, thus increasing the area per headgroup. Since water-surfactant complexes can occupy more space at higher temperatures, the complexes with a higher number of water molecules become more stable at higher temperatures and hence the minima on the enthalpy curves move to higher water contents.
Another interesting observation concerned with the DDAO-water interactions was made by Sparrman and Westlund20in an NMR study of the lamellar phase in DDAO-2H
2O mixture. They noticed that the correlation timeτc increases with tem-perature. To explain this, Sparrman and Westlund20interpreted τc as a weighed sum of two different correlation times: τc) P1τ1+ P2τ2, where P1is the fraction of “bound” water. How-ever, this explanation implies that the amount of bound water increases with temperature, which in the general case is not expected. Nevertheless, the temperature dependence of the position of the minimum on the enthalpy curve (Figure 6) can be interpreted from the point of view of the amount of bound water. In a hydrogen-bonded complex of DDAO and water corresponding to a minimum on the enthalpy curve, most of the water molecules can be considered as bound. At higher water contents, more water molecules are not bound. Since the min-imum on the enthalpy curve shifts toward higher water contents at high temperatures, the amount of bound water is higher at higher temperatures.
The key argument in the discussion presented above is the strong interactions between the DDAO headgroup and water molecules. To prove this, we are currently performing ab initio calculations of DDAO-water hydrogen-bonded complexes (to be presented elsewhere). The preliminary results of the calcula-tions show that the hydrogen bonds between DDAO and water are stronger than between water molecules. This fact explains the exothermic values of the hydration of this surfactant at low water contents. Still, further studies are needed to obtain a detailed molecular-level picture that leads to the specific shape of the curves of Hwmin the lamellar phase of the DDAO-water system.
Driving Forces of the Phase Transitions in the DDAO-Water System. Unlike hydration without formation of a new
phase, hydration-induced phase transitions can be driven only by enthalpy or by entropy but not by both enthalpy and entropy simultaneously.1The melting of crystalline phases is usually driven by entropy, transitions to liquid crystalline phases with higher curvatures are driven by enthalpy, and transitions to phases with lower curvatures (for example, transitions from lamellar phases to reverse phases) are driven by entropy.1The parameter that can be used to quantify the driving forces of phase transitions is the enthalpy term of the van der Waals differential equation1,7,21
where superscripts 1 and 2 denote two different phases and ∆x1f2is the width of the two-phase region expressed in mole fraction. This parameter can be written in terms of entropy
Equation 3 shows that the enthalpic and entropic characteristics of isothermal phase transitions are not independent. If a Figure 6. Partial molar enthalpies of mixing of water in the
DDAO-water system in the composition region of the lamellar liquid crystalline phase at 25, 40, and 60°C as functions of the mole ratio (nwater/nDDAO).
H1f2) H(2)- H(1)- ∆x1f2
(
∂H∂x
)
T,P(1)
(2)
transition is driven by enthalpy (H1f2< 0), then the entropy term S1f2 is also negative; in other words, the transition is entropically unfavorable. If both H1f2and S1f2are positive, then the transition is driven by entropy. The van der Waals differential equation
can be used to calculate the slopes of the phase boundaries from the isothermal data. It can also be used to calculate the enthalpy term H1f2from the data on the slope of the phase boundary. At isothermal-isobaric conditions, it can be written in the following form
The enthalpy term of the van der Waals differential equation can be obtained from the sorption calorimetric data15
where r is the water/surfactant mole ratio and xsis the mole fraction of surfactant. According to eq 6, H1f2is the area under the peak on the enthalpy vs mole ratio curve multiplied by the mole fraction of the studied substance (in the present case DDAO) in the second phase. The enthalpy and entropy terms H1f2and S1f2calculated for the phase transitions in the system DDAO-water at 25°C using eq 6 are presented in Table 2. One has to note that, in the cases when the first phase is a solid phase, the baseline level Hwm(1)cannot be seen. In those cases (marked with a letter “c” in Table 2), the baseline was taken to be zero, and the obtained values of H1f2and S1f2should be considered as approximate. Table 2 shows that the transitions from the solid phases (dry surfactant or monohydrate) to the lamellar liquid crystalline phase are driven by entropy (H1f2 and S1f2are positive). These phase transitions can be considered as a “melting” of the solid crystalline phases which should be endothermic. For the other three phase transitions, H1f2 and S1f2are negative and thus the transitions are driven by enthalpy. In the case of formation of the monohydrate from the dry surfactant, the exothermic heat effect arises from the formation of strong hydrogen bonds between DDAO and water. In the case of the transition between liquid crystalline phases, the entropic and enthalpic effects are caused by curvature changes. In both transitions (from the lamellar to the cubic and from the cubic to the hexagonal phases), the curvature increases. As a result of the increase of curvature, the geometry of the phase becomes better adjusted to the geometry of the hydrated sur-factant molecules (which have a large area per headgroup), which produces an exothermic heat effect and thus a negative H1f2. From the entropic point of view, when curvature increases,
the tails become more confined inside the hydrophobic part of the phase1and the entropy decreases (S1f2is negative).
Having equilibrium data on awand Hw m
as functions of water content, one can analyze the driving forces of the phase transitions caused not only by hydration but also by dehydration. As long as the data on awand Hw
m are equilibrium data, then the actual way of obtaining them (by sorption or desorption of water) does not matter. In the case of dehydration, the driving forces of a phase transition should be seen through the sign of H2f1, where the water content in phase 2 is higher than that in phase 1. Relabeling the phases in eq 6, one gets the expression for H2f1
From Table 2, one can see that the parameters H1f2and H2f1 for the considered phase transitions have opposite signs but different absolute values. The dehydration-induced transitions from the lamellar liquid crystalline phase to the solid phases are driven by enthalpy (crystallization is exothermic), and dehydration of the monohydrate is driven by entropy (arises from the release of water of crystallization). The transitions between liquid crystalline phases (from the phases with higher curvature to the phases with lower curvature) are driven by entropy (the number of microstates available for the tails in a less confined structure increases).
As was mentioned above, the value of the enthalpy term of the van der Waals differential equation H1f2or H2f1(and the driving forces of the phase transitions) can also be determined from the slopes of the phase boundaries and the water activity data (see eq 5). Here, we demonstrate this for the transition between the cubic phase and the hexagonal phase at 25°C. The data on the water activity at 25, 40, and 60°C are presented in Figure 7 (the data on several temperatures are needed to calculate the slopes of the phase boundaries dT/dx). At 25°C, the derivatives of the water activity with respect to the water content daw/dxw are 4.04 and 3.74 for the cubic and the hexagonal phases, respectively. The slopes of the phase boundaries for the transitions cub f hex and hex f cub are almost equal (about 1250 K). The results of the calculations of the enthalpy terms using eq 5 are H1f2 ) -171, for the transition from the cubic to the hexagonal phase, and H2f1) 169, for the transition from the hexagonal to the cubic phase. These values are in a good agreement with the values calculated form Hwm presented in the Table 2 (especially taking into account the high uncertainties in the values of∆x and dT/dx). In Table 2, we did not include any data on the transition between the hexagonal phase and the isotropic micellar solution which takes place upon further addition of water. This transition could not be observed in our calorimetric experiments, including experiments performed using the method of desorption calo-rimetry13specially developed for studies of samples with high water contents. Still, the transition takes place: a sample that
TABLE 2: Thermodynamic Parameters and Driving Forces of the Phase Transitions in the DDAO-Water System transition (1)-(2) T, °C aw xw(1), mol/mol ∆xw, mol/mol H1f2, J/mola S1f2, J/mol/K driving force (1) f (2) H2f1, J/mola S2f1, J/mol/K driving force (2) f (1) Dry-MH 25 0.15 0 0.5 -4000c -14c H 8000c 27c S MH-lam 25 0.27 0.5 0.20 7500c 25c S -13990 -46.9 H Dry-lamb 25 0.19 0 0.65 6600c 22c S -22000 -74 H Lam-cub 25 0.648 0.814 0.003 -58.6 -0.196 H 78.7 0.264 S Cub-hex 25 0.790 0.854 0.0083 -173 -0.597 H 181 0.607 S
aH1f2and H2f1are calculated from eqs 6 and 7, respectively.bMetastable phase transition.cApproximate values, H w
m, in the initial phase are
not known and taken as zero.
V1f2dP ) S1f2dT + (∂2G/∂x2)T,P(1)∆ x1f2dx (4)
(
dT dx)
(1) ) -RT2(
d ln a1 (1 - x) dx)
T,P (1) ∆ x1f2 H1f 2 (5) H1f2) xs(2)∫
r(1) r(2) (Hwm- Hwm(1)) dr (6) H2f1) xs(1)∫
r(2) r(1) (Hwm- Hwm(2)) dr (7)contains 30 wt % of DDAO is a liquid, and a sample that contains 40 wt % of DDAO is a hexagonal phase, in agreement with the phase diagrams published in earlier studies.10,17,22,23 The reason the transition to the micellar phase is not seen in the sorption calorimetric experiments is the combination of two factors. The first factor is the high water activity. The plateau on the activity curve corresponding to the phase transition cannot be seen because the water activity is close to 1 and therefore does not have any significant slope. The second factor is a very low value of H1f2for this transition. The value of the enthalpy and entropy involved in this transition is low because of two effects acting in opposite directions. One effect is a small increase of curvature in the finite micelles compared with the infinite cylinders of the hexagonal phase, resulting in a decrease of the entropy because of the small increase of the confinement of the hydrocarbon tails. The other effect is the formation of micelles that have motional freedom and therefore are more disordered compared with the cylinders in the hexagonal phase; this effect increases the entropy. Still, many properties of the cylinders in the hexagonal and the micellar phases are very similar which decreases the absolute value of H1f2even further. According to eq 5, the zero value of H1f2should give an infinite slope of (dT/dx)(1), that is, vertical phase boundaries. The phase diagrams published earlier10,17,22,23show that the phase bound-aries between the hexagonal and the isotropic micellar phases are indeed close to vertical (see also Figure 8).
DSC and the Phase Diagram. The phase diagram of the
DDAO-water system was presented in several publica-tions.10,17,22,23Still most of them are adapted from the work of Lutton published in 1966. All of the phase diagram of this system show the phase behavior of DDAO at low water contents rather schematically. The data obtained in the present work allows us to improve the phase diagram of the DDAO-water system.
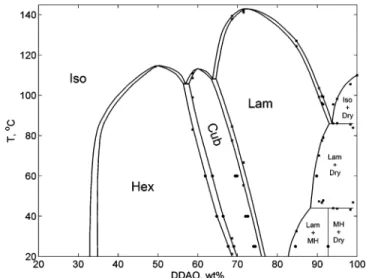
Using sorption calorimetry, one can register most of the phase transitions in the binary system. Still, a sorption calorimetric experiment is performed under isothermal conditions, therefore isothermal phase transitions, such as eutectic and peritectic transitions cannot be seen using this method. Combination of sorption calorimetry with differential scanning calorimetry (DSC) allows us to resolve all the phase transitions and to obtain the whole binary phase diagram. The DDAO-water phase diagram obtained using the two calorimetric methods is presented in Figure 8.
One has to note that at high temperatures amine oxides are not stable and are chemically degraded.24Therefore, all of the phase transitions observed in this system at temperatures above 100°C are influenced by chemical degradation of the surfactant. For example, the melting point of the anhydrous DDAO (shown in the phase diagram as 110°C) was sensitive to the DSC scan rate and was much broader than a typical melting point of a pure substance. Moreover, we observed a significant endother-mic heat effect produced by the dry sample in the isothermal regime of the DSC experiment near the melting point. These observations indicate that the melting of the solid DDAO was partly caused by its chemical degradation. At higher water contents, some of the transitions above 100°C were exothermic, that is, caused by a chemical reaction and therefore are not shown in the phase diagram.
The most complicated phase behavior in this system is at the low water content region of the phase diagram. In the beginning of the article, we discussed the existence of the monohydrate of DDAO. The monohydrate exists at 25°C, but at higher temperatures, it was not observed. Therefore, at low temperatures, the lamellar liquid crystalline phase is formed from the monohydrate, and at higher temperatures, it is formed directly from the dry surfactant. The point of the transition between the two regimes of the formation of the lamellar phase is a peritectic point. Above this point, the monohydrate does not exist. On DSC scans, the peritectic point is seen as a prominent peak. Interestingly, the temperatures corresponding to the peak are higher at water contents above the monohydrate composition than at water contents below the monohydrate composition: 47 and 44°C, respectively (because of the specific shapes of the baselines, the temperatures were determined as maxima on the DSC curves). This may be explained by superheating of the monohydrate above the peritectic point. Above this point, the biphasic system dry DDAO + the lamellar phase has a lower Gibbs energy than the biphasic system monohydrate + the lamellar phase, but the absence of centers of nucleation of the dry phase prevents the transition up to 47
°C. One has to note that in some DSC scans we observed nonreproducible peaks at other temperatures, for example, at Figure 7. Water activity at 25, 40, and 60°C in the concentration
region of the phase transition from cubic (lower water contents) to hexagonal (higher water contents) phase.
Figure 8. DDAO-water phase diagram. Dry denotes anhydrous
surfactant, MH stands for monohydrate, Lam, Cub, and Hex stand for the lamellar, cubic, and hexagonal liquid crystalline phases, respectively, and Iso denotes isotropic solution. Circles denote sorption calorimetric data, and squares denote DSC data. The phase boundary between the hexagonal phase and the isotropic solution is taken from ref 23. The phase transitions at temperatures higher than 100°C can be influenced by chemical degradation of DDAO.
34°C. This can indicate an existence of some other, probably metastable, solid-state forms in this system.
The phase boundary between the cubic and the hexagonal phase was determined by both sorption calorimetry and DSC; the results obtained by the two methods are in a good agreement. The transition from the lamellar to the cubic phase observed by sorption calorimetry was slightly shifted to higher water contents, because the formation of the cubic phase is kinetically hindered. The same effect was observed during hydration of β-octyl-glucoside.7Therefore, the phase boundaries between the lamellar and the cubic phases in the phase diagram (Figure 8) were drawn using DSC data. Still, the DSC and the sorption calorimetric data show the same slope of the phase boundary (the meaning of the slopes of the phase boundaries was dis-cussed in the previous section). The phase boundary between the hexagonal and the isotropic micellar phase was not detected in the calorimetric measurements and was taken from ref 23.
4. Conclusions
We have performed a sorption calorimetric and DSC study of the hydration of the dimethyldodecylamine-N-oxide system. The main results are the following:
• Hydration of the lamellar, cubic, and the hexagonal liquid crystalline phases in this system is driven by entropy (Swm> 0). • Hydration of the lamellar liquid crystalline phase at 25°C is also driven by enthalpy (Hwm< 0), while for the other two phases Hwmis positive.
• The reason for the exothermic heat effect of the hydration of the lamellar phase is the strong interactions between the surfactants’ headgroups and water molecules.
• The hydration-induced phase transitions between the liquid crystalline phases in DDAO-water system are driven by enthalpy: H1f2< 0, S1f2< 0.
• The formation of a lamellar liquid crystalline phase from the solid phases is entropically driven, while the formation of the monohydrate from the dry surfactant is driven by enthalpy. • The enthalpy and entropy effects of the transition from the hexagonal phase to the liquid micellar phase are close to zero.
• The analysis of the phase diagram determined in the present study based on the van der Waals differential equation confirms the calorimetric data on the driving forces of the phase transitions.
Supporting Information Available: The results of the
sorption and the desorption experiments at all studied temper-atures and selected DSC results. This material is available free of charge via the Internet at http://pubs.acs.org.
References and Notes
(1) Kocherbitov, V. J. Phys. Chem. B 2005, 109, 6430.
(2) Israelachvili, J. N.; Wennerstrom, H. J. Phys. Chem. 1992, 96, 520. (3) Israelachvili, J. N.; Wennerstrom, H. Langmuir 1990, 6, 873. (4) Israelachvili, J.; Wennerstrom, H. Nature 1996, 379, 219. (5) Leikin, S.; Parsegian, V. A.; Rau, D. C.; Rand, R. P. Annu. ReV.
Phys. Chem. 1993, 44, 369.
(6) Parsegian, V. A.; Fuller, N.; Rand, R. P. Proc. Natl. Acad. Sci.
U.S.A. 1979, 76, 2750.
(7) Kocherbitov, V.; So¨derman, O.; Wadso¨, L. J. Phys. Chem. B 2002,
106, 2910.
(8) Kocherbitov, V.; So¨derman, O. Phys. Chem. Chem. Phys. 2003, 5, 5262.
(9) Markova, N.; Sparr, E.; Wadso¨, L.; Wennerstro¨m, H. J. Phys. Chem.
B 2000, 104, 8053.
(10) Mol, L.; Bergenstahl, B.; Claesson, P. M. Langmuir 1993, 9, 2926. (11) Wadso¨, L.; Markova, N. ReV. Sci. Instrum. 2002, 73, 2743. (12) Wadso¨, I.; Wadso¨, L. Thermochim. Acta 1996, 271, 179. (13) Kocherbitov, V.; Wadso¨, L. Thermochim. Acta 2004, 411, 31. (14) Kocherbitov, V. Thermochim. Acta 2004, 414, 43.
(15) Kocherbitov, V. Thermochim. Acta 2004, 421, 105.
(16) Sparrman, T.; Westlund, P. O. Phys. Chem. Chem. Phys. 2003, 5, 2114.
(17) Lutton, E. S. J. Am. Oil Chem. Soc. 1966, 43, 28.
(18) Kocherbitov, V.; Arnebrant, T.; Soderman, O. J. Phys. Chem. B
2004, 108, 19036.
(19) Kocherbitov, V.; So¨derman, O. Langmuir 2004, 20, 3056. (20) Sparrman, T.; Westlund, P. O. J. Phys. Chem. B 2001, 105, 12524. (21) Waals, J. D. v. d.; Kohnstamm, P. Lehrbuch der Thermostatik: das
heisst des thermischen Gleichgewichtes materieller Systeme; Johann
Am-brosius Barth: Leipzig, Germany, 1927.
(22) Fukada, K.; Kawasaki, M.; Kato, T.; Maeda, H. Langmuir 2000,
16, 2495.
(23) Laughlin, R. G. The Aqueous phase behaVior of surfactants; Academic Press: London, 1996.
(24) Cope, A. C.; Foster, T. T.; Towle, P. H. J. Am. Chem. Soc. 1949,