© 2017 E.W. Publications
Vulnerability of groundwater to pollution using three different models in
Halabja Saidsadiq basin, Iraq
T.O. Abdullah1, S.S. Ali2, N.A. Al-Ansari3* and S. Knutsson3
1 Department of Geology, University of Sulaimani, Kurdistan Region, NE. Iraq and Department of Civil, Environmental and Natural Resources and Engineering, Division of Mining and Geotechnical Engineering, Lulea University of Technology, Sweden 2 University of Sulaimani, Kurdistan Region, NE Iraq
3 Department of Civil, Environmental and Natural Resources and Engineering, Division of Mining and Geotechnical Engineering, Lulea University of Technology, Sweden
* e-mail: nadhir.alansari@ltu.se
Abstract: Halabja Saidsadiq Basin (HSB) is one of a major basin of Iraq in terms of groundwater reservoirs. Intensive agricultural practices and economic revolution are widespread and located close to groundwater wells, which pose imminent threats to these resources. Therefore, the most effective and realistic solution is to prevent the contamination of groundwater through. The present study targets the computation of the vulnerability of groundwater reservoirs of the study area. Three methods have been examined, namely DRASTIC, VLDA and COP to model a map of groundwater vulnerability for contamination. The standard DRASTIC vulnerability maps classified the basin of four vulnerability index zones: very low (34%), low (13%), moderate (48%) and high (5%). The VLDA model also classified the area into four categories as well: low (2%), moderate (44%), high (53%) and very high (1%). Four vulnerability classes were recognized based on COP model including very low, low, moderate and high vulnerability classes with coverage areas of (1%, 37%, 2% and 60%) respectively. After constructing every vulnerability map, it required to be confirmed in order to estimate the validity of the theoretical sympathetic of current hydrogeological conditions. In this study, nitrate concentration analysis was selected as a contamination indicator to validate the result. Considerable variations in nitrate concentration on dry to wet seasons had been renowned. Consequently, it points toward that groundwater in the HSB are capable to receive the contaminant due to suitability of overlies strata in terms of geological and hydrogeological conditions. Based on this confirmation, the result exemplifies that the degree and distribution of vulnerability classes acquired using VLDA model is more sensible.
Key words: Vulnerability, DRASTIC, VLDA, COP, Nitrate concentration, Halabja Saidsadiq Basin (HSB)
1.INTRODUCTION
The Halabja and Saidsadiq Basin (HSB) is one of the most important basins in terms of water groundwater aquifers. The concentration of economic, agricultural and social activities within the basin makes it of great importance to the region. The improvement in the economy, its development and comprehensive agricultural activities are extensive and are located near groundwater wells, posing imminent threats to these resources. From the perspective of these developments, there is an expansion of human quantities that make a line to live in this basin and the surrounding areas. This is forcing increasing attention to water, which has placed significant weight on water resources. Therefore, groundwater pollution is of particular concern as groundwater resources are the main source of water for drinking, agriculture, irrigation and industrial activities.
Groundwater vulnerability is a measure of how easy or how hard it is for pollution at the land surface to reach a productive aquifer. The vulnerability studies can provide valuable information about stakeholder working on preventing further deterioration of the environment (Mendoza and Barmen, 2006). To simplify the identification of the groundwater state and to resist the pollutants in the reservoirs, several methods were recommended such as DRASTIC, VLDA, COP, GOD, SINTACS, etc. These different methods are offered under the form of numerical excerpt systems based on the negotiation of the different factors affecting the hydrogeological system (Attoui and Bousnoubra, 2012).
In HSB, different vulnerability models have been applied previously; while it is very important to confirm the calculated vulnerability model reflecting the real vulnerability system in the region. Therefore, the primary objective of the present study is to compare the vulnerability map of three different models, DRASTIC, VLDA and COP, to choose a more reasonable model to be applied in the area to protect groundwater from pollution.
2. STUDY AREA
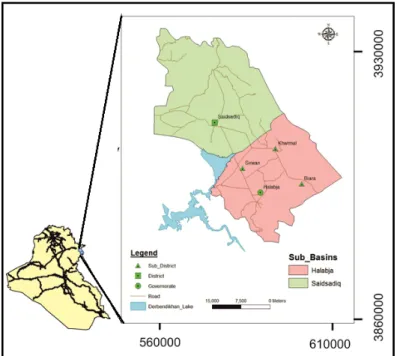
The study basin is located in the northeastern part of Iraq (Figure 1), geographically it is located between the latitude 35º 00΄ 00΄΄ and 35° 36΄ 00΄΄ N and the longitude 45º 36΄ 00΄΄ and 46º 12΄ 00΄΄ E. The entire study area is about 1278 square kilometers and its population of about 190,727 in early 2015. Ali (2007) divided this basin of two sub-basins including Halabja- Khurmal and Said Sadiq sub-basins. Nearly 57% of the studied area is an arable area due to its suitability for agriculture (Statistical Dtectorate, 2014).
Figure 1. Location map of study basin.
2.1 Geology and hydrogeological setting
Geologically, the studied area is located within Western Zagros Fold-Thrust Belt. Structurally, it is located within the High Folded zone, imbricated, and thrusted zone. Different geological formations were exposed to the basin, these formation consists of limestone, dolomitic limestone and conglomerate which have an effective role in the vulnerability system in the basin. Alluvial (Quaternary) deposits are the most important unit in the area in terms of hydrogeological characteristics and water supply. The thickness of these deposits as observed by (Abdullah et al., 2015a) of about nearly 300 m.
Hydrogeologically, different groundwater aquifers exist in the area based on its geological origin, Table 1. The mountain series, which surround the basin of the northeast and southeast, are characterized by high depth of groundwater, while toward the center and the southeastern part, the groundwater level has a relatively lower depth. A groundwater movement is usually from high elevated areas at the north and northeast and south and southeast towards southwest or generally toward the reservoir of Derbandikhan Dam.
Table 1. Type of aquifers in the study basin.
Aquifer type Geological formation Thickness (m) References
Intergranular Quaternary deposits more than 300 Abdullah, 2015a Fissured Balambo,Kometan 250 Ali, 2007
Fissured-Karstic Jurassic formation Avroman From 80 to 200 200 Jassim and Goff, 2006 Non-Aquifer (Aquitard) Qulqula Shiranish Tanjero more than 500 225 2000
Jassim and Goff, 2006
3. METHODOLOGY
To study groundwater vulnerability in this basin, three different models were applied with the aid of GIS technique. The first applied model is DRASTIC, which is consist of seven physical parameters .The most important parameters that control groundwater contamination comprise to be the depth to water (D), Net recharge (R), Aquifer media (A), Soil media (S), Topography (T), Impact of vadose zone media (I), and Hydraulic conductivity (C).These parameters are weighted from one to five based on their relative significance of contributing to the contamination potential. Each parameter characterized by different rating and weighting to value. The achieving index is a qualified measure of vulnerability to contamination; areas with a higher index value are more vulnerable than those with a lower index. The standard DRASTIC index (DI(w-r)) calculated is based on the following equation (Aller et al., 1987):
DI =DWDr+ RWRr+ AWAr+ SWSr+ TWTr+ IWIr+ CWCr (1)
where DI is the DRASTIC Index, (D, R, A, S, T, I and C) are the seven parameters, w is the weight parameter and r is the rate of the parameter as recommended by (Aller et al., 1987).
The second applied model is VLDA, principally it reflect lithology of vadose zone (V), pattern of land use (L), groundwater depth (D), and aquifer characteristics (A), (Zhou et al., 2012). In addition, consistent weight can be assigned to each of the four indexes depending on its impact on groundwater vulnerability.
The vulnerability comprehensive assessment index (DI) is the sum of the above-mentioned weighted four indexes, as computed conferring to the following formula, (Zhou et al., 2012):
DI= !!!!(WijRij) (2)
where DI is the comprehensive assessment index, Wij is the weight of the jth comprehensive assessment index of the ith sub-system, Rij is the value of the jth assessment index of the ith subsystem; 4 is the quantity of indexes.
The slighter the DI signifier to the lower vulnerability of the groundwater system and the better the stability will be. For evaluating the groundwater vulnerability, the new corresponding weights in HSB were proposed using sensitivity analysis method (Abdullah, 2015b). According to the result of sensitivity analysis, the proposed weights used for VLDA model measured as 8.2, 4.8, 5.2 and 4.8, and after normalization, the weight is 0.357, 0.209, 0.226 and 0.209, respectively, (Abdullah 2016a).
The third applied model is COP; its abbreviation comes from the three initials of factors namely flow Concentration (C), Overlying layers (O) and Precipitation (P) (Vias et al., 2006). The hypothetical basis of this strategy, as indicated by the European Approach (Daly et al., 2002) and (Goldscheider and Popescu, 2004), it is to evaluate the ordinary protection for groundwater (O variable) controled by the properties of overlying soils and the unsaturated zone, and also to measure how this assurance can be adjusted by diffuse, infiltration (C factor) and the climatic conditions (P Factor – precipitation). The COP-Index map was computed from equation 3 (Abdullah et al., 2016b; Vias et al., 2006):
COP Index Map= C·O·P (3)
4. RESULT AND CONCLUSIONS
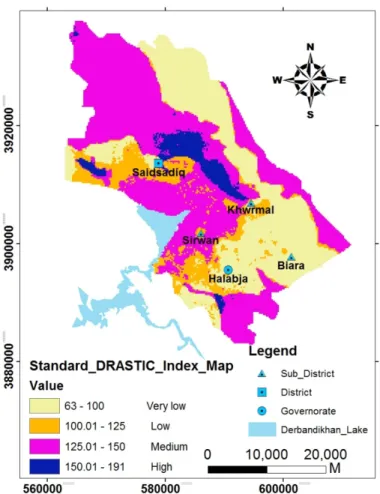
After the weighted scores were attained for all parameters in each model, the GIS technique was used to combine all layers. The Standard DRASTIC models reveal four zones of vulnerability index to comprise very low, low, moderate and high vulnerability index (Figure 2). The moderate and very low vulnerability zones which covering an area of 48% and 34% of the whole studied area respectively. The moderate vulnerability zone occupies two different areas; the first zone is the area of mountains surrounding the studied basin comprises the fissure and karstic aquifer. While the second area comprise the Quaternary deposits surrounding the area of Derbandikhan Lake in the southwest of the basin. Furthermore, the zone with low vulnerability comes in the third sequence and occupies 13% of the overall surface of the basin. The zone with high vulnerability indexes cover only 5% of the total area and located in the centre of the basin, this area is characterized by the area of high water table level and of fractured limestone type of an aquifer.
Figure 2. DRASTIC Vulnerability Index Map of HSB
The vulnerability outcome based on VLDA model, reveals that a total of four ranges of vulnerability indexes had been distinguished ranging from low to very high, with vulnerability indexes 2.133-4 , >4-6, >6-8 and > 8 (Figure 3). The area of low and very high vulnerability zone of 2% and 1% of whole study area respectively. The High vulnerability classes occupied most of the mountains area that surrounding the basin and the central part of HSB. This vulnerability zone covered an area of 53% of whole area. Finally, medium vulnerability zones to cover an area of 44% of all studied area and positioned southeast and northwest. Both high and moderate vulnerability class that occupied most of the studied basins refer to the exhaustive human activities, good water yield property and lithological composition of an aquifers.
Figure 3. VLDA Vulnerability Index Map of HSB
Four classes of vulnerability ranging from very low to high are branded depending on the COP model (Figure 4). High vulnerability zones which cover an area of 60% of the whole HSB, geologically includes the area of a fissure and slight karstic carbonate rocks. While, low vulnerability class comes in the second order and occupy 37% of the whole area, this area mostly characterized by alluvial deposits. The zone with moderate and very low vulnerability classes cover only 2% and 1% of the total area respectively.
4.1 Validation of the result
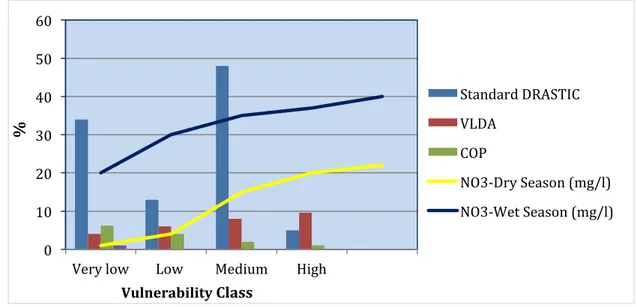
The significant dissimilarity has been illustrious from all applied models. So validation of vulnerability maps for these three models became obligatory, therefore nitrate concentration analysis has been selected. Nitrate as a pollution indicator can be supportive to distinguish the evolution and changes of groundwater quality. In the particular study case, the nitrate differences between two following seasons (dry and wet) were analyzed from (30) watering wells. The result illustrates considerable variations in nitrate concentration on dry to wet seasons, Figure 5. Based on this validation, it can be confirmed that HSB is capable of receipt the contaminant due to suitability in geological and hydrogeological conditions. Based on this verification, the degree and distribution of level of vulnerability acquired using VLDA model are more sensible than that attained from the standard DRASTIC and COP models. With increasing nitrate concentration the vulnerability rates increased too, because land to use patterns is considered being one of the most effective factors of VLDA model and this parameter dose not included in DRASTIC and COP models.
Figure 5. Comparison of all applied models with nitrate concentration.
5. CONCLUSION
Three different methods particularly standard DRASTIC, VLDA and COP have been applied to assess the potential vulnerability of HSB to groundwater contamination. The values of the standard DRASTIC vulnerability indexes ranged between (63 and 191), the VLDA indexes with values ranging from (2-9), the values of the COP indexes ranged between (1-6). The higher index value for both DRASTIC and VLDA models means higher vulnerability category, while the lower index value of COP model means higher vulnerability class.
Table 2. Result of index ratio for all applied models.
Vulnerability class DRASTIC rate % VLDA rate % COP rate %
Very low 34 0 1
Low 13 2 37
Medium 48 44 2
High 5 53 60
The vulnerability classes are elucidated in Table 2, all models to clarify four vulnerability classes. DRASTIC and COP models comprises (very low to high), while VLDA model embraces
0 10 20 30 40 50 60
Very low Low Medium High
Standard DRASTIC VLDA COP NO3-Dry Season (mg/l) NO3-Wet Season (mg/l) Vulnerability Class %
(low to very high).The significant dissimilarity has been illustrious from all applied models. Therefore, validation of achieved vulnerability maps becomes compulsory. Nitrate as a pollution indicator from agricultural processes can be supportive to distinguish the evolution and changes of groundwater quality. The result illustrates considerable variations in nitrate concentration on dry to wet seasons. So it can be concluded that groundwater in HSB is capable of receiving the contaminant. Based on this verification, Figure 5 demonstrates that the degree and distribution of level of vulnerability acquired using the VLDA method is more sensible than that attained from both standard DRASTIC and COP methods.
REFERENCES
Aller L., Bennett T., Lehr J.H., Petty R.H., Hackett G., 1987. DRASTIC: a standardized system for evaluating groundwater pollution potential using hydrogeologic setting. USEPA report 600/2-87/035, Robert S. Kerr Environmental Research Laboratory, Ada, Oklahoma 74820, 252p.
Ali S. S., 2007. Geology and hydrogeology of Sharazoor - Piramagroon basin in Sulaimani area, northeastern Iraq. Unpublished PhD thesis, Faculty of Mining and Geology, University of Belgrade, Serbia. 317p.
Attoui B, Kherci N, Bousnoubra H., 2012. State of vulnerability to pollution of the big reservoirs of groundwater in the region of Annaba-Bouteldja (NE Algeria). Geographia Technica. 2:1-13.
Abdullah T.O., Ali S.S., Al-Ansari N.A., Knutsson S., 2015a. Effect of agricultural activities on groundwater vulnerability: Case study of Halabja Saidsadiq Basin, Iraq. Journal of Environmental Hydrology 23(10): 1-20
Abdullah, T.O., Ali, S.S., Al-Ansari, N.A. and Knutsson, S., 2015b. Groundwater Vulnerability Mapping using Lineament Density on Standard DRASTIC Model: Case Study in Halabja Saidsadiq Basin, Kurdistan Region, Iraq. Engineering 7: 644-667. Abdullah, T.O., Ali, S.S., Al-Ansari, N.A. and Knutsson, S., 2016a. Assessing the vulnerability of groundwater to pollution using
DRASTIC and VLDA models in Halabja Saidsadiq Basin, NE - Iraq. Journal of Civil Engineering and Architecture 10: 1144-1159.
Abdullah, T.O., Ali, S.S., Al-Ansari, N.A. and Knutsson, S., 2016b. Groundwater Vulnerability Using DRASTIC and COP Models: Case Study of Halabja Saidsadiq Basin, Iraq. Engineering, 8: 741-760.
Daly D, Dassargues A, Drew D, Dunne S, Goldscheider N, Neale S, Popescu C, Zwhalen F, 2002. Main concepts of the “European Approach” for (karst) groundwater vulnerability assessment and mapping. Hydrogeol J 10(2): 340–345.
Goldscheider N., Popescu C., 2004. The European Approach. In: Zwahlen F. (ed) Vulnerability and risk mapping for the protection of carbonate (karst) aquifers. European Commission, Brussels, pp 17–21.
Huang T, Pang Z, Edmunds W., 2012. Soil profile evolution following land-use change: Implications for groundwater quantity and quality. Hydrol. Process 27(8):1238-1252.
Jassim S.Z. and Guff J.C., 2006. Geology of Iraq. Jassim (Eds) D. G. Geo Survey. Min. Invest. Publication. 340p.
Mendoza JA, and Barmen G., 2006. Assessment of groundwater vulnerability in the Rio Artiguas Basin, Nicaragua. Environmental Geology 50: 569_580.
Statistical Directorate in Sulaimaniyah, 2014. Archive Department.
Vias J.M., Andreo B., Perles M.J., Carrasco I., Vadillo P., Jimenez P., 2006. Proposed method for groundwater vulnerability mapping in carbonate (karstic) aquifers: the COP method. Application in two pilot sites in Southern Spain. Hydrogeology Journal 14: 912–925.
Zhou J., Li Q., Guo Y., Guo X. , Li X., Zhoa Y., Jia R., 2012. VLDA model and its application in assessing phreatic groundwater vulnerability: a case study of phreatic groundwater in the plain area of Yanji County, Xinjiang, China. Environmental Earth Science Journal 67: 1789-1799.