a
Email address. anita.gidlof@amm.gu.se b
Email address. evy.ohrstrom@amm.gu.se
Edinburgh, Scotland
EURONOISE 2009
October 26-28
Good sound environment in green areas modify road-traffic
noise annoyance at home
Anita Gidlöf-Gunnarssona Evy Öhrströmb
The Sahlgrenska Academy at the University of Gothenburg Department of Occupational and Environmental Medicine Box 414, SE 405 30 Gothenburg, Sweden
Mikael Ögren
Swedish National Road and Transport Research Institute, VTI, Box 8077, SE 40278Gothenburg, Sweden
Tomas Jerson
Acoustic Department, WSP Environmental, Box 13033, SE-402 51 Gothenburg, Sweden
ABSTRACT
There has been a growing recognition among noise researchers that natural elements and natural areas of the built environment have potentials to reduce annoyance due to traffic noise. It has been suggested that presence of vegetation (e.g., trees, bushes, grass, flowers) contributes to an aesthetically pleasing environment, which influence overall residential satisfaction and people‟s perception of the noise. Other expected benefits of natural elements/areas are prevention or modification of adverse effects of work-, personal-, or environmental stress (e.g., noise) through restoration processes. Within the large TVANE-project, the present study examined the effect of green areas (park or similar at walking distance) on noise responses in residential settings (n=468) exposed to road traffic noise (LAeq,24h 45 to 65 dB). A binary multiple logistic regression analysis, with sound exposure as the
prime variable assumed to predict general noise annoyance at home, indicated that presence of green areas, a closer distance to it from the subject‟s home, and perceived green-area characteristics (good sound environment, high attractiveness and potentials for recreational activities) significantly lowered noise annoyance. The results suggest that the exposure-response relationship between noise and annoyance is influenced by access to nearby green areas provided that they have good environmental quality, particularly regarding the perceived sound environment.
1. INTRODUCTION
The protection of outdoor areas that are “quiet”, or as suggested recently – having “high acoustic quality”1 or health-promoting soundscapes2-4 – is an issue of growing interest as well as
a requirement stated in the EC-directive on environmental noise (END). These “quiet” areas have been broadly divided into three domains of the outdoor environment: urban domains (e.g., parks, gardens, courtyards, squares), non-urban or rural domains (e.g., countryside, forests, coastlines), and natural area domains (e.g., national parks, wilderness areas)1. Within noise research, the focus has mainly been to identify and describe the characteristics of the “quiet” areas with respect to people‟s evaluation, preference and appreciation of sounds heard in the contexts5-10, to develop tools10-13 and measuring strategies14-15 and to suggest guidelines for potentially disturbing sound sources, such as traffic noise16. Recently, also various health
effects (psychological, physiological, behavioral) of “quiet” areas have come into focus through the research on human health benefits of contact with natural environments17-20. Studies have shown that contact with nature is of great importance for human health and well-being17-23. Exposure to a natural environment foster psychological restoration by recovery from cognitive mental fatigue, reduce stress and stress symptoms, increase positive feelings (e.g., pleasure) and decrease negative feelings (e.g., anxiety, anger), promote human interactions, and various physical activities (e.g., walking, jogging, cycling, hiking etc.).
For future noise policy and action plans it is important to gain knowledge of how “quiet” natural areas can be beneficial for human health and well-being. However, few field studies have investigated this issue. Results from a recent study shows that perceived availability to nearby green areas was associated with lower noise annoyance and experience of stress-related psychosocial symptoms24. An important factor was the distance between the home and the nearest green area: closer green areas were associated with fewer noise annoyed residents24. Nevertheless, in this study no data was specifically collected on how the sound environment of the green areas was perceived. Thus, green areas in which sounds from traffic dominate the sound environment may have less positive impact on health and well-being.
The present study formed part of the research project “TVANE” (Train Vibration and Noise Effects; 2006-2010), which investigates in a series of empirical field studies and laboratory experiments how human responses (health and well-being) are affected by (a) combined exposure to railway noise and vibrations, (b) high intensive railway traffic, and (c) road traffic- and railway noise per se. From the latter investigation, a restricted dataset is utilized for the present study and the main objective is to explore the effect of green areas (park or similar at walking distance) and perceived green area characteristics on noise annoyance in residential settings exposed to road traffic noise.
2. METHOD
A. Study design
Residential areas in two smaller Swedish cities (Borås and Kungälv) exposed to road traffic noise were surveyed using a socio-acoustic questionnaire. The selection of these study areas were based on a number of criteria set for the larger study, which compares effects of railway noise with road traffic noise. For example, the selected road traffic noise-exposed residential areas should be comparable with the railway noise-exposed residential areas regarding the following: being located in the same region (the region of Västra-Götaland), having approximately the same range of sound levels, and having approximately the same distribution of apartment houses and villas. Furthermore, the road traffic noise-exposed areas should not be exposed to railway noise and be situated close to a major road/highway (Kungälv is close to the highway E6 and Borås is close to the major road R40).
B. Sound exposure
Sound levels from road traffic (e.g., LAeq,24h = the equivalent A-weighted sound pressure level
integrated during 24h) were calculated by the Nordic Prediction Method for Road traffic Noise25 and based on traffic input data (traffic flows, speeds, vehicle type, various measurement periods) and geometrical data of the field site. For Kungälv, the calculations were made with the program Cadna (version 3.7) and for Borås with the program SoundPlan (version 6.4) at individual façade positions (2 and 4 meters above ground at the most exposed facade) of each residential building that was included in the sample of homes within the project. The calculations refer to free field values, i.e., without the impact of the "own" building facade, but with the impact of reflections in other nearby objects such as adjacent buildings, screens etc. Control measurements were done in both Borås and Kungälv.
C. Study population
The dataset utilized in the present study is based on questionnaire data obtained from 1 188 residents (48 % response rate), (Table 1). One individual between 18 and 75 years of age were originally selected. The restricted dataset of 468 residents were all exposed to road-traffic noise exposures between LAeq,24h= 45 to 65 dB at the most exposed facade of the dwelling. The
remaining residents with lower and higher sound levels were excluded from further analyses. Two sound level categories were formed: 45-55 dB (n=297) and 56-65 dB (n=171).
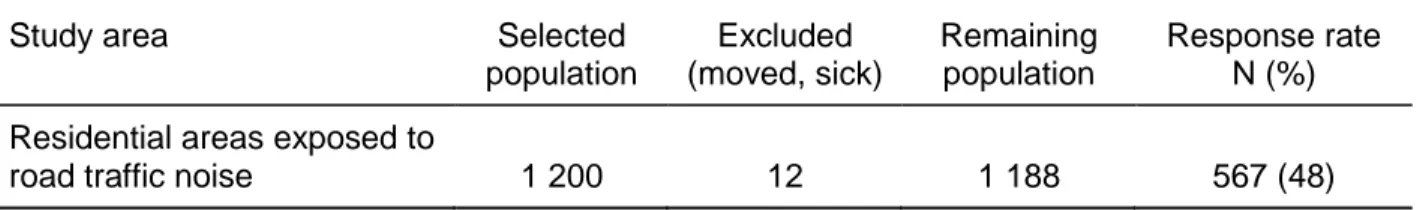
Table 1. Study population and response rate.
Study area Selected
population Excluded (moved, sick) Remaining population Response rate N (%) Residential areas exposed to
road traffic noise 1 200 12 1 188 567 (48)
D. Questionnaire
Annoyance and other health effects were evaluated using a questionnaire. The format is based on questionnaires previously used in larger epidemiological studies of noise annoyance in Sweden3. The questionnaire was sent to selected persons in Kungälv and Borås (April 5, 2007) together with an introductory letter. The letter presented the survey as a study on environment and human health and well-being. It was also explained that the questionnaire focused on the homes and the environment in the vicinity of the dwelling and the respondent‟s own experience of the environment, especially sound and noise. The letter stated also that the results from the study will be an important basis for the design of housing and living environments. Two reminder letters were sent out with 10 day intervals to those who not responded to the questionnaire. The first reminder consisted only of a letter while the other consisted of the reminder letter and a new questionnaire.
The questionnaire contains a total of 50 questions, excluding sub-questions, and is divided into five parts related to: (A) housing and living environment; (B-C) annoyance and disturbances due to noise exposures from road traffic and railway; (D) general background; and (E) respondent‟s own comments. The present paper only uses the following data from the questionnaire:
(A) Access to green areas was assessed with the following question: “Are there green areas (park or similar) within walking distance of your home or in the neighborhood?” Four response categories were used: “Yes, within 400 m (within 5 minutes walking distance)”, “Yes, within 500-800 m”, Yes, but more than 500-800 m”, and “No”. Those who marked any of the “Yes”-categories were requested to answer the next coming question in the questionnaire (see below).
Perceived green area characteristics were assessed with eight items (positively and negatively
stated). The exact wording was “How well agrees the following statements with the green area you visit most?” The statements were (listed in the following order): “I can hear sounds from nature (e.g., birds, the wind)”; “There are benches to sit on”; “I hear mostly sounds from traffic (e.g., road, train)”; “Children can play there”; “Sounds from traffic annoys me (e.g., road, train)”; “The natural environment is attractive to stay in”; “The sound environment is relaxing”; and “The
green area is sufficiently large for my needs”. Responses were given on a 3-point scale (1=“Yes, completely agree”, 2=“Partly agree”, and 3=“No, completely disagree”). Positively stated items were reverse recoded.
(B) Noise annoyance was assessed with an internationally adopted and standardized annoyance scale26.The scale assessed road traffic noise annoyance at home (last 12 months) on a verbal 5-point category scale (“not at all”=1, “slightly”=2, “moderately”=3, “very”=4, and “extremely”=5). The exact wording was “Thinking about the last 12 months, when you are at home, how much does noise from road traffic annoy you?”.
2. RESULTS
A. Person factors
The mean age of the respondents was 48.6 (range=19-75, SD=16.5), 42 % were women, and 56 % were married or de facto co-habiting. A majority of the respondents (74 %) were employed, had their own company, or were studying, and the rest had different status such as retirement (early retirement, sickness- or old-age pensioner), unemployed, or were on sick- or parental leave. About one fourth had a high level of education (≥ 3 years at university).
B. Access to green area and green area characteristics
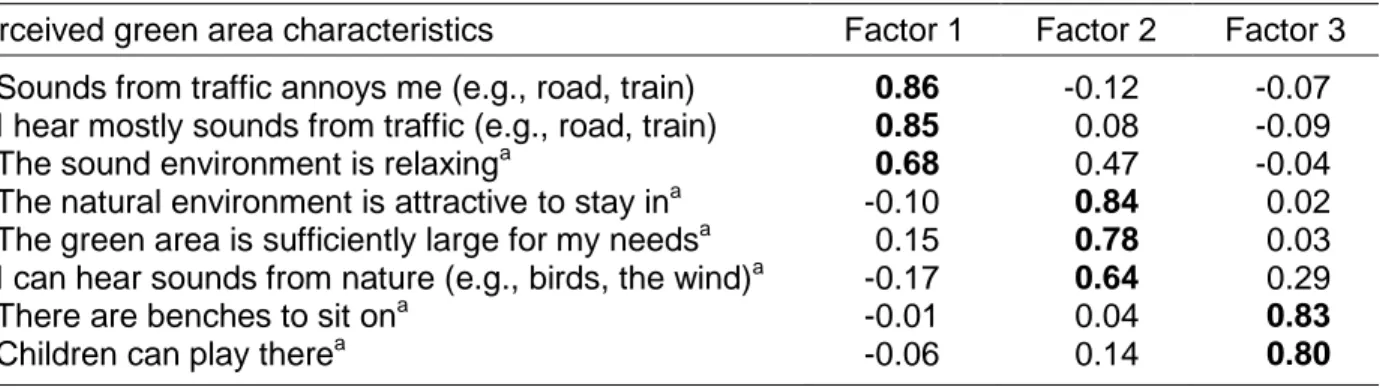
A majority (67 %) had access to green areas within walking distance of 400 m from their home, 13 % between 500-800 m, 16 % longer than 800 m, and 4 % had no access to green areas within walking distance. To determine the underlying dimensions of the green area characteristics, a principal component analysis of the eight items was conducted. A varimax rotation was applied and three factors were extracted with an eigenvalue above 1 explaining 68 % of the variance (25, 25 and 18 % for factor 1, 2, and 3, respectively). Table 2 shows factor loadings for each item. Factor 1 obviously represents the “perceived sound environment” of the green area. The items referring to “perceived attractiveness” and size are found in Factor 2, but items relating to the sound environment are also loading in this factor (“I can hear sounds from nature” and “The sound environment is relaxing”), the latter loading high in Factor 1. Factor 3 represents “perceived opportunity for various activities” in the green area. Factor scores for each respondent on each factor were computed and saved as variables. These factor scores were used as independent variables in a logistic regression analysis (higher factor scores indicate a more positive perception of the characteristic).
Table 2: Varimax rotated principal component solution for green area characteristics.
Perceived green area characteristics Factor 1 Factor 2 Factor 3
1. Sounds from traffic annoys me (e.g., road, train) 0.86 -0.12 -0.07
2. I hear mostly sounds from traffic (e.g., road, train) 0.85 0.08 -0.09
3. The sound environment is relaxinga 0.68 0.47 -0.04
4. The natural environment is attractive to stay ina -0.10 0.84 0.02
5. The green area is sufficiently large for my needsa 0.15 0.78 0.03
6. I can hear sounds from nature (e.g., birds, the wind)a -0.17 0.64 0.29
7. There are benches to sit ona -0.01 0.04 0.83
8. Children can play therea -0.06 0.14 0.80
a
C. Relationship between road traffic noise, annoyance and green-area variables
The influence of distance to green areas and green area characteristics on the relationship between noise levels and road traffic noise annoyance was explored by binary multiple logistic regression analysis (n=407). The model contained exposure to road traffic noise as a continuous variable (LAeq,24h), noise annoyance (two categories 0=“not at all”/”slightly annoyed”;
1=”moderately”/”very”/”extremely annoyed”), distance from the home to green areas (two categories; 0=>400 m, 1=within 400 m), and factor scores (continuous variables) representing three perceived green area characteristics (Factor 1 “Perceived sound environment”; Factor 2 “Perceived attractiveness”; Factor 3 “Perceived opportunities for activities”). Respondents who reported having no green areas within walking distance from their home were excluded from the analysis because they were requested to not answer the questions on green area characteristics (n=19).
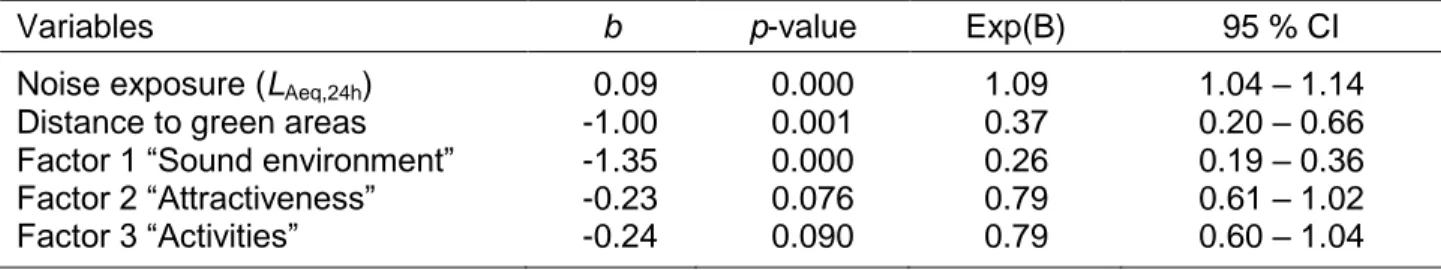
Table 3: Results of multiple logistic regression analysis with 95 % confidence intervals predicting noise
annoyance from noise exposure and green area variables.
Variables b p-value Exp(B) 95 % CI
Noise exposure (LAeq,24h) 0.09 0.000 1.09 1.04 – 1.14
Distance to green areas -1.00 0.001 0.37 0.20 – 0.66
Factor 1 “Sound environment” -1.35 0.000 0.26 0.19 – 0.36
Factor 2 “Attractiveness” -0.23 0.076 0.79 0.61 – 1.02
Factor 3 “Activities” -0.24 0.090 0.79 0.60 – 1.04
The results indicate that the exposure-response relationship between road traffic noise and annoyance at home was modified by the green-area variables included in the model (Table 3). The percentage of noise annoyed residents were significantly lower among those who had green areas within a walking distance of <400 m (OR 0.37; 95 % CI 0.20 to 0.66) and those who perceived the “sound environment” of the green areas in a more positive way (OR 0.26; 95 % CI 0.19 to 0.36). The factors perceived “attractiveness” (OR 0.79; 95 % CI 0.61 to 1.02) and “activities” (OR 0.79; 95 % CI 0.60 to 1.04) were also related with a lowered odds of falling into the annoyance group, but did not reach statistically significance (p<0.05). The odds ratios predicting annoyance were highest for the “sound environment” variable.
D. Access to a nearby green area with good sound environment decreases noise
annoyance
To explore more in detail and to illustrate how the “perceived sound environment” of the green area influences noise annoyance at home, we formed two groups based on the median value of the factor score for the “perceived sound environment” (Md=-0.11, range -2.14 to 1.99). Residents with a factor score <-0.11 were classified as having access to a green area with “bad” sound environment (n=203) and residents with a score ≥0.11 were classified as having access to a green area with “good” sound environment (n=204).
Figure 1: Percentage annoyed by road traffic noise at home in relation to perceived sound environment of the green area and sound levels (LAeq,24h).
Figure 1 shows that having access to a green area with a sound environment that is perceived as “good” significantly reduces noise annoyance at home in the two noise exposure categories (2-test, p<0.001). Thus, about four times less amount of the residents were annoyed in the 45-55 dB category (8 vs. 33 %) and about two and a half times less amount of the residents were annoyed in the 56-65 dB category (20 vs. 52 %) if they perceived the sound environment in the green area as “good”.
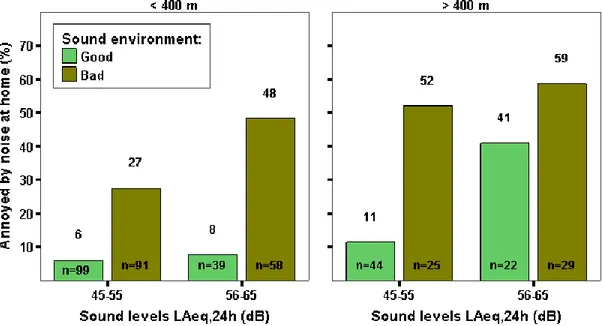
Figure 2: Percentage annoyed by road traffic noise at home in relation to perceived sound environment of the green area, sound levels (LAeq,24h), and distance to the green area
To examine and illustrate the influence of distance to the green area on annoyance, in addition to sound levels and “perceived sound environment”, the two-category distance variable (<400 m; >400 m) was included in the analysis. Figure 2 shows that, in comparison to having a shorter distance to green areas (<400 m, left panel), having a longer distance (right panel) is overall associated with a higher percentage of annoyed residents both among those who perceive the sound environment of the green area as “good” as well as “bad” in the two noise categories. Among the residents in the 55-65 dB category and who are perceiving a “good” sound environment, five times more are noise annoyed at home if green areas are at longer distance than 400 m (8 vs. 41 %). However, it is apparent that a nearby green area within 400 m that is noise polluted has a minor effect on noise annoyance (left panel, 48 % annoyed). Even at lower noise levels (45-55 dB), every fourth resident is annoyed among those in the “bad” sound environment group (left panel, 27 %). With a longer distance to green areas the amount of annoyed residents is almost doubled (right panel, 52 %).
4. CONCLUSIONS
The results in this study indicate that the exposure-response relationship between traffic noise and annoyance is significantly modified by access to green areas. In the logistic regression model, green area distance is negatively related with noise annoyance (odds below 1), indicating that residents having green areas within <400 m from the home is associated with smaller odds of falling within the annoyance group. This finding is consistent with previous results, which show an association between lower annoyance levels and closer proximity to green areas24. Three factors were extracted in the principal component analysis of items describing characteristics of the green areas: “perceived sound environment”, “perceived attractiveness”, and “perceived opportunities for activities”. The factors explained fairly equal amount of variance in the data (25, 25 and 18 %, respectively) and when included in the logistic regression model the odds have the expected signs indicating a negative correlation with noise annoyance. However, only the “perceived “sound environment” factor displayed a statistically significant correlation with noise annoyance. Thus, a better “perceived sound environment” of the green areas decrease the odds (OR 0.27) of falling within the annoyance group. The effect of the other two factors was weaker and they did not reach statistical significance (OR 0.79,
p=0.076 and 0.090 for “perceived attractiveness” and “perceived opportunities for activities”,
respectively). These factors may also be more linked to individual preferences or purposes for visiting the green areas.
The descriptive analyses illustrated the effect on annoyance of “perceived sound environment” and noise exposure when taken into account the distance to green areas. Although, the results overall indicate that long-term annoyance is less with shorter distance to green areas in both “perceived sound environment” groups the far best predictor of noise annoyance in the present study is how the sound environment of the green areas is perceived.
In traffic noise-polluted residential areas, access to natural and “quiet” environments in close proximity to the home may be vital for meeting human needs, e.g., to offer a nearby noise-free zone. When people are asked, common reasons for visiting natural environments are recreation and play, stress-recovery, to experience the silence and get away from noise and other disturbances, to observe and listen to the nature, social interaction, and to be physical active. Feelings of being relaxed and harmonious in relation to nature are expressed as well as possibilities to "recharge ones batteries”17-23. The results in the present study indicate that if a
green area is to serve as a moderator of the exposure-response relationship between noise and annoyance and be a restorative environment it need to have a perceived sound environment of “high acoustic quality”, i.e., a sound environment that is perceived as relaxing and is not dominated by sounds from road traffic noise.
The results in the present paper should be treated as preliminary. Further analyses will be done and we will also examine more thoroughly through aerial photographs the location of green areas in relation to the major roads and the residential areas.
ACKNOWLEDGMENTS
The study forms part of the Swedish research program TVANE (Train Vibration and Noise Effects) (year 2006-2010) funded by the Swedish Rail Administration.
REFERENCES
1. A.L. Brown, “Rethinking quiet areas as areas of high acoustic quality”, in Proceedings of Inter-Noise 2006, Honolulu, Hawaii, USA, 2006, paper no in06_055.
2. B. Berglund, T. Kihlman, W. Kropp, and E. Öhrström, Soundscape Support to Health. Chalmers, Göteborg, Sweden, MISTRA Final Report Phase 1, March 2004 (available on CD).
3. E. Öhrström, A. Skånberg, H. Svensson, and A. Gidlöf-Gunnarsson, Effects of road traffic noise and the benefit of access to quietness, Journal of Sound and Vibration 295, pp. 40-59, (2006). 4. Ljudlandskap för bättre hälsa. Resultat och slutsatser från ett multidisciplinärt forskningsprogram
[Soundscape Support to Health. Results and conclusions from a multidisciplinary research program], A. Gidlöf-Gunnarsson (ed.), B. Berglund, J. Forssén, T. Kihlman, W, Kropp, M.E. Nilsson and E. Öhrström, Göteborgs universitet, Göteborg 2008.
5. M.E. Nilsson and B. Berglund, Soundscape quality in suburban green areas and city parks, Acta Acustica United with Acustica 92, pp. 903-911, (2006).
6. B. De Coensel and D. Botteldooren, The quiet rural soundscape and how to characterize it, Acta Acustica United with Acustica 92, pp. 887-897, (2006).
7. G. Brambillaand L. Maffei, Responses to noise in urban parks and in rural quiet areas, Acta Acustica United with Acustica 92, pp. 881-886, (2006).
8. R. Pheasant, K. Horoshenkov, G. Watts, and B. Barrett, The acoustic and visual factors influencing the construction of tranquil space in urban and rural environments tranquil spaces-quiet places? Journal of the Acoustical Society of America 123, pp.1446-1457, (2008).
9. S.R. Payne, P. Devine-Wright, and K.N. Irvine, “People‟s perceptions and classifications of sounds heard in urban parks; semantics, affect, and restoration, in Proceedings of Inter-Noise 2007, Istanbul, Turkey, 2007, paper no in07_233.
10. B. Berglund and M.E. Nilsson, On a tool for measuring soundscape quality in urban residential areas. Acta Acustica United with Acustica 92, pp. 938-944, (2006).
11. D. Botteldooren and B. De Coensel, “Quality lables for the quiet rural soundscape”, in Proceedings of Inter-Noise 2006, Honolulu, Hawaii, USA, 2006, paper no in06_042.
12. A.L. Brown and A. Muhari, An approach to the acoustic design of outdoor space, Journal of Environmental Planning and Management 47, pp. 827-842, (2004).
13. G. Brambilla, L. Maffei, and G. Zambon, “Preserving natural quiet areas and urban parks”, in Proceedings of Inter-Noise 2006, Honolulu, Hawaii, USA, 2006, paper no in06_048.
14. M. Downing, “Characterizing ambient soundscapes and noise intrusions”, in Proceedings of Inter-Noise 2006, Honolulu, Hawaii, USA, 2006, paper no in06_115.
15. K.C. Lam, M.Y Keung, K.C. Chau, L.M. Marafa and P.K Chan, Characteristics of and human preference for the countryside soundscapes of Hong Kong, in Proceedings of Inter-Noise 2006, Honolulu, Hawaii, USA, 2006, paper no in06_292.
16. Ljudkvalitet i natur- och kulturmiljöer. Slutrapport – Utvärdering och utveckling av mått, mätetal och inventeringsmetod [Soundquality in natural- and cultural environments. Final Report – Evaluation and development of dimensions, metrics and inventory method, Naturvårdsverket, Report no 5440-6, Stockholm, 2005.
17. R. Kaplan, The role of nature in the urban context, in: I. Altman, J.F. Wohlwill (Eds.), Behavior and the Natural Environment, Plenum, New York, 1983, pp. 127-162.
18. R. Kaplan, and S. Kaplan, The Experience of Nature: A Psychological Perspective, Cambridge University Press, New York, 1989.
19. R.S. Ulrich, Aesthetic and affective response to natural environments, in I. Altman, J.F. Wohlwill (Eds.), Behavior and the Natural Environment, Plenum, New York, 1983, pp. 85-125.
20. T.A. Hartig, G.W. Evans, L.D. Jamner, D.S. Davis and T. Gärling, Tracking restoration in natural and urban field settings. Journal of Environmental Psychology 23, pp. 109-123, (2003).
21. R.H. Matsuoka and R. Kaplan, People needs in the urban landscape: Analysis of Landscape and Urban Planning contributions”, Landscape and Urban Planning 84, pp. 7-19, (2008).
22. C. Maller, M. Townsend, A. Pryor, P. Brown and L. St Leger, Healthy nature healthy people: „contact with nature‟ as an upstream health promotion intervention for populations, Health Promotion International 21, pp. 45-54.
23. T.S. Nielsen and K.B. Hansen, Do green areas affect health? Results from a Danish survey on the use of green areas and health indicators, Health & Place 13, pp. 839-850, (2007).
24. A. Gidlöf-Gunnarsson and E. Öhrström, Noise and well-being in urban residential environments: The potential role of perceived availability to nearby green areas, Landscape and Urban Planning 83, pp. 115-126, (2007).
25. H. Jonasson and H. Nielsen, “Road Traffic Noise – Nordic Prediction Method, Nordic Council of Ministers, TemaNord 1996:525, ISBN 92-9120-836-1.
26. ICBEN – International Congress on Noise as a Public Health Problem; Technical Specification ISO/TS15666:2003(E) Acoustics – Assessment of noise annoyance by means of social and socio-acoustic surveys].