JÖNKÖPING UNIVERSITY
B a c h e l o r ' s T h e s i s
The determinants of Foreign Direct Investment Inflows: The case of India
Bachelor's Thesis within Economics Author: Huyen HA 880422-T060 Tutor: Martin Andersson Mikaela Backman
Viroj Jienwatcharamongkhol Jönköping May 2011
i
Acknowledgements
I am greatly grateful to my supervisors, Martin Andersson, Mikaela Backman and Viroj Jienwatcharamongkhol, for their endless and invaluable encourage-ment, guidance and support since the very first day till to the end.
I owe my deepest gratitude to my beloved parents who give a great love, strength and support to me throughout my studies. My sincere thanks are also directed to all my friends who have made available their support in a number of ways. Special thanks to Thinh Le, who has always been standing by my side, for his helpful support and encouraging optimism. Finally, I would love to thank all of my teachers and professors in Jonkoping International Business of School as well as my classmates. You have made my recent years unforgettable. Without such precious help, I would have not been able to finish my work com-pletely.
i i
Abstract
Foreign direct investment (FDI) has been a vital role in the international financial capital flows since the end of World War II. By investigating the effect of the de-terminants on FDI inflows for 8 countries (India, China, Hong Kong, Japan, South Korea, Bangladesh, Singapore, Thailand) in the period from 1991 to 2008, this thesis explore which are the main determinants of attracting India’s FDI and in what extent do these factors effect on FDI inflows. Running two me-thodologies, namely Pooled OLS and Fixed effect for two regressions, first re-gression without Open variable, second one without GDP variables, the results are almost the same as those in previous researches. GDP and Open variable are the most significant determinant of FDI flows in 8 countries. According to the residuals analysis for India by 5 factors (GDP, Inflation, Employment, Infrastruc-ture, Open), India has high residuals. And the results confirm that all 5 factors have strong effects to attract FDI inflows in India.
Contents
1.
Introduction ... 2
2.
Investment Environment in India ... 5
2.1. Factor conditions in India ... 5
2.2. Demand conditions in India ... 5
2.3. Related and supporting industries in India ... 6
2.4. Sectors receive most FDI – Services sector and Computer Software ... 7
3.
Theoretical Frameworks ... 9
3.1 Foreign direct investment theories ... 9
3.2 Review of potential determinants ... 11
Methodology and Data ... 17
4.1 Data ... 17
4.2 Model and Methodology ... 19
Regression and Analysis ... 21
5.1 Pooled OLS estimation ... 21
5.1.1 Model without Open variable ... 21
5.1.2 Model without GDP variable ... 22
5.1.3 Discussion ... 23
5.2 Fixed effect ... 24
5.2.1 Model without Open variable ... 24
5.2.2 Model without GDP variable ... 25
5.3 Discussion ... 26
Residual analysis for India ... 27
7. Conclusions ... 29
1. Introduction
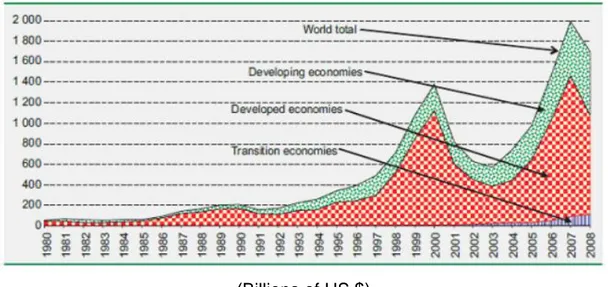
In recent years, it is accepted that foreign direct investment (FDI) has played an important role in economic development, not only in developed countries but also developing countries. According to the source from UNCTAD (United Na-tions Conference on Trade and Development), FDI flows has shown a surge in worldwide within the last two decades. Referring to figure 1 below, it was only an average of $180 billion in 1980s, since then FDI flows had not changed much until 1992, when FDI passed $200 billion. It continued rising over ten years to reach to a historic record level of $1,979 billion in 2007 (UNCTAD, 2009). The share of developing countries in FDI flows was 31% in 2007 and even in 2008, world-wide crisis decreased the total FDI flows to $1,697 billion, FDI inflows to developing countries still increased by 12% (UNCTAD, 2009).
Figure 1: FDI inflows, global and by groups of economies, 1980-2008.
(Billions of US $)
Source: UNCTAD FDI/TNC database, 2010; UNCTAD Secretariat estimates, 2010.
The reasons behind the sharp increase in the total FDI flows can be shown as the effects of multiple factors: FDI restrictions reduction of many host countries governments, rapid technological changes, growth of globally integrated pro-duction, marketing and management networks, bilateral investment treaties, prescriptions from multilateral development banks. According to Brooks et al (2003), these are the most important positive evidences that have helped many developing countries open their door to FDI.
The growth of economic conditions in advanced nations had led to increasing in investments from developed economies inflow to developing economies to serve the affluent consumers in these economies. Moreover, growing technolo-gical communication possibilities also have a positive effect on worldwide FDI flows because of the ease in communication and coordination.
Appearing as the seventh largest in area and the second largest population in the world, India has its own advantages to push its economy to become one of the fastest growing economies. India, a developing country, has 1.173 million inhabitants in 2010 (CIA world fact book, 2010), and the average age is only 26. An upward trend of Indian young average age is seen as the main source for economic growth in the coming years. Additionally, an IT development in India is one of the most important factors contributing to the growth. Even with a high education, the average wages of IT employees are still much lower than in de-veloped countries. Besides a large constant number of engineering graduates every year, the widespread knowledge of English language in India gives another advantage in communication with IT professionals (Dossani, 2006). In-dia’s IT exports was 2.7% of total services exports worldwide in 2002 (WTO). After the Soviet Union collapsed in 1991, liberalizing reforms had been underta-ken as a fully controlled economy was proven workless. Foreign investors are interested in the recent developments in India not only because of cheap labor cost, but also the expanding affluent middle class of India which raises the po-tential for successful investments in the country. Data which were collected by McKinsey (2007) showed that 62% of the total economy was recorded by pri-vate consumption, where China was only 39% in that year. These data show a rich opportunity for foreign investors.
Moreover, in terms of purchasing power parity, the economy of India is seen as the third largest economy in the world and will be gone furthermore in coming years. According to Goldman Sachs' prediction – the Global Investment Bank, India would be the largest economy of the world just after US and China by 2035. Besides, India is not only seen as a cost effective, labor intensive econo-my, but also has strong manufacturing and export oriented industrial framework. With all of advantages that India has, it is no doubt to summarizing that FDI in-flows in India showed an emerge surge from $4.8 billion in 2005 to double in 2006 and continued to increase sharply before falling as consequence of the global financial crisis in 2009.
The purpose of this thesis is to explore which determinants are important fac-tors and have strong effects on attracting FDI inflows. By looking at the effect of the determinants on FDI for 8 countries and the residual analysis for India, the results imply that all 5 factors play important role in attracting FDI inflows. This thesis will start with Investment Environment in India to help readers have a
general view about economy and condition in India. Section 3, theoretical framework that is helpful in order to explicate the relationship between invest-ment and FDI inflows and give explanations why these 5 determinants are con-sidered in methodology section. Residual analysis for India and Empirical re-sults is given in section 5 and finally conclusion is presented in section 6.
2. Investment Environment in India
2.1. Factor conditions in India
Besides skilled labor and infrastructure, there are several factors that play an important role in the competitive advantage of a country such as land, natural resources and capital. Due to a research of Acharya (2002), the infrastructural development in India cities is quite low. After conducting a survey in 1000 indus-trial firms in India, Acharya found that the average cost of power to users is more than 4.0 Indian Ruppees per unit, compared to around 2.5 India Rupees in Korean and Taiwan, more than double in North America. Additionally, the main reasons for low development are not only electricity infrastructure, but also land acquisition and bureaucracy issues (Stein, 2010). Many plans are pre-sented to improve this level of underdevelopment, however, it is still a long way to go for India before reaching a world class infrastructure and gain the full ben-efits from low cost power and fast transportation.
The characteristics of Indians are not only resourcefulness, hard working, a keen sense of responsibility, but Tayeb (1996) also mentions that Indians are thrifty, entrepreneurial, materialistic and ambitious. Tayeb would be right if all characteristics above led India become a capitalist society with high living stan-dards. Unfortunately, India still has low standards and many people live in po-verty. The main cause for this may be literacy rate of India where only 62.8% in 2006, compared to 93.5% an adult literacy rate in Thailand in 2005 and 92.1% in Malaysia in 2008 (World Bank data, 2010). This reality shows that even a widely known factor advantage of India is its large pool of educated labor; it does not mean that the whole population is highly educated and high standards of productivity. By all the facts above, it is possible to conclude that India still needs to invest in its human resource capabilities, electricity infrastructure and all infrastructural aspects, from road to rail, hardly to reach higher economic growth.
2.2. Demand conditions in India
According to the CIA world fact book (2010), total population of India reached 1.173 million in 2010, and is the second most populated country in the world af-ter China. Next to the advantage in population, the median age is only 26 years which has a positive effect on national demand. This implies that more people will be in their working age and spend their earnings. However, unemployment rates in India increases from 6.8% in 2005 to 10.7% in 2010, which shows that
the young population is inefficient utilization (CIA World Fact book, 2010). Not-withstanding, growing in the middle class of India is seen as the main source for economic growth. Mckinsey (2007) argues that over the next two decades, In-dian consumer market will be fourfold and it will bring about sharply rising in household income. There will be very intense demand for consumer goods, which is a competitive advantage for local Indian providers, as they are aware of the specific tastes of Indian consumers (Mckinsey, 2007).
2.3. Related and supporting industries in India
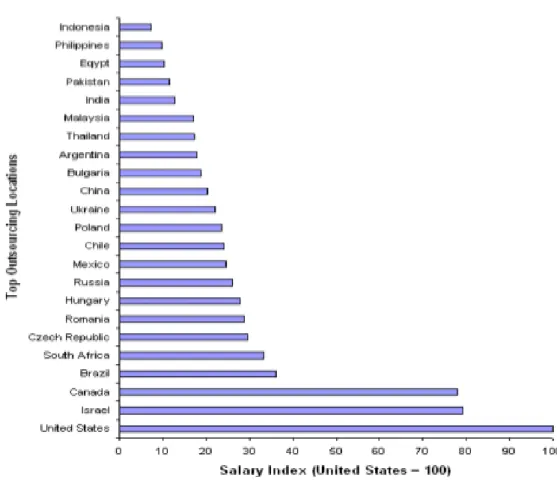
The developments of the IT industry can be taken into consideration in support-ing industries in India. Highly educated labor force with low cost is the main in-put in IT industry. Figure 3 shows that the average wages of Indians in the IT industry are much lower than in developed countries.
Figure 3: Wages for software engineer / developer.
A large number of engineering graduates is the main supporting industries. In-dia is seen as the second largest talent pool of engineers in the world due to the fact that 350,000 graduates every year from India's engineering schools by Me-ritTrac Pvt. Ltd. (2005). Whatever performed in developed countries previously can be done in India with lower labor costs. Besides, the knowledge of English language is widespread in India gives it an advantage to communicate with the IT professionals (Dossani, 2006). India's IT exports reach to 2.7% of total ser-vices exports worldwide in 2002 (WTO).
2.4. Sectors receive most FDI – Services sector and Computer
Software
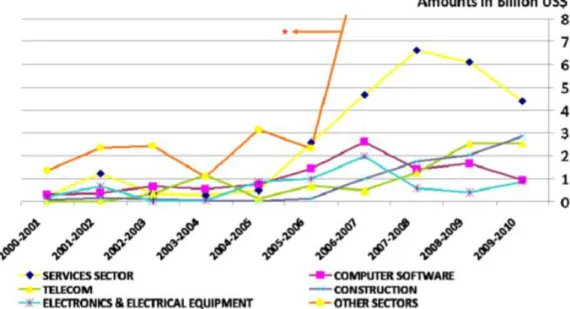
In almost major FDI receiving sectors show a sharply increase due to the growth of FDI inflows into India from 2005 to 2008. Nevertheless, there are still differences between sectors in the growth of FDI inflows. Services sector has gain the highest increase in FDI inflows, as can be seen clearly in figure 11, and followed by the computer software sector. It is no doubt that services sector and computer software sector has received a large part of FDI inflows into India. Figure 4: Sectoral break up of FDI inflows in India.
Source: DIPP, 2010, Appendix A (Financial years between April and March each year)
Moreover, the growth of the construction and telecom sectors which have a lin-kage to the IT and computer software industry, are noteworthy. The up-ward trend in these sectors can be seen clearly when links to the strong economic
growth in India and the great demand of improving infrastructure. The aim of government to increase the quality of the infrastructure is one of the main rea-sons which induce the growth of FDI inflows in construction. There was only 3% of GDP spending on infrastructure in 2002, while the objective of the govern-ment to increase to 9% by 2012 (O’Neil & Poddar, 2008). In 2002, total amount of investment in infrastructure was around $15 billion and it is expected to reach $150 billion in 2010. As a result, the construction sector became the second largest FDI receiving sector in the period of 2009-2010. Hence foreign investors attached high potential to this sector and started investing heavily.
The rapid increase in cell phone users is seen as one of major factors that cause an emergence in the telecom sector. The Indian telecom industry has more than 500 million subscribers and an average growth of 14 million sub-scribers a month. It is seen as the second largest in the world (India Telecom, 2010). Proportional inflows in sectors are shown in figure 12, and it is worthy that the services sector rapidly increase from less than 10% of total FDI in 2004/2005 to around 30% in 2006/2007. FDI may be strongly focused on infor-mation and communication services (Kumar, 2005, Reserve Bank of India, 2005). However, this is not noteworthy as the IT and communication services sector due to its strong local attributes. After presenting Business Process Out-sourcing (BPO), Indian IT exports and foreign interest in the IT services sectors has increased constantly. Firms now can outsource the operations that are not less important to their core business, such as finance, payment processing, to cost effective external providers. India is seen as a leader in the global off shor-ing market in the last decade and estimated more than US$300 billion (divided equally between IT and BPO). It is no doubt that BPO is seen as one factor which induces a high increase of FDI inflows in services when some global firms establish their own off shore outsourcing operations “captive BPO centers“ (Armenakis et al., 2006). Additionally, the proportion of FDI flowing into the fi-nancial services industry was increased from 7.82% to 17.39% in period 2005-2006 ( Department of Industry and Commerce 2005 & 2005-2006 ).It is useful in order to explain a significant relationship between the increase of FDI into the finan-cial services industry and the upward trend in FDI inflows in the services sector. Before 1991, the financial services industry was solid controlled by the govern-ment. When reforms were introduced after 1991, foreign banks was allowed to entry and made more competition (Das and Gosh, 2006). Therefore, these re-forms are considered as the main causes for the emergence of FDI inflows into the financial services sector.
3. Theoretical Frameworks
3.1 Foreign direct investment theories
FDI is an important factor in the growth in international flows of goods and capi-tal. It also steps up the interaction between states, regions, firms and also pushes interconnected economic activity across boundaries. According to IMF Balance of Payments Manual (paragraph 359, fifth edition, 1993) and Bench-mark Definition of foreign direct investment (page 7, third edition, 1999), FDI is defined as “the category of international investment that reflects the objective of
a resident entity in one economy obtaining a lasting interest in an enterprise resident in another economy“. The notion of “lasting interest“ contained two
cri-teria:
- The existence of a long-term relationship between the direct investor and the enterprise.
- The significant degree of influence on the management of the enterprise. As two criteria mention, direct investment is the foreign direct investor owns 10 percent or more of shares or voting power of a firm located in a foreign econo-my. And it gives him or her right to take a part in management or control. Two main modes of FDI were mentioned by Johnson (2005): Greenfield and Brown-field FDI. The term of GreenBrown-field refers to the case when multinational enter-prises (MNEs) build new facilities in the host country. However, Brownfield FDI involves merging with or acquisition an existing firm in the host country to re-construct by MNE.
Three main theories of FDI are noted by Morgan and Katsikeas (1997). There are market imperfections theory, international production theory, and internali-zation theory. The market imperfections theory implies that firms seek for mar-ket opportunities and their decision to invest overseas is explained as a strategy to capitalize on certain capabilities not shared by competitors in foreign coun-tries (Hymer, 1970). Nevertheless, this theory does not mention why firms pro-duce products or services in particular countries for world markets. Hence, Dunning (1980) and Fayerweather (1982) presented the international produc-tion theory.
Two indicators are taken to be considered to international production theory; there are the particular attractions of its home country compared with resource
implications and advantages of locating in another country. As Markusen and Venables (1999) mentioned, international economic activity implies foreign pro-duction and intra-firm trade by multinational firms. With low transportation costs and widely available communication technology, firms tend to increasingly use low cost production locations to supply raw materials and final goods or servic-es. In addition, nations which are near to the markets are more attractive for firms to invest in and concentrate on their production. Moreover, overseas in-vestment activities are not only determined by resource differentials and the ad-vantages of the firm, but also host government actions may effect to attractive-ness and entry conditions.
The third FDI theory was introduced by Morgan and Katsikeas (1997), which was internalization theory. Internalization states expanding the direct operations of a firm and brings under common ownership and control the activities lead by intermediate markets that connect the firm to customers. It is the ultimate form of FDI. Besides producing internationally, this theory implies that sales, market-ing and other activities of the firms should be shifted to an exportmarket-ing country. According to the life cycle theory which was presented by Vernon (1966), there is a strong connection between international comparative advantage and FDI. The characteristics of the product change as a product moves through the product-life cycle. It implies that optimal location for production also changes over time. When innovations are turned to actual products, the product-life cycle begins. In consequence of the high level of income and demand, increasing ri-vals finally pushes production to move from the high income economies or de-veloped countries to lower income economics in order to minimize production costs. Exporting the product from low income, in other words, from developing countries to the rest of the world is an efficient way to satisfy the demand.
Dunning (1979 and 1981) introduced the theoretical background on FDI which is “eclectic (OLI) paradigm“. Based on this theory, before deciding to undertake FDI, three conditions that needs to be fulfilled: (1) Ownership advantages, what firm should have in the host country over its competitors. Ownership advantag-es are usually concerned about intangible assets such as patents, brand name, know-how, etc. (2) Internalization advantages: the case when a firm seeks more benefits to internalize its advantages instead of exchanging them through li-censing, alliances or other contracts. (3) Locational advantages that make a firm decide to have production oversea rather than exporting.
If ownership and internalization advantages give a firm opportunities to move to different regions, locational advantages belongs to country particular. For that reason, this study concentrates on identifying the host country characteristics that promote FDI inflows.
3.2 Review of potential determinants
3.2.1 Potential determinants which will be used in the analysis model:
There are many determinants which are seen as having a large impact on at-tracting inward FDI. But due to the lack of available data, only 5 determinants are used in my thesis. There are GDP – the proxy of market size, inflation rate, trade openness, infrastructure and the size of labor market.
Market size
Due to the fact that a large market is essential for efficient specialization of pro-ductive factors, market size is considered as one of the most crucial determi-nant of FDI. According to Resmini (2000), Demand for investors’ products is measured by market size. And only when a certain level of market size is prov-en, FDI flows will come (Lunn, 1980). To measure market size, absolute gross domestic product (GDP) or per-capita GDP is used. Even Root and Ahmed (1979) pointed out that absolute GDP only indicates population size rather than income; GDP and per-capital GDP show different sides of market size. Fur-thermore, Chakrabarti (2001) mentioned that the size of the whole economy is shown by GDP whereas per-capita GDP indicates the income level. In several studies, researchers use GNP to measure market size. However, GNP is seen as a miserable indicator because it excludes foreign investments in the country while including nationals’ investments abroad (Chakrabarti, 2001).
The link between market size and FDI flows is tested by many researchers. By collecting data on 58 developing countries over the period of 1966-1970, Root and Ahmed (1979) used a single equation analysis to imply that market size play a vital determinant of FDI flows. Also, Tsai (1994) examined 62 countries and 51 countries over the period of 1975-1978 and 1983-1986, with a simulta-neous equation model, and found out that market size significantly affects FDI. In Chakrabarti’s (2001) sensitivity analysis of cross country regressions on FDI determinants, he showed that absolute GDP is uniquely the most important de-terminant of FDI. Besides, higher real per-capita GDP push up FDI is mani-fested by Jun and Singh (1995) who examined data of 31 countries over the pe-riod of 1970-1993.
In Culem (1986), bilateral flows among 6 industrialized countries in period of 1969-1982 found out that market size as a significant determinant of FDI flows. By the same way, Billington (1999) tested bilateral flows among 7 industrialized countries over the period 1986-1993 and identifies the same results as Culem.
Trade Effects
Trade barriers and trade openness are two possible factors which seize trade effects on FDI. Trade barriers is used as a relevant determinants which predict tariffs will provoke FDI, and trade openness is seen as a possible determinant anticipate a generous economy to attract more FDI.
Scaperlanda and Mauer (1969) argued firms can enter these protected-countries by FDI way. Afterwards trade barriers encourage FDI and liberaliza-tion of trade reduces FDI. Nevertheless, tariff rates which are used to measure trade barriers are not always easy to recognize.
However, Scaperlanda and Mauer (1969) and Culem (1986) rejected tariff dis-crimination hypothesis in their analysis of U.S direct investment in E.E.C for the period 1952 to 1966 and FDI among industrialized countries over the years 1969 to 1982, respectively. Jun and Singh (1995), on the other hand, stated that trade barriers positively affect FDI.
There are several ideas convincing that open economies attract more FDI. Firstly, Jun and Singh (1995) argued that liberal trade economies would make foreign investors to be more confident. Secondly, it will be easier for firms to seek profit and equity participation in an open economy (Wheeler and Mody, 1992). What is more, raw materials and intermediate products are imported easily (Erdal and Tatoglu, 2002). Trade openness is measured by the ratio of exports to GDP plus ratio of imports to GDP. A significantly positive relationship between trade openness and FDI was found out by estimating the ratio of ex-ports to GDP (Root and Ahmed, 1978).
In the study of Wheeler and Mody (1991), it is insignificant if there is any effect of trade openness on U.S FDI. According to Bevan and Estrin about FDI deter-minants in European transition economies for the period 1994 to 2000 year 2004, FDI and trade are complementary. Resmini (2000) concluded that trade openness is one of the most vital indicators that attracts FDI particularly in science-based and capital intensive sectors. In the same line, Janicki and Wun-nava (2004) indicated the ratio of imports to GDP is the most important factor which effects on investment. Last but not least, Sun et al. (2002) implied trade openness is one of the significant regional FDI determinants in China for the pe-riod of 1986-1998.
Inflation
In FDI studies, inflation is known as a macroeconomic indicator which reflects how effective a government and central bank are in controlling the money supply and the budget. Therefore, a high rate of inflation is considered as a dis-couraging factor for FDI.
Following to the results of Schneider and Frey (1985), the higher inflation is, the lower the rate of FDI inflows in less developed economies is. In addition, Rodri-quez and Pallas (2008) implied that the difference in inflation between EU and Spain is one of the major reasons for reducing FDI flows to Spain.
Infrastructure
As infrastructure implies how smooth the operations can move in a location, it is pretty clear to add infrastructure as an FDI determinant (Zhao and Zhu, 2000). In general, infrastructures consist of telecommunication and transportation. In the same line, Wheeler and Mody (1992), Sun et al. (2002) and Kok and Ersoy (2009) showed a significant relation between infrastructure and agglomeration effect, especially communication infrastructure. By analyzing data in China over the period of 1992-1995, a significantly positive effect of infrastructure on FDI flows in to China was implied by Zhao and Zhu (2000).
3.2.2 Other determinants Employment
(a). Labor Costs
Firms seek more profit by investing in low labor costs countries, that is low labor costs encourage FDI to the host country (Schneider and Frey, 1985). Labor costs are estimated by wages and unit labor costs. This theory seems to be clear, but there is very limited studies concerning about the effects of labor costs (Chakrabarti, 2001).
According to Shneider and Frey (1985), higher wages reduces FDI. The same results were found out in Tsai (1994), Wheeler and Mody (1992). However, in Jun and Singh (1995), they argued there is only weak negative impact. The ef-fect of labor costs become to shape off due to the efef-fect of the market size as national income rises.
(b). Skilful Labor Force (Labor Quality)
As FDI brings new technology to the host country (Cartensen and Toubal, 2004), well-educated workers are better educated to use new technologies (Nelson and Phelps, 1966). Therefore, it requires skilful labor force to make in-vestment become more valuable. According to Schneider and Frey (1985), skil-ful labor is estimated by the share of an age group in secondary education, and they found out insignificantly positive of FDI effects on less developed econo-mies. Moreover, Cartensen and Toubal (2004) indicated that there was a signif-icant determinant of EU FDI flow to the CEECs over the period of 1993-1998. In case of China, Sun et al. (2002) mentioned that increased labor quality plays vital role on encouraging FDI inflows. Labor quality is estimated by student to teacher ratio in Deichmann et al. (2003), and found out that labor quality signifi-cantly affect FDI flows to Turkey in 1995.
Growth
According to Schneider and Frey (1985), development potential in the future is strongly affected by the growth rate of economy. In the same line, the growth hypothesis, which was mentioned by Lim (1983), states a more quickly growing economy induces greater profit opportunities than the one that slowly grows, when they have all other things equal. Hence, growth rates are presented as a determinant of FDI.
Many researchers collected data and found out a significant effect of economic growth rates on FDI among industrial countries, such as Schneider and Frey (1985), Root and Ahmed (1978), Tsai (1994), etc. In order to study the effect of growth rates on US multinationals FDI in the E.E.C over the period of 1952-1966, Scaperlanda and Mauer (1969) got negative but insignificant results. On the other hands, results which were found by Lunn (1980) claimed a significant-ly positive determinant of growth on US FDI in the E.E.E over the period of 1957-1970.
Taxes
As Blonigen (2005) mentioned, tax incentives would boost FDI, therefore higher tax rates discourage FDI. However, the effect of taxes on FDI is not that simple. Blonigen (2005) also claimed about the effects of taxes can vary substantially due to the magnitude of tax rates. In addition, multinational enterprises are faced to double taxation in both home and host countries, which makes this is-sue more complicated. Hence, double tax policies also can modify the effects of taxes on FDI (Hartman, 1984).
According to Hartman’s (1984) analysis of FDI in US for the period of 1965-1979, tax incentives significantly increase FDI. And Lim (1983) found the same result when analyzing the relation between fiscal incentives and FDI in 21 less developed countries over the period of 1965-1973. A significantly negative ef-fect of corporate tax rates on FDI is remarked by Cartensen and Toubal (2004).
Exchange rate
Most researchers agreed that depreciation in host country’s currency should encourage FDI inflow due to the competitiveness. It makes sense when firms decide to invest in an undervalued currency, which will help reduce unit cost of investment and enable larger investments (ECLAC, 1998). Ramirez (2006) stated it also pushes up profits in the export-oriented sectors. Contrast with this advantage, investing in depreciation currency in a host country not only reduce unit costs of investment but also diminish the value of profits and a dividend which should be turned back to the parent company, in other words, it also re-duces the real rate of return on the investment (Mello, 1997). In general, ex-change rate can be considered as a critical determinant of FDI, and its effect can alter FDI.
Particularly, in case of the U.S, Froot and Stein (1991) implied that a real de-preciation of dollar raised FDI. Investigating Japanese investments flow in the U.S over the period of 1975-1992, Blonigen (1997) stated that the real devalua-tion of the dollar makes Japanese investments more likely. According to Ed-wards (1990), OECD FDI flows into the less developed countries and indicated a significantly positive effect of appreciation of the domestic currency. Further-more, in Ramirez’s time series analysis (2006), the depreciation of the domestic currency in Chile is the main reason which induces FDI inflows.
Agglomeration Effects
According to Sun et al. (2002), agglomeration effects concern about the con-centration of investments that enables economies of scale and creates positive externalities for the investors. Even there are still a few agglomeration effects, such as existing level of FDI and infrastructure, but agglomeration in host coun-try will affect positively inflows of FDI.
Existing Level of FDI
Because of hardly collecting information about new markets, existence of for-eign owned firms will supply information and make investor to be more confi-dence. Therefore, Guimares et al. (2003) argued that foreign investors may fa-vor to pour their money in countries with a concentration of FDI. In addition, lev-el of existence of other foreign investors reflects success and market potential (Deichmann et al., 2003). Effect of existing level of FDI is also remarked by Wheeler and Mody (1992) where current foreign investment has a large and positive impact on FDI inflows. On the other hand, Sun et al. (2002) stated that after a certain level, there might be a negative agglomeration effect and exter-nalities, particularly in case of China.
Methodology and Data
4.1 Data
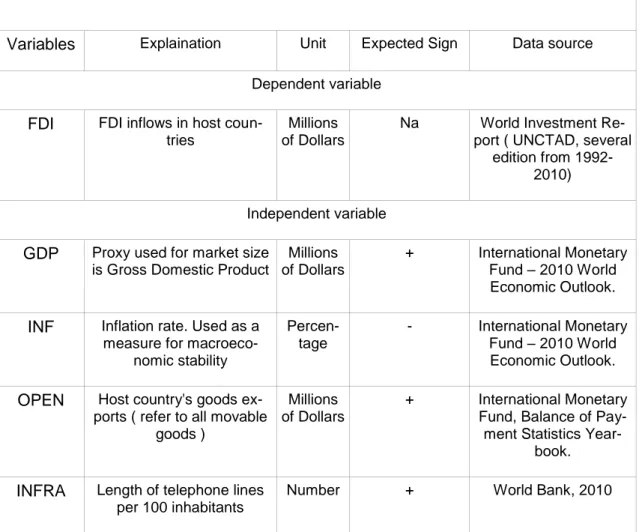
In my analysis, 8 countries which has a large impact on Asia economy, is used and 18 years, from 1991 to 2008 will be examined. These economies are India, China, Hong Kong, Japan, South Korea, Singapore, Bangladesh and Thailand. Data for the dependent variable FDI inflows are collected from the World In-vestment Report ( UNCTAD, edition from 1992-2010 ), GDP, exports, inflation, infrastructural and employment to population ratio are classified into predictors and control variables. Table 1 contains all information about proxy, expected sign and data source of dependent and independent variables. Variables are chosen based on the potential determinants which discussed in section two and availability of data. Dataset is collected from various sources and edition as mention in table 1.
Table 1: The determinants of inward FDI
Variables Explaination Unit Expected Sign Data source
Dependent variable
FDI FDI inflows in host coun-tries
Millions of Dollars
Na World Investment Re-port ( UNCTAD, several
edition from 1992-2010) Independent variable
GDP Proxy used for market size is Gross Domestic Product
Millions of Dollars
+ International Monetary Fund – 2010 World Economic Outlook.
INF Inflation rate. Used as a measure for
macroeco-nomic stability Percen-tage - International Monetary Fund – 2010 World Economic Outlook.
OPEN Host country's goods ex-ports ( refer to all movable
goods )
Millions of Dollars
+ International Monetary Fund, Balance of
Pay-ment Statistics Year-book.
INFRA Length of telephone lines per 100 inhabitants
EMPL Employment to population ratio. Used as measure for
the youth population
+ International Labour Organization
In my dataset, one interesting thing should be mentioned is foreign direct in-vestment inflows to Japan turned to minus $6.5 billion after inflows of $2.8 bil-lion in 2005. According to a United Nation development agency, the fall of FDI inflows to Japan in 2005 was caused by divestments by large transnational companies, including Vodafone Group PLC.
Market size (GDP): GDP is used as the proxy for market size in order to take care of the inflation effects. GDP calculation is inflation adjusted, as GDP in-creased, people’s income and their consuming power also increased which is expected to increase their demand for foreign investors’ products. GDP variable has an expected positive effect.
Infrastructure (INFRA): Communication infrastructure is used to estimate infra-structure because good infrainfra-structure network is required for steady functioning of business. Hence, improvement in infrastructure is related to an increase in FDI flows. That’s the reason to choose length of telephone lines per 100 inhabi-tants is used as a proxy. Expected effect of the variable is positive.
Inflation (INF): Inflation implies macroeconomic stability or not, therefore a neg-ative effect is hypothesized.
Trade Openness (OPEN): Export is used as a proxy for trade openness. It is expected to have a positive sign impact on attracting FDI inflows.
Employment (EMPL): The number of employment age to population ratio is used to measure the youth population. It is expected to have a positive sign. To examining the effects of these determinants on FDI inflows, 8 countries are presented because they are 8 countries which have strong effects on Asian economy. Due to the lack of available data, data can be collected on only short time from 1991 to 2008.
4.2 Model and Methodology
Through this research I would like to see if there is any mutual effect between FDI inflows and other variables, and how strong influence those variables have on the FDI. The following equation based on the theoretical background and the empirical research in this subject. The dependent variable in this regression is FDI inflows and the independent variables are GDP, trade openness, employ-ment to population ratio, inflation and infrastructure. These variables were se-lected by the availability of the data for 8 giant economics in Asia in 18 years from 1991 to 2008.
The model is specified in log-linearised form as below:
lnFDI = β0 + β1lnGDP+ β2lnOPEN + β3lnEMPL+ β4INF+ β5lnINFR + ε
In dataset, due to the fact that FDI inflows to Japan is negative (-$6,506 million) in 2006, I can not take a natural log directly. To avoid a bad effect of this nega-tive data, instead of taking a natural log on the value directly, I take a natural log on the square of it. Based on the theoretical frameworks in Section 2.2, it is ex-pected to find positive coefficients for GDP, open to trade, employment and in-frastructure as these will be positively correlated to FDI inflows. On the other hand, inflation is considered as macroeconomic stability measure, and it is ex-pected to be a negative effect on inducing FDI inflows.
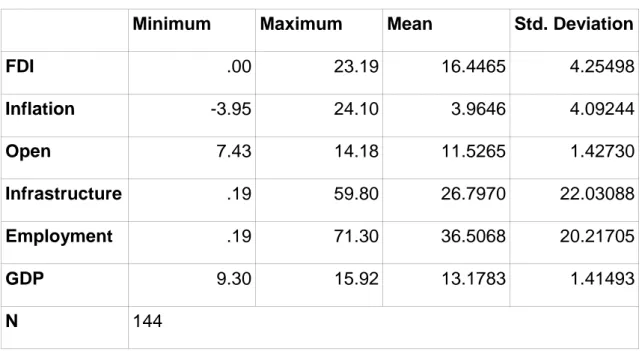
Table 2: Descriptive statistics
Minimum Maximum Mean Std. Deviation
FDI .00 23.19 16.4465 4.25498 Inflation -3.95 24.10 3.9646 4.09244 Open 7.43 14.18 11.5265 1.42730 Infrastructure .19 59.80 26.7970 22.03088 Employment .19 71.30 36.5068 20.21705 GDP 9.30 15.92 13.1783 1.41493 N 144
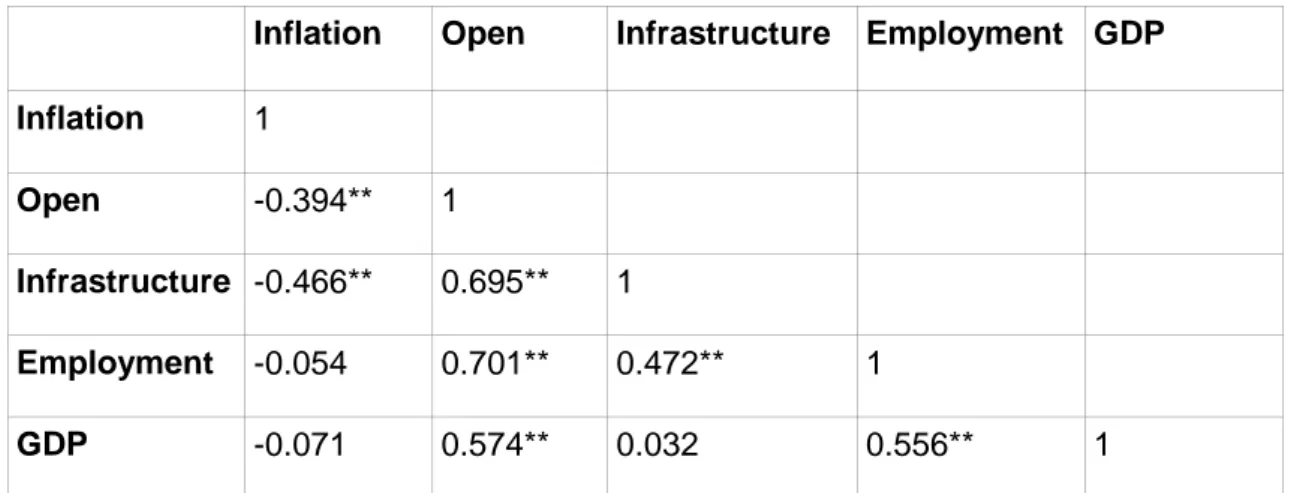
According to Chakrabarti (2001), a lot of macro variables are used in FDI determinant researches which implicitly bears the risk of high correlation. A high correlation for this data set might lead to multicollinearity problems. In order to
check the problem of multicollinearity, table 3 below provides the Pearson correlation matrix. The same form of variables in the model are included in correlation calculations.
Table 3: Pearson correlation matrix.
Inflation Open Infrastructure Employment GDP Inflation 1
Open -0.394** 1
Infrastructure -0.466** 0.695** 1
Employment -0.054 0.701** 0.472** 1
GDP -0.071 0.574** 0.032 0.556** 1
**. Correlation is significant at the 0.01 level
As the results are shown in table 3, there are several variables which have high correlations. Open variables show significant correlation at 1% level with all va-riables, especially high correlation with employment and infrastructural. To avoid multicollinearity, two models are presented:
lnFDI = β0 + β1lnGDP + β2lnEMPL+ β3INF+ β4lnINFR + ε
Regression and Analysis
5.1 Pooled OLS estimation
5.1.1 Model without Open variable
lnFDI = β0 + β1lnGDP + β2lnEMPL+ β3INF+ β4lnINFR + ε
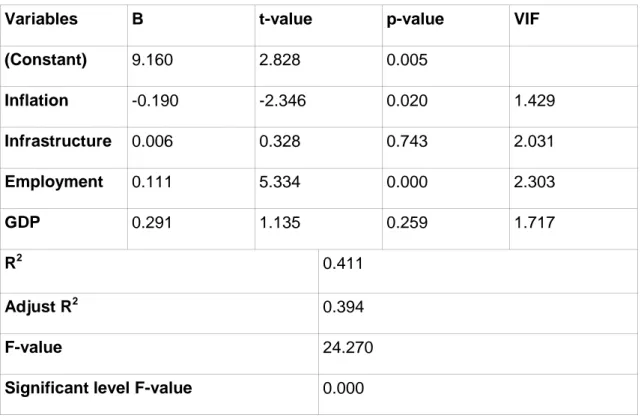
Table 4 shows that only two variables included in the log-linear regression, namely inflation and employment, appear significant at 5% level. The coefficient of determination R2, which measures how well the sample regression line fits the data, is 0.411. That explains that 41% of the variation in FDI can be ex-plained by the independent variables in this model. Due to the fact that R2 of 1 indicates a perfect fit, 41% is a slightly acceptable value. Moreover, ”the VIF shows how the variance of an estimator is inflated by the presence of multicolli-nearity” (Gujarati, 2009) and VIF will be 1 if there is no collinearity among va-riables. As the results show in table 4, they appear to be no grave collinearity problem.
Table 4: Empirical Results for Regression 1.
Variables B t-value p-value VIF
(Constant) 9.160 2.828 0.005 Inflation -0.190 -2.346 0.020 1.429 Infrastructure 0.006 0.328 0.743 2.031 Employment 0.111 5.334 0.000 2.303 GDP 0.291 1.135 0.259 1.717 R2 0.411 Adjust R2 0.394 F-value 24.270
Significant level F-value 0.000
To summarize, in the model, only inflation and employment have acceptable significance. A high F of 24.270 implies that at least one of the variables
in-cluded in the model is significant. And all variables appear the same as ex-pected signs.
5.1.2 Model without GDP variable
lnFDI = β0 + β1lnOPEN + β2lnEMPL+ β3INF+ β4lnINFR + ε
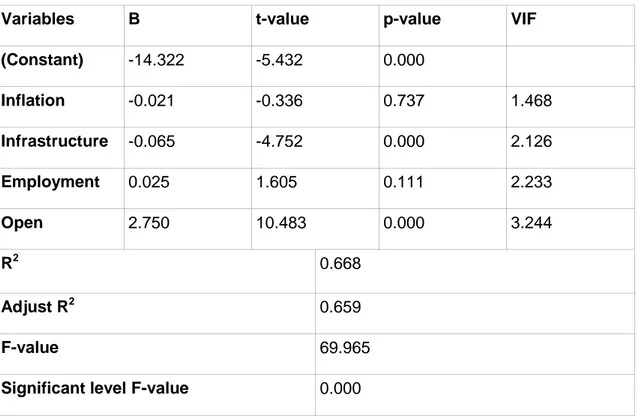
The value of R2 in this model is higher than the onein the previous model, as the value of R2 is 0.668, it indicates that almost 67% of the variation in FDI can be explained by the independent variables in this model and it is a highly ac-ceptable value. There are only two variables – infrastructure and open – appear significant at 5% level. In the last column in table 5, the greatest value of VIF is 3.244 is below 4 and acceptable.
Table 5: Empirical Results for Regression 2
Variables B t-value p-value VIF
(Constant) -14.322 -5.432 0.000 Inflation -0.021 -0.336 0.737 1.468 Infrastructure -0.065 -4.752 0.000 2.126 Employment 0.025 1.605 0.111 2.233 Open 2.750 10.483 0.000 3.244 R2 0.668 Adjust R2 0.659 F-value 69.965
Significant level F-value 0.000
In comparison with the model without open variable, this model has a higher R2 and higher F value but seem to be involved in collinearity. A high F of 69.965 shows that at least one of the variables in this model is significant. Moreover, infrastructure appears in opposite to expected signs, while other variables do the same.
5.1.3 Discussion
Comparing the two models (without open variable and without GDP), even though R2 in the second model is much higher than R2 in the first model, it does not imply that the second model is better than the first one. According to Pear-son matrix correlation table, an open variable appears to significant correlation at 1% level with all variables and particularly high correlation with employment and infrastructure. Moreover, in empirical results table 5, the value of VIF for open variable is close to 4 which show that it has a collinearity problem. In addi-tion, the model 2 obtains a higher R2 than the first model does, but variables have signs that are contrary to expected signs. Hence, even with a lower R2, it the first model is not necessarily bad.
5.2 Fixed effect
In fixed effect model, each country has its own intercept value and India is taken as a base. Since there are 8 countries, only 7 dummy variables are introduced in order to avoid falling into the dummy-variable trap.
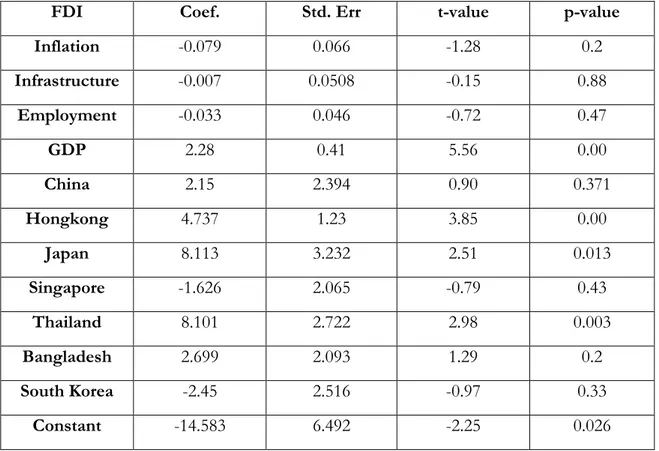
5.2.1 Model without Open variable
The first thing to notice about these results is that only three differential inter-cept coefficients are individually statistically significant at 5% level of signific-ance, namely D2, D3, D5. The value of the slope coefficients given in table 4 and in table 6 below are different, raising a doubt about the results presented in table 4.
Table 6: Fixed effect estimation
FDI Coef. Std. Err t-value p-value Inflation -0.079 0.066 -1.28 0.2 Infrastructure -0.007 0.0508 -0.15 0.88 Employment -0.033 0.046 -0.72 0.47 GDP 2.28 0.41 5.56 0.00 China 2.15 2.394 0.90 0.371 Hongkong 4.737 1.23 3.85 0.00 Japan 8.113 3.232 2.51 0.013 Singapore -1.626 2.065 -0.79 0.43 Thailand 8.101 2.722 2.98 0.003 Bangladesh 2.699 2.093 1.29 0.2 South Korea -2.45 2.516 -0.97 0.33 Constant -14.583 6.492 -2.25 0.026
According to table 6, the value of R2, 0.7483, is highly acceptable. It means that around 75% of the variation in FDI can be explained by the independent va-riables. However, there is only one variable GDP is statistically significant at 5% level. Since the slope of GDP coefficient is 2.28, GDP is the only one variable has positive correlated to induce FDI inflows. The fact that this result is the same as previous researches which used GDP as an indicator for the level of the market shows that GDP is the strongest correlated variable to FDI inflows. On the other hand, infrastructure and employment appear insignificant at 5%
level and have opposite signs to expected signs. It can be concluded that there is only GDP which has a positive correlated to FDI inflows. The higher the level of GDP is, the higher the amount of FDI inflows is.
5.2.2 Model without GDP variable
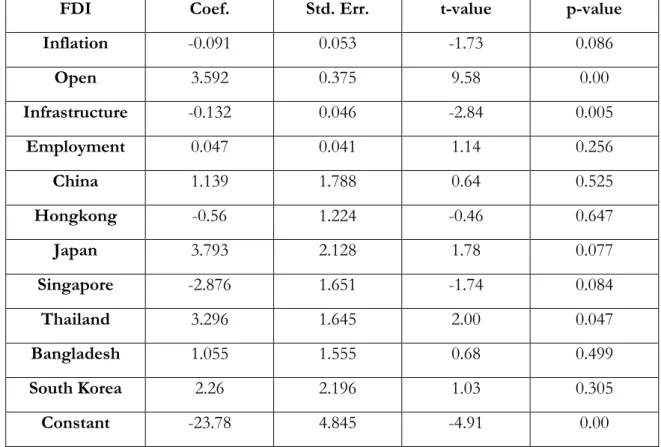
As these results shown in table 7, there is only one differential intercept coeffi-cient are statistically significant at 5% level of significance, is D5. The value of the slope coefficients given in table 5 is different from table 7, again raising a doubt about the results in table 5.
Table 7: Pooled OLS model with country dummies.
FDI Coef. Std. Err. t-value p-value Inflation -0.091 0.053 -1.73 0.086 Open 3.592 0.375 9.58 0.00 Infrastructure -0.132 0.046 -2.84 0.005 Employment 0.047 0.041 1.14 0.256 China 1.139 1.788 0.64 0.525 Hongkong -0.56 1.224 -0.46 0.647 Japan 3.793 2.128 1.78 0.077 Singapore -2.876 1.651 -1.74 0.084 Thailand 3.296 1.645 2.00 0.047 Bangladesh 1.055 1.555 0.68 0.499 South Korea 2.26 2.196 1.03 0.305 Constant -23.78 4.845 -4.91 0.00
The value of R2 is not only higher than the value of R2 in table 5 but also higher than the value of R2 in table 6. Open and infrastructure variables appear to be highly significant at 5% level. All variables show the same sign as expected signs given in table 1, except infrastructure. The slope of open coefficient is 3.5925 and it is also the greatest among the four variables. Open variable ap-pears to be the strongest correlated to FDI inflows, following by employment va-riable. Infrastructure is also significant at 5% level, but it still shows opposite signs to expected signs in table 1.
5.3 Discussion
After running two methodologies, namely Pooled OLS model, for two regres-sions mentioned above, the results are almost the same as those in previous researches. As the proxy for market size (GDP) appears to be positive corre-lated to FDI in both Pooled OLS method and Fixed effect method, this result confirms the theoretical frameworks in section 2.2. That is the higher the level of GDP is, the higher the amount of FDI inflows is. Secondly, open variable also shows the same sign as expectation, positively correlated to FDI inflows in both Pooled OLS method and Fixed effect method. Negative correlation between in-flation and FDI is confirmed in all tables (2 methods and 2 regressions). A high rate of inflation will discourage FDI inflows as it is seen as an indicator of macro economic instability. Increasing inflation is synonymous with decreasing FDI. The coefficient of infrastructure is negative correlation in three of four tables. This result either implies that no incentives have been made for foreign inves-tors by improving in infrastructure or the improvement in infrastructure is not enough to be significant. Both of reasons are possible, but the second one is more likely. It is because using only the number of length of telephone lines per 100 inhabitants to estimate for infrastructure may not be enough to reflect the effect of infrastructure on attracting FDI inflows. The effect of infrastructure on FDI inflows opposites to expected in theoretical frameworks, and contrast to what previous studies have found.
Employment to population ratio is used as a measurement for the young popu-lation. The coefficient of employment implies the positive relation between FDI inflows in three of four table, except table 6 (Pooled OLS model without open variable). This result confirms that the skilled labor and the level of available employment play a crucial role in the competitive advantage of a country, as they make it easier for foreign firms to seek their design level of employment to obtain profit and also to operate successfully
Residual analysis
These residual plots can be used to assess the quality of the regression. The underlying statistical assumption about residuals can be examined such as constant variance, independence of variables and normality of distribution. The residuals would have to be randomly distributed around zero. If the model fit to the data were correct, the residuals would approximate the random errors that make the relationship between the explanatory variables and the response vari-able a statistical relationship. And the residuals behave randomly which means the model fits the data well. Red pins are the residuals for India, and blue pins are the residuals for the remaining countries.
6.1 Model without GDP
As we can see from the figure 5.1, the residuals for India have to be randomly distributed around zero. For the early years 1991-1995, the model tends to pre-dict less FDI compared to the actual FDI, from -2.81 to -0.07. In the later years 1996-2008, the residuals tend to be larger and closed to zero from 0.06 to 0.74. Except 3 years 2005, 2007, 2008, the models tend to predict less FDI compared to the actual FDI, -0.45, -0.14, -0.33, respectively.
6.2 Model without OPEN
In the Figure 5.2, the residuals for India have an upward trend through 18 years. The model tends to predict less FDI compared to the actual FDI from 1991 to 2005. The furthest residual is -3.61 in 1991, and the residuals tend to come closer to zero in 2005 (-0.29). These are 3 years 2006, 2007 and 2008, the model predicts greater FDI compared to the actual FDI, 0.93, 1.15, 1.63 respec-tively.
Figure 5.2: The residuals for different countries in Model
with-out Open
7. Conclusions
The advantages of receiving FDI is not only increasing foreign currency inflows and employment, but it also helps a developing country to rapidly emerge from a low level to more admirable standards. Many countries have been realized that increasing in FDI inflows will bring in many benefits to a host country. Be-fore 1990's, budget and current account deficits had been a headache for the Indian government. To reduce these deficits, policy makers have suggested one of the ways is to attract more foreign investment inflows in comparison to out-flows. Since the beginning of the 1990's, India's economy was liberalized by in-troducing extensive reforms. Indian government began to propose investment incentives. The incentives analyzed in this thesis are also focused on what de-termines the level of FDI inflows to India by investigating factors believed to in-fluent the level of inward FDI in 8 giant economies in Asia. By looking at the ef-fect of the determinants on FDI for 8 countries and the residual analysis for In-dia, the results imply that all 5 factors play important role in attracting FDI in-flows. The long-term effects of these determinants on attracting FDI inflows are hard to predict, since the level of FDI inflows in 8 countries fluctuate over time and not sufficient time has passed to estimate the effects.
Firstly, inflation appeared in the same side as expectation, negatively correlated with the level of inward FDI. In addition to this, the younger the population is, the more opportunities for firms to seek their design level of employment to gain maximum profit.
Secondly the proxy for market size (GDP) and open appear to be the same signs as the expectation and the previous researches in section 2.2 in Pooled OLS method. These results emphasize again, the higher the level of GDP and export (which measure for trade openness) are, the higher the amount of FDI inflows in the next period is, providing that other things remain unchanged. Oth-erwise, looking at residual analysis and residual plot for India, it appears that the level of FDI would be low when the level of GDP and open are high.
On the other hand, an interesting result are pointed out in methodology for 8 countries, there is a negative correlated between the level of infrastructure and the level of FDI inflows. These results opposite to what previous researches on FDI declare. A negatively correlated between infrastructure and FDI inflows can be excused by data unavailability and the data used to estimate are not enough to reflect the effect of infrastructure on attracting FDI inflows. But in India case, the spread of the level of FDI increases as infrastructure increases.
As India's economic situation and other economies in Asia become stronger and growth faster over the time, one can assume that the level of FDI inflows in
these countries will be continue. Future research in this field can concentrate on the analysis of FDI incentives in a group of developing countries, as they share the same status and investment climate. Furthermore, it could be better to test the causality effect between FDI inflows and its determinants to estimate what affects what. Last but not least, it would be interesting to analyze the change of the FDI factors in India over time.
References
Brooks, D.H., Fan, E. X. & Sumulong, L.R. (2003). Foreign Direct
In-vestment in Developing Asia: Trends, Effects, and Likely Issues for the forthcoming WTO Negotiations. Working Paper (ed. 38), Asian
Develop-ment Bank (p. 1-50), from:
http://www.ppl.nl/bibliographies/wto/files/1435.pdf
UNCTAD, World Investment Report (2006). Retrieved from http//www.unctad.org/templates/webflyer.asp?docid=7431&intItemID=39 68&lang=1&mode=downloads
UNCTAD, World Investment Report (2007). Retrieved from : http//www.unctad.org/templates/webflyer.asp?docid=9001&intItemID=43 61&lang=1&mode=downloads.
CIA world fact book (2010). Retrieved
http://www.cia.gov/library/publications/the-world-factbook/goes/in.html Dossani, R. (2006). Origins and Growth of the Software Industry in India,
Asia-Pacific Research Center (p.1-46), Stanford University, Stanford (
CA ).
Mckinsey – Nasscom report (2005. Extending India’s Leadership of the
Global IT and BPO Industries, retrieved from :
http://www.mckinsey.com/locations/india/mckinseyonindia/pdf/nasscom_ mckinsey_report_2005.pdf
IMF (1993), Balance of Payments Manual, Fifth edition. Retrieved from:
http://www.imf.org/external/pubs/ft/bopman/bopman.pdf
OECD (1999) Benchmark Definition of Foreign Direct Investment, Third
Edition. Retrieved from:
http://www.oecd.org/dataoecd/10/16/2090148.pdf
Morgan, R. E. & Katsikeas, C. S. ( 1997 ). Theories of international trade,
foreign direct investment and firm internationalization: a critique.
Re-trieved from:
http://www.st-
an-drews.ac.uk/business/distance/Economics/Reading/Critique_trade_theori es.pdf
Hymer, S. (1970). The Efficiency (Contradictions) of Multinational
Markusen, J.R. & Venables, A.J. (1999). Foreign direct investment as a
catalyst for industrial development, European Economic Review, 43, p.
335-356
Dunning, J. H. (1980), “ Toward an eclectic theory of international
pro-duction: some empirical tests “, Journal of International Business
Stu-dies, 11 (1), p. 9-31
Fayerweather, J. (1982), International Business Strategy and
Administra-tion, Ballinger, Cambridege, MA.
Dunning, J. (1979). Explaining Changing Patterns of International
Pro-ductionÖ In Defence of the Eclectic Theory. Oxford Bulletin of Economics
and Statistics, 41(4), 269-295
Dunning, J. (1981). “ Explaining the international direct investment
posi-tion of countries. Towards a dynamic or developmental approach.”
Welt-wirtschaftliches Archiv 117, no. 1 : 30-64
Vernon, R. (1966), International investment and international trade in the
product cycle, Quarterly Journal of Economics, 80, 190-207
Lunn, J. (n.d). Determinants of U.S direct investment in the E.E.C Euro-pean Economic Review, 13(1), 93-101
Resmini, L. (2000). The Determinants of Foreign Direct Investment in the
CEECs: New evidence from sectoral patterns. Economics of Transition,
8(3).
Root, F., & Ahmed, A. (1979). Empirical Determinants of Manufacturing
Direct Foreign Investment in Developing Countries. Economic
Develop-ment & Cultural Change, 27(4), 751.
Chakrabarti, A. (2001). The Determinants of Foreign Direct Investment:
Sensitivity Analyses of Cross-Country Regressions. Kyklos, 54(1),
89-113.
Schneider, F., & Frey, B. (1985). Economic and political determinants of
foreign direct investment. World Development, 13(2), 161-175
Tsai, P. (1994). Determinants of Foreign Direct Investment and Its Impact
on Economic Growth. Journal of Economic Development, 19(1),
137-163.
Jun, K. & Singh, H. (1999). Some New Evidence on Determinants of
Culem, C. (1988). The Locational Determinants of Direct Investments
among Industrialized Countries. European Economic Review, 32(4),
885-904
Billington, N. (n.d). The location of foreign direct investment: an empirical
analysis. Applied Economics, 31(1), 65-76
Lim, D. (1983). Fiscal incentives and direct foreign investment in less
de-veloped countries. Journal of Development Studies, 19(2), 207-212
Scaperlanda, A., & Mauer, L. (1969). The determinants of US direct
in-vestment in the EEC. American economic review, 558-568.
Blonigen, B. (2005). A Review of the Empirical Literature on FDI
determi-nants. Atlantic Economic Journal, 33(4), 383-403
Hartman, D. (1984). Tax policy and foreign direct investment in the
Unit-ed States. National Tax Journal, 37(4), 475-487
Carstensen, K., & Toubal, F. (n.d). Foreign direct investment in Central
and Eastern European countries: a dynamic panel analysis. Journal of
Comparative Economics, 32(1), 3.
Wheeler, D., & Mody, A. (1992). International investment location
deci-sions – the case of U.S. firms. Journal of international economics,
33(1/2), 57-76
Erdal, F., & Tatoglu, E. (2002). Locational Determinants of Foreign Direct
Investment in An Emerging Market Economy: Evidence from Turkey.
Multinational Business Review, 10(1). 21
Bevan, A., & Estrin, S. (n.d). The determinants of foreign direct
invest-ment into Europe an transition economies, Journal of Comparative
Eco-nomics, 32(4), 775-787
Sun, Q., Tong, W., & Yu, Q. (2002). Determinants of Foreign Direct
In-vestment across China, Journal of International Business Review, 40(3),
279-314.
Janicki, H., & Wunnava, P. (2004). Determinants of foreign direct
invest-ment: empirical evidence from EU accession candidates. Applied
eco-nomics, 36(5), 505-509.
Deichmann, J., Karidis, S., & Sayek, S.(2003). Foreign direct investment
ECLAC (1998). Foreign Investment in Latin America and the Caribbean
ECLAC, Santiago, Chile
Froot, K., & Stein, J. (1991). Exchange rates and Foreign Direct
Invest-ment: An Imperfect capital markets approach. Quarterly Journal of
Eco-nomics, 106(4), 1191-1217.
Mello, J. (1997). Foreign direct investment in developing countries and
growth: a selective survey. Journal of development studies, 34(1), 1-34
Ramirez, M. (2006). Economic and Institutional Determinants of Foreign
Direct Investment In Chile: A Time-Series analysis, 1960-2001.
Contem-porary Economic Policy. 24(3), 459-471.
Rodriguez, X., & Pallas, J. (2008). Determinants of foreign direct
invest-ment in Spain. Applied economics, 40(19), 2443-2450
Guimaraes, P., Figueirdo, O., & Woodward, D. (2003). A Tractable
Ap-proach to the Firm Location Decision Problem. Review of Economics and
Statistics, 85(1), 201-204.
Kok, R., & Ersoy, B. (2009). Analyses of FDI determinants in developing
countries. International journal of social economics, 36(1-2), 105-123.
Zhao, H., & Zhu, G. (2000). Location Factors and Country-of-Origin
Dif-ferences: An Empirical Analysis of FDI in China. Multinational Business
Review, 8(1), 60.
United Nations Human Development Report (2005), United Nations
De-velopment Program. Retrieved from
http://hdr.undp.org/en/media/HDR05_complete.pdf
Acharya, S. ( 2002 ). India's Medium-Term Growth Prospects, Economic
and Political Weekly, 37 ( 28 ), p.2897-2906
Stein, B. ( 2010 ). A history of India, 2nd. Edition, West Susses: Wiley & Blackwell. STPI Annual Report ( 2008-2009 ). Retrieved from
http://www.stpi.in/writereaddata/links/50428173332534218955annuarl1.p df.
Tayeb, M. ( 1996 ). India: a Non-Tiger of Asia, International Business
Review, 5 (5), p. 425-445.
Dossani, R. (2006). Origins and Growth of the Software Industry in India,
Asia-Pacific Research Center (p.1-46), Stanford University, Stanford
CIA world fact book (2010). Retrieved from
https://www.cia.gov/library/publications/the-world-factbook/geos/in.html. MeritTrac Pvt. Ltd. (2005). Engineering Graduate Talent Pool in India,
Research Report, Retrieved from
http://www.nasscom.in/download/Engineering_Talent_Pool_Reseach_Hi ghlights1.0.pdf
World Bank Group (2010). Literacy rates data. Retrieved from
http://data.worldbank.org/country/india.
World Bank Group (2010). FDI inflows data figure 36, retrieved from
http://data.worldbank.org/country/india
World Trade Organization, (2002). Statistical database of WTO, country
profile India, Retrieved from the
http://stat.wto.org/CountryProfile/WSDBCountryPFView.aspx?Language =E&Country=IN.
O’Neill, J. & Poddar, T. (2008). Ten Things for India to Achieve its 2050
Potential (No: 169), from:
http://www2.goldmansachs.com/ideas/brics/ten-things-doc.pdf
Kumar, N. (2005). “ Liberalisation, Foreign Direct Investment Flows and
Development: Indian Experience in the 1990s “, Economic and Political
Weekly, 40(14),p.1459-1470
Reserve Bank of India, Annual Report (2005-2006). Retrieved from
http://rbi.org.in/scripts/AnnualReportPublications.aspx?year=2005.
India Telecom (2009). Federation of India Telecom Industry, Federation
of Indian chambers of commerce & Industry (FICCI), retrieved from:
http://www.indiatelecom.org/Fact-Sheet-09.pdf
Das, A. & Ghosh, S. (2006). Financial deregulation and efficiency: An
empirical analysis of Indian banks during the post reform period, Review
of Financial Economics, 15 (3), p.193-221.
Armenakis, A., Irani, F., Mehta, A., Mehta, N. (2006). Challenges and
Opportunities of Business Process Outsourcing in India, Journal of Labor