J
Ö N K Ö P I N GI
N T E R N A T I O N A LB
U S I N E S SS
C H O O L JÖNKÖPING UNIVERSITYPhilanthropy contributions
A s t u d y o f t h e u n d e r l y i n g f a c t o r s
Master Thesis within Economics Author: Jens Hagman
Tutor: Daniel Wiberg & Andreas Högberg Jönköping January 2010
Master Thesis in Economics
Title: Philanthropy contributions – A study of the relevant underlying factors. Author: Jens Hagman 841222
Tutors: Daniel Wiberg & Andreas Högberg Date: 3/9/2010
Keywords: Philanthropy donations, factors effecting philanthropy, government crowding-out, philanthropy in the emerging world.
JEL Code: I38, D61, D64
Abstract
Philanthropy has been growing at a tremendous rate in the last decades, as explained by Salamon in 1994 and 2003. This growth is not only restricted to the advanced countries but also to the emerging countries where domestic philanthropy is playing an increasingly important role. It is therefore interesting to conduct a study using data from both advanced and emerging countries. The purpose of this thesis is to compare the difference in philanthropy between advanced and emerging countries and to extract the most relevant underlying factors for private philanthropy donations; where the government crowding-out poses the most interest due to its prevalence in previous studies. The results show, as expected, that there is a significant difference between do-nations between the advanced and emerging world in both relative and absolute terms; confirm-ing that philanthropy donations is a normal or a luxury good. The regressions reveal that only two variables proved significant at the 5% level: GDP per capita and Government philanthropy. Results show that there is no government crowding-out, rather the opposite; 1 US$ donated by the gov-ernment will on average increase private donations by approximately 25 cents according to the data in this sample. A quite extraordinary result that contrast previous research. Another interest-ing result is that Religion proved to be insignificant.
Magisteruppsats inom Nationalekonomi
Title: Philanthropy contributions – A study of the relevant underlying factors. Author: Jens Hagman 841222
Tutors: Daniel Wiberg & Andreas Högberg Date: 3/9/2010
Keywords: Donationer till välgörenhet, faktorer bakom välgörenhet, statlig “crowding-out”, välgörenhet i utvecklingsländer.
JEL Code: I38, D61, D64
Sammanfattning
Välgörenhet och tillhörande aktiviteter har haft en enorm tillväxt under senare år, detta gäller inte bara i utvecklade länder utan också i utvecklingsländer där inhemsk välgörenhet spelar en allt vik-tigare roll. Det är därför intressant att skriva om detta ämne och använda data från både utveck-lade och utvecklingsländer. Syftet med denna uppsats är att jämföra skillnader i välgörenhets do-nationer, både i absoluta och relativa termer mellan utvecklade länder och utvecklingsländer samt utforska de mest relevanta underliggande faktorerna som styr människors donationer till välgö-renhet. Av dessa faktorer är statliga donationer mest intressant på grund av resultat i tidigare stu-dier som visar att de tenderar att tränga ut privata donationer. Som förväntat var det skillnader mellan utvecklade och utvecklingsländer både i relativa och absoluta termer vilket bekräftar att donationer till välgörenhet är en normal eller en lyx produkt. Regressionerna påvisar att endast två variabler är signifikanta; BNP per capita och Statliga donationer. Varav den sistnämnda visade sig ha ett positivt förhållande med privata donationer, i kontrast med tidigare studier. 1 US$ ök-ning i statliga donationer ökar private donationer med i snitt cirka 25 cents. Ett annat intressant resultat är det faktum att variabeln Religion inte visade sig vara signifikant.
Table of Contents
1 INTRODUCTION 4 1.1 PROBLEM 5 1.2 PURPOSE 5 1.3 OUTLINE 5 1.4 METHOD 6 2 BACKGROUND 6 2.1 PREVIOUS RESEARCH 73 THEORY AND MACROECONOMIC VARIABLES 8
3.1 EMERGING AND ADVANCED ECONOMIES 8
3.2 PRIVATE PHILANTHROPY 9 3.3 GOVERNMENT PHILANTHROPY 9 3.4 GDP PER CAPITA 9 3.5 OPENNESS 10 3.6 DEMOCRACY 10 3.7 RELIGION 10 3.8 CORRUPTION 10 3.9 ETHNIC FRACTIONALIZATION 11 3.10 LITERACY RATE 11 3.11 ECONOMY DUMMY 11 3.12 VARIABLES 12 4 4. DESCRIPTIVE STATISTICS 13
5 ESTIMATION METHOD AND RESULTS 15
5.1 STATISTICAL TESTING 16
5.2 JOINT HYPOTHESIS TESTING 19
5.3 MODIFIED JOINT HYPOTHESIS TESTING 20
6 CONCLUSION 23 7 REFERENCES 24 Tables Table 1: 7 Table 2: 8 Table 3: 8 Table 4: 13 Table 6: 14 Table 7: 15 Table 8: 16 Table 9: 18 Table 10: 19
1 Introduction
“We are in the midst of a global “associational revolution” that may prove to be as significant to the latter twenti-eth century as the rise of the nation state was to the latter nineteenth”. Salamon p.1 (1994).
If that bold statement proves to be correct remains to be answered, what is nevertheless clear is the rise in charity, non-profit and private organizations that work on a primary non-commercial basis have grown tremendously in recent years, as explained in Salamon et al (2003). For the pur-pose of this study will I define these “Civil Society” organizations in similarity to Salamon et al (2003) as; private in character and not part of the government apparatus, with a clear purpose of serving some public or community function without the aim to simply just generate profits for the involved actors.
The growth in civil society is not constrained to just advanced economies but it is also expanding in emerging economies where civil society organizations in various fields are created at a tremen-dous rate, according to Salamon (1994). Traditionally have emerging countries played a marginal-ized role for civil society organizations, as Salamon et al p.43 (2003) expresses it:
”With historically small urban middle class populations and large numbers of marginalized rural poor, these coun-tries have not historically provided a fertile soil for the growth of civil society institutions.”
However are there signs that this is starting to change; more than half of the world’s population is now considered to be middle class, according to Bhalla (2007). Middle class in this context re-fers to the increased relative living condition in a country and does not refer to absolute income. The rise of the middle class in predominantly developing countries has to a certain extent eased the demand for charity activates, mostly from the developed world, as poor become middle class. The middle class swell have also developed into an unprecedented surge in domestic charity in the developing world, donations from the new middle class have hence to some extent substi-tuted or complemented the traditional advanced-emerging charity flow.
The traditional donation flow is from the advanced world to the emerging world, but recent events and developments have started to change this, as explained above. Donations within ad-vanced countries have gained in importance, the same patterns of increased domestic charity can also be seen in emerging countries. Where on example is the domestic surge in charity donations in China during the earthquake tragedy in May 2008. It is clear that donation patterns is becom-ing ever more complex and dynamic, givbecom-ing reasons to question traditional models of charity flows.
The dominant revenue source for civil society is fees, which accounts for roughly 53 per cent of income, Salamon et al (2003). Fees are nevertheless a complicated source of revenue, as Weis-brod (1998) express it;
”Donations are important for nonprofit organizations because the collective good nature of much of their output limits user fees as a source of revenue”.
Furthermore, the government plays an important role in supporting philanthropy activities. Gov-ernments have come to realize the important societal functions that charity organizations play and hence the need to provide funds for these functions. Previous research such as Schiff (1985) have discussed if government donations tend to crowd-out private donations, the results are mixed.
I will seek to understand the most important factors for the vital donations to charity, or as it is expressed in this paper; philanthropy donations. Research in this area have been scarce and have mostly focused on either donations at an organization level or the responding effect of donations to the receiving country. Few studies have focused on the factors that affect private philanthropy,
these studies have used American or United Kingdom data and focused on government crowd-ing-out, see previous research section. I aim to take the discussion on the subject further by in-cluding data from emerging countries and inin-cluding several other variables, presenting results that could prove useful to organizations and governments alike.
1.1 Problem
The rise of globalization has lead to restructuring and new priorities for the non-profit world. Charity organizations have been forced to reconsider its traditional approach of flows from ad-vanced to emerging economies. The economic surge and poverty reduction in the developing world have created a decreased need for donor reception but also new opportunities for new sources of donations.
Few studies have been conducted in where comparisons are made between the relative (in rela-tion to GDP) importance of charity donarela-tions from emerging countries versus advanced coun-tries. I therefore intent to test the relative as well as the absolute importance of charity donations from the emerging world, in comparison to the advanced world. However will the study pre-dominantly focus on finding the most powerful variables that affect Private Philanthropy, in simi-larities with studies on government crowding-out. In order for any given charity organization to make rational investment decisions they should posses as complete information as possible; what factors are the most important for philanthropy and how important is the difference between ad-vanced and emerging economies.
I will therefore address the following research questions:
• What variables have the largest significance for philanthropy donations? • Does government philanthropy crowd-out private philanthropy?
• How great is the difference in terms of philanthropy donations between advanced and emerging economies?
• What value does this information pose to philanthropy organizations and governments?
1.2 Purpose
The purpose of this thesis is to describe the difference in donation between the advanced and emerging world respectively, and investigate which variables that are most important for private philanthropy donations.
1.3 Outline
Section 1 has given a general overview of the topic of Philanthropy. This section has also pro-vided the reader with the problem and my research questions. Section 2 will further elaborate on the historical background as well as previous studies within the philanthropy field. In section 3 will I explain the theory and the variables used in this study. Section 4 will provide the reader with an overview of the descriptive statistics, illustrating not only the nature of the variables but also the differences between emerging and advanced countries. Section 5 is devoted to the re-gression models and the consequent results. Section 6 will give the concluding remarks.
1.4 Method
This study was conducted by gathering data for 34 countries; 17 advanced and 17 emerging economies.
I used OLS regression analysis to evaluate the secondary date gathered from 34 countries from the World Bank, John Hopkins University, Transparency International, Alesina et al, and Free-dom House. From the regression will I extract the relative importance of each variable and evalu-ate its statistical significance. The variables in it selves will also be used in order to enhance the analysis and illustrate the relative difference between the countries and in an easily understandable way exemplify the underlying conditions for philanthropy. Previous research, articles, publica-tions and current magazines have also been studied to increase my understanding of the topic and to provide a more relevant background.
2 Background
“According to Greek mythology mankind’s first benefactor was the Titan, Promentheus, who gave fire, previously the exclusive possession of the gods, to mortal man. For this act Zeus condemned Prometheus to be bound to a mountain peak. Prometheus’s captors tell him his punishment is the reward of philanthropos.” Bremner p.3
(1994).
The statement above reflects the early history of the concept of philanthropy and the stigma at-tached with it. Non-profit and other forms of organized voluntary activities have seen an un-precedented surge in the eye of the public in recent years but it’s important to acknowledge the sector’s deep historical roots in essentially all parts of the world. According to Salamon (1994) did non-profit activities exist in China during the antiquity and was further enforced and institutional-ized under Buddism in the 18th century. Charity activities were present in Europe as early as the ancient Greece and during the Roman Empire, according to Bremner (1994). He further explain one vital difference between historical philanthropy where focus was predominantly towards giv-ing to beggars and feedgiv-ing hungry mouths in contrast with the modern version where philan-thropy covers a much wider spectrum such as welfare enhancing activities such as running hospi-tals and drug rehabilitation.
Another key finding from Bremner (1994) is the fact that several significant historical texts reveal that philanthropy could have been pursued for selfish reasons; the Koran ordered: “Spend in charity for you own good”, and the ancient Greeks donated since they feared that “a beggar could reveal himself as an angry God in disguise”. This is merely two examples of the stigma at-tached with philanthropy throughout history.
Religion has also had a strong influence over philanthropy; religious morals and values tend to endorse helping the needy. This holds true for all the major religions, such as Christianity and Is-lam. Historical religious texts such as the Bible and the Koran praise the importance of charity. Religion has consequently played a major part for the development of philanthropy throughout history, where religious related charities have, and still do play a major role in the world of philan-thropy.
Philanthropy also has a history of booms during times of hardship, where one excellent example is during World War I where private philanthropy played a major role in domestic and interna-tional civil society. One early and perhaps the most dramatic example took place in the outbreak of the war when the Commission for the relief of Belgium (C.R.B) was established as a joint ef-fort between private and government philanthropy to ease the burden on the Belgian people,
ac-cording to Dickinson (1970). Interesting to note is that the C.R.B is one of the early examples of dual financing; private and government philanthropy, which often constitute the model of today. This co-operation continued during World War II even though government donations towards civil and military purposes overshadowed the donations provided for by private donors. The rele-vance of government philanthropy have continued to present itself during modern times, where government donations in some cases are larger compared to private.
2.1 Previous research
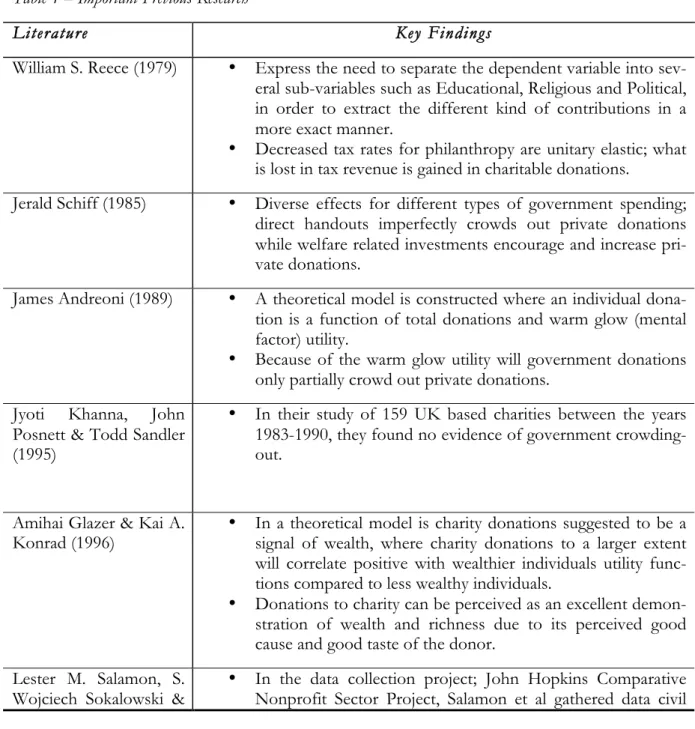
Previous studies have mainly focused on the crowding-out of government involvement or dona-tion behavior at an individual level where income and price elasticity have played a major role. Common patterns from previous research: Inelastic crowding-out of government philanthropy, positive relationship between income and private philanthropy, and significant differences be-tween donation patterns across nations. Table 1 is constructed in order to make the previous re-search section more comprehensive for the reader.
Table 1 – Important Previous Research
Literature Key Findings
William S. Reece (1979) • Express the need to separate the dependent variable into sev-eral sub-variables such as Educational, Religious and Political, in order to extract the different kind of contributions in a more exact manner.
• Decreased tax rates for philanthropy are unitary elastic; what is lost in tax revenue is gained in charitable donations.
Jerald Schiff (1985) • Diverse effects for different types of government spending; direct handouts imperfectly crowds out private donations while welfare related investments encourage and increase pri-vate donations.
James Andreoni (1989) • A theoretical model is constructed where an individual dona-tion is a funcdona-tion of total donadona-tions and warm glow (mental factor) utility.
• Because of the warm glow utility will government donations only partially crowd out private donations.
Jyoti Khanna, John Posnett & Todd Sandler (1995)
• In their study of 159 UK based charities between the years 1983-1990, they found no evidence of government crowding-out.
Amihai Glazer & Kai A.
Konrad (1996) • In a theoretical model is charity donations suggested to be a signal of wealth, where charity donations to a larger extent will correlate positive with wealthier individuals utility func-tions compared to less wealthy individuals.
• Donations to charity can be perceived as an excellent demon-stration of wealth and richness due to its perceived good cause and good taste of the donor.
Lester M. Salamon, S.
Regina List (2003) sector data from 34 countries, 17 advanced economies and 17 emerging economies.
• Great differences can be seen not just in terms of income and donations but also in social structure and culture.
• Civil society is a major social and economic force in countries throughout the world at present time.
3 Theory and Macroeconomic Variables
3.1 Emerging and advanced economies
I will use the definition provided by the IMF, which divides the world in two major groups; emerging economies, and advanced economies. The classification is heavily based on the econ-omy but nevertheless does the IMF declare the classifications have progressed over time and other relevant data have also been used in order to get the most coherent results. The following table shows IMF’s classification for the countries in this study. These countries are chosen since they proved to be the only countries with available date for Private and Government Philan-thropy, as provided by Salamon (2003).
Table 2 – Level of economic development
Emerging Economies Advanced Economies
Argentina Peru Australia Japan
Brazil Philippines Austria Netherlands
Colombia Poland Belgium Norway
Czech Republic Romania Finland South Korea
Hungary Slovakia France Spain
India South Africa Germany Sweden
Kenya Mexico Pakistan Tanzania Uganda Ireland Israel Italy United Kingdom United States Salamon (2003)
3.2 Private philanthropy
Private philanthropy represents the total value of contributions including volunteer work con-ducted by private individuals and companies to the civil sector, expressed in current US Dollars. Private philanthropy constitutes the dependent variable in this study and independent variables will be tested in order to analyze the most significant variables for private philanthropy dona-tions. Private philanthropy has in previous studies shown to play a significant part in the growth and existence of civil society such as in Salamon et al (2003).
Data was collected from Salamon et al (2003), which was gathered with the help of local associate in each country in order to comprehend local conditions and correct for such in the dataset by the research team. The data in itself was gathered through multiple methods such as interviews, government records, and through the help of civil society organizations.
3.3 Government philanthropy
Government philanthropy represents the total value of contributions made by the government to the civil sector, expressed in current US Dollars. Even though the private civil sector per defini-tion is outside the sphere of the government sector does a significant part of its revenues come from government donations or grants, as provided by Salamon et al (2003). The increasing reach of the civil sector has been recognized by governments as a vital assistance to carry out public functions, which is one of the reasons why governments provide resources to the civil sector. One of the general conclusions of the Salamon et al (2003) paper is that government donations accounted for a larger overall share of civil sector financing compared to private philanthropy. In similarity with private philanthropy did Salamon et al (2003) collected empirical data with the help of local associate in each country in order to comprehend local conditions and correct for such in the dataset. The data in itself was gathered through multiple methods such as interviews, government records, and through the help of civil society organizations.
Theoretical studies such as Andreoni (1989) have argued that government financing will to some extent “crowd-out” private philanthropy. All else equal; if government donations increase will lead to private donations will fall since donors treat the two as substitutes. Andreoni (1989) fur-ther argues that government and private philanthropy are imperfect substitutes and that consum-ers receive incremental utility by donating privately, the “warm-glow effect”.
Nevertheless, do I also acknowledge intuitively that government philanthropy can be positively correlated with private philanthropy since it can reflect and promote the overall awareness of the civil sector in a society, such as in drug rehabilitation for example. As expressed by Schiff (1985) in where he conclude that some types of government spending such as cash transfers to the needy may crowd-out private philanthropy, but other types of spending such as social services may actually encourage private philanthropy. Schiff (1985) also argues that government philan-thropy may encourage entry in the charity sector which in turn leads to more competition and more choice for the private contributors, all else equal; leading to higher rates of private philan-thropy.
3.4 GDP per capita
GDP per capita represents the market value of goods and services produced by labor and prop-erty in the given country, regardless of nationality and divided by the population, according to the Bureau of Economic Analysis (2007). GDP per capita is important since it reflects the amount of available income that an average individual can allocate on goods and services, private
philan-thropy included. GDP per capita is therefore important to add to the model since it represents the financial capabilities of each nation and hence its boundaries of donations to civil society. In the empirical model constructed by Schiff (1985) GDP was included. Schiff (1985) concluded that charity donations are a normal good and that income elasticity is positively inelastic. In the theoretical model suggested by Glazer & Konrad (1996) would private philanthropy grow expo-nentially as income increases since wealthier individuals use charity as a means of demonstrating their wealth. I therefore expects a positive correlation between GDP per capita and private phi-lanthropy; higher income should equal higher levels of private philanthropy.
3.5 Openness
Openness in this context refers to imports plus exports as a percentage of GDP in order to illus-trate openness towards trade. The openness variable has previously been used in various papers where charity has been discussed. Previous studies such as Alesina and Dollar (1998) have con-cluded that trade and aid have a positive relationship. In this study will the openness variable be used in a reversed fashion where it will be tested against donations instead of aid recipients. I expect openness to have a positive effect towards private philanthropy since a large trade, as a percentage of GDP should mean that the general population is more receptive to influence from the outside world and consequently have a higher tendency in responding to issues in the global community.
3.6 Democracy
Democracy is expressed in an index from Freedom House where political rights and civil rights are added together to construct a 2-14 graded scale; where 2 equals the most free and 14 is the least free. I include the variable in order to illustrate its significance for individual donor behavior. A free and democratic society, all else equal should provide for greater diversity, transparency and competition within its civil sector. Which in a market environment would increase donations. I therefore expect political rights and civil liberties when using this index will have a negative corre-lation in respect to private philanthropy, meaning that the less free a society is in terms of politi-cal and civil rights and liberties the less will be donated through private philanthropy.
3.7 Religion
Identifies the percentage of the population in each country that belonged to each of the three most widely spread religions in the world according to CIA (2003); Catholic, Protestant and Islam. The residual is called “other religions”. Religion has throughout history influenced civil society and is likely to be of importance in the current context. For example does many churches to this day take 10% of its member’s income as a charitable contribution. Data are collected from the 2002 CIA World Factbook. The religion variable will test the importance of each of the three world religions as well as the residual for philanthropy donations. I expect all three religions to have a positive correlation on private philanthropy. The residual or other variable is hard to pre-dict due to its dispersed set of religions, beliefs and non-beliefs.
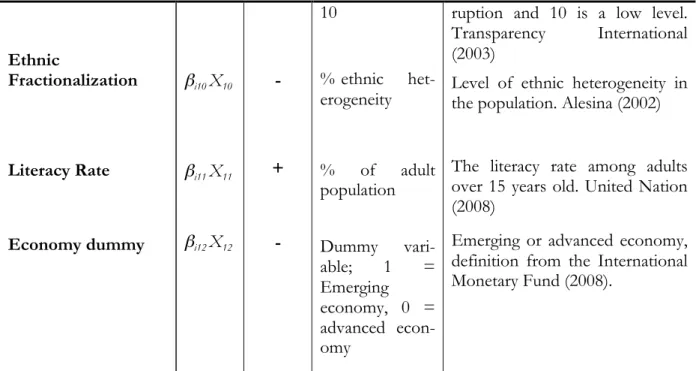
3.8 Corruption
Corruption have the potential to play a significant role for philanthropy donations, all else equal, high level of corruption means that people will have small trust in the economic system and therefore restrained from giving to charity. Corruption data have been extracted from Transpar-ency International and is graded on a 1-10 scale, where 1 represents a high level of corruption and 10 a low level. Corruption have previously been shown to have a depressing effect on eco-nomic growth as express in Mauro (1995), I believe that corruption will have a similar effect on
private philanthropy. Since private philanthropy is conducted on an active and voluntary basis will individuals demand a guarantee that the contribution will be well spent, which is hard to con-trol in a very corrupt society. Hence will I expect a positive correlation between corruption and private philanthropy due to the nature of this index; meaning that the less corrupt a society is the higher the private philanthropy rate will be.
3.9 Ethnic fractionalization
Ethnic fractionalization has in numerous studies shown to have a significant inverse effect on economic performance and hence per capita GDP as explained in Alesia et al (2002). Ethnic frac-tionalization in this context refers to the level of ethnic heterogeneity in an individual country. Data was collected from Alesina et al (2002), and represents data from a dispersed set of years. I will nevertheless chooses to include the variable in the regression since the level of ethnic frac-tionalization is likely to remain stable over a shorter time span.
I expect that ethnic fractionalization will have a negative effect towards private philanthropy since ethnic fractionalized societies tend to have a high degree of social unrest which provides ground for more immediate issues than philanthropy. One other restrictor is that ethnic fraction-alized societies tend to have multiple languages and cultures, which make joint and nationwide marketing campaigns difficult and expensive for charity organizations.
3.10 Literacy rate
In order to verify the role of education role in private philanthropy will literacy rate (adults over 15 years) be included, literacy rate is in this cased used as a proxy for education level. All else equal will a level of education translate to the literacy rate. Since the quality of the educational system across nations is difficult to estimate will literacy rate be used as a general estimate of the level of human capital for each country. Data have been collected from the United Nations. I be-lieve that literacy rate is an important variable to include since education usually leads to quicker information sharing and hence faster and more effective responses to issues within civil society. I therefore expect a positive correlation between literacy rate and private philanthropy, meaning that the more educated a people are the more responsive towards donating to charity.
3.11 Economy dummy
A dummy variable is added in the model in order to test and illustrate the effect of an each coun-try group; advanced or emerging economy. Based on the definition from the IMF are seventeen of the observations labeled as emerging economies and seventeen as advanced economies. Emerging economies are given the value of one and consequently will the model test the signifi-cance of emerging countries against private philanthropy.
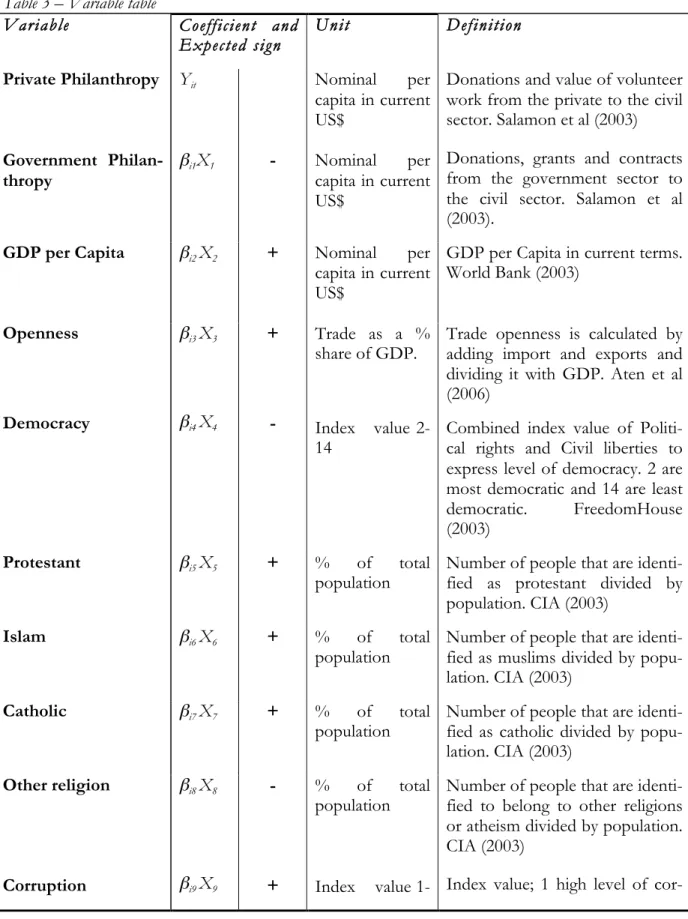
3.12 Variables
The following table gives a overview of the variables that are included in the model. Private
philan-thropy represents the dependent variable, which will be tested towards twelve independent
vari-ables. The model is constructed as a normal OLS regression due to the cross-section data ac-quired.
Table 3 – Variable table
Variable Coefficient and
Expected sign Unit Definition
Private Philanthropy Government Philan-thropy Yit βi1X1 - Nominal per capita in current US$ Nominal per capita in current US$
Donations and value of volunteer work from the private to the civil sector. Salamon et al (2003) Donations, grants and contracts from the government sector to the civil sector. Salamon et al (2003).
GDP per Capita βi2 X2 + Nominal per
capita in current US$
GDP per Capita in current terms. World Bank (2003) Openness Democracy βi3 X3 βi4 X4 + - Trade as a % share of GDP. Index value 2-14
Trade openness is calculated by adding import and exports and dividing it with GDP. Aten et al (2006)
Combined index value of Politi-cal rights and Civil liberties to express level of democracy. 2 are most democratic and 14 are least democratic. FreedomHouse (2003)
Protestant βi5 X5 + % of total
population Number of people that are identi-fied as protestant divided by population. CIA (2003)
Islam βi6 X6 + % of total
population Number of people that are identi-fied as muslims divided by popu-lation. CIA (2003)
Catholic βi7 X7 + % of total
population Number of people that are identi-fied as catholic divided by popu-lation. CIA (2003) Other religion Corruption βi8 X8 βi9 X9 - + % of total population Index value
1-Number of people that are identi-fied to belong to other religions or atheism divided by population. CIA (2003)
cor-Ethnic Fractionalization Literacy Rate Economy dummy βi10 X10 βi11 X11 βi12 X12 - + - 10 % ethnic het-erogeneity % of adult population Dummy vari-able; 1 = Emerging economy, 0 = advanced econ-omy
ruption and 10 is a low level. Transparency International (2003)
Level of ethnic heterogeneity in the population. Alesina (2002)
The literacy rate among adults over 15 years old. United Nation (2008)
Emerging or advanced economy, definition from the International Monetary Fund (2008).
4
4. Descriptive statistics
The following section of descriptive statistics is a vital first step of examining the dataset. De-scriptive statistics will reveal the distribution of the data according to variable as well as illustrate the different characteristics of the countries.
Table 4: Descriptive statistics
Variable Mean Std. Dev. Min Max Unit
Private
Philan-thropy 270.26 355.14 1 1247 Per capita in current US$
Government
Philanthropy 363.76 540.42 0.08 2210 Per capita in current US$
GDP per Capita 14134.24 12722.20 235 42321 Per capita in current
US$
Openness 69.65 39.78 21 171 EX+IM/GDP
Democracy 6.25 3.10 2 11 Index value 2-14
Protestant 7.53 26.76 0.03 89.01 % of total population
Islam 6.01 2.22 0.00 96.35 % of total population
Catholic 43.88 35.88 0.14 97.31 % of total population
Other Religion 29.91 30.39 0.37 99.00 % of total population
Ethnic
Fraction-alization 2.33 1.85 0.00 6.46 % ethnic hetrogeneity
Literacy Rate 91.15 11.34 42.07 100.00 % of adult population
Economy
Dummy 0.50 0.51 0.00 1 1=Emerging, 0=Advanced
The mean for Private Philanthropy is US$270.2647 per capita across all nations. As the mean is closer to the minimum value of US$1 than the max value of US$1247 reveals that the distribution is negatively skewed. The high maximum value indicates that there are one or several outlier countries that contribute significantly more towards Private Philanthropy than the average country. The same thing can be seen when analyzing GDP per Capita and Government Philanthropy; the mean of US$14134.34 and US$363.76 is considerably closer to the minimum than the maximum, hence are both distributions negatively skewed. Table 4 clearly shows that one or several countries are outliers in terms of higher GDP per Capita as well as Government Philanthropy.
Table 5 illustrates that there are large differences between the countries in the model. Table 5 fur-ther exemplifies these differences by clustering the countries according to their respective devel-opment group; emerging and advanced economies.
TABLE 5 Philanthropy and GDP; Emerging versus advanced economies. Level Of Economic Development Private Philanthropy Donations Per capita Government Donations Per capita Total Donations Per capita Private Philanthropy Donations Percent of GDP Government Donations Percent of GDP
Advanced US$ 518,23 US$ 659,57 US$ 1177,8 1,77 % 2,25 %
Emerging US$ 8,41 US$ 7,04 US$ 15,45 0,52 % 0,43 %
Sources: UN (2009), WB (2009), Salamon et al (2003)
Large differences can be observed in both absolute and relative terms, as seen when moving from the Advanced to the Emerging row throughout the table. Both private and government donations per capita for advanced economies dominates the corresponding figures for emerging economies. Total donations per capita are over 75 times as large in advanced economies as in emerging economies. In relation to GDP is the figure not as large, however are private donations 3.5 times as big in advanced economies as in emerging economies. Advanced economies do not just have higher GDP levels but they also give more to philanthropy. Important to note is that the differ-ence is smaller when philanthropy is calculated in GDP terms but it seems that Private Philanthropy can be classified as a luxury good.
The mean values for the religions variables in Table 4 show that the most prevailing religion in the sample is Catholic with 43.88 per cent followed by other religion at 29.91 per cent, Protestant at 18.98 per cent, and Islam at 6.83 per cent. The high standard deviations and large difference
be-tween the minimum and maximum values for all religions signify that there are large variations between the religious beliefs among countries in this particular sample.
Corruption is relatively distributed between 1.9 and 9.7 with a mean value of 5.42. The lower
num-bers predominantly reflects the emerging countries in the sample, as previous studies such as Mauro (1995) have confirmed; there is a strong negative relationship between corruption and GDP. Ethnic fractionalization is heavily dispersed between a low of 0.2 per cent for South Korea and a high of 93.02 per cent for Uganda. The mean of 91.15 per cent for Literacy Rate is closer to the maximum of 100 per cent than the minimum of 42.7 per cent, reflecting that most countries have a high degree of Literacy. The Emerging Dummy mean of 0.5 mirrors the fact that 17 coun-tries are emerging and 17 councoun-tries are advanced.
5 Estimation method and results
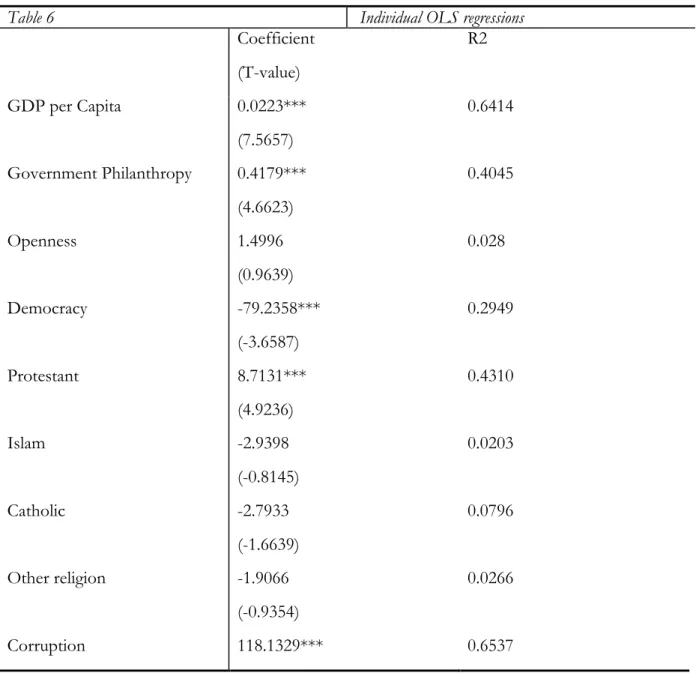
As a first step will the independent variables be regressed individually against private philan-thropy. This in order to ensure that each variable is relevant and its individual contribution to-wards private philanthropy are estimated. An OLS regression is used as an estimation method. The results are presented in table 6 below.
Table 6 Individual OLS regressions
Coefficient (T-value) R2 GDP per Capita Government Philanthropy Openness Democracy 0.0223*** (7.5657) 0.4179*** (4.6623) 1.4996 (0.9639) -79.2358*** (-3.6587) 0.6414 0.4045 0.028 0.2949 Protestant Islam 8.7131*** (4.9236) -2.9398 (-0.8145) 0.4310 0.0203 Catholic -2.7933 (-1.6639) 0.0796 Other religion -1.9066 (-0.9354) 0.0266 Corruption 118.1329*** 0.6537
(7.7729) Ethnic fractionalization -621.0645*** (-2.9819) 0.2174 Literacy rate Emerging Dummy 10.017*** (2.501) -507.24*** (-5.952) 0.1635 0.5254
Note: t-values are in parentheses. ***denotes significant at 0.01 level, **denotes significant at 0.05 level and *denotes significant at 0.10 level.
Interesting to note is the fact that four variables do not have significant T-values at the 5% sig-nificance level. Openness, Islam, Catholic and Other religions are all insignificant at an individual level. These variables will nevertheless be included in the model for analytical purposes.
The expected results discussed earlier goes closely in line with the results from the individual re-gressions. Government donations proved to have a more positive than negative effect and hence; there was no crowding-out.
5.1 Statistical testing
In the preceding step will I test the variables together in order to acknowledge the relevance of the variables combined and how well they fit into the model. The model must also be tested for autocorrelation, heteroscedasticity and multicollinearity in order to decrease bias and errors as much as possible.
Autocorrelation was tested through Durbin-Watson tests and no serious problems were discov-ered, hence can I conclude that there is no serious correlation between the error terms. Hetero-scedasticity will be tested at a later stage in connection with the joint regression. I have discov-ered some problems with multicollinearity in the model; multicollinearity means that there is cor-relation between the independent variables. Which in itself does not bias the results but it can en-force other errors such as heteroscedasticity, some problems might also occur when interpreting the independent variables. Multicollinearity can also cause the independent coefficients to appear insignificant but that in itself does not violate the properties of the BLUE (Best Linear Unbiased Estimators). A general rule of thumb is that if a correlation between two variables is below 0.8 will there be no serious problems of multicollinearity, and the regression results can be inter-preted with high confidence.
Table 7 - Correlation Matrix
PrivP Ycap GovP Open Dem Prot Islam Cath Other Corr Ethnic Lit Private Philanthropy 1 GDP per Capita 0.80 1 Government Philan-thropy 0.64 0.65 1 Openness 0.17 0.19 0.43 1 Democracy -0.54 -0.70 -0.45 -0.40 1 Protestant 0.65 0.51 0.13 -0.04 -0.23 1 Islam -0.14 -0.26 -0.10 -0.23 0.62 -0.14 1 Catholic -0.28 -0.20 -0.11 0.15 -0.04 -0.47 -0.28 1 Other Religion -0.16 -0.07 0.07 -0.01 -0.11 -0.24 -0.11 -0.61 1 Corruption 0.81 0.89 0.64 0.19 -0.74 0.55 0.27 -0.25 -0.04 1 Ethnic Fractionaliza-tion -0.47 -0.60 -0.30 -0.29 0.72 -0.16 0.38 0.05 -0.13 -0.59 1 Literacy Rate 0.40 0.55 0.34 0.42 0.81 0.18 -0.75 0.22 0.00 0.57 -0.68 1 Economy Dummy -0.72 -0.91 -0.66 -0.14 0.66 -039 0.21 0.19 0.00 -0.88 0.60 -0.51
The variables at the top row in table 7 have been abbreviated accordingly due to space constraint; they follow the same order as the variables in the first column. Table 7 reveals that several vari-ables exceed the recommended maximum of 0.8. As predicted is the Emerging dummy highly corre-lated with GDP per capita, level of development is per definition strongly based on GDP. The cor-relation between Corruption and GDP per capita does also violate the 0.8 rule of thumb; as does the correlation between Corruption and the Emerging dummy. Political rights and Literacy rate is also proved to violate the 0.8 rule. In correcting for multicollinearity do I face several options, where obtaining additional data is the most preferable; which in this case is not possible. One other al-ternative is to omit one or several of the correlated variables in order to get significant variables in the model but running the risk of losing information. One other option is to simple acknowl-edge the existence of multicollinearity and its consequences and leave the correlated variables in the regression.
Since the correlation matrix does not display multicollinearity in a higher order, one measure that can test the higher order coefficient is the variance inflating factor (VIF) test. VIF are a scaled version of the multiple correlation coefficients of independent variables against the other inde-pendent variables. I wish to test the variables that were shown to violate the guidelines of the correlation matrix; Corruption, Democracy, GDP per capita and the Emerging dummy. A general rule of thumb that is described in O’brien (2007) is that if the VIF value is greater than 10 there is reason to suspect severe multicollinearity. The results are presented below.
Table 8 – Variance Inflating Factors Variables VIF-value Corruption 12.90 Democracy 8.61 GDP per Capita 9.44 Emerging dummy 9.54
Table 8 illustrates higher order multicollinearity based on the VIF test, the table indicates that that Corruption violates the rule of thumb that of VIF>10. Hence, Corruption is to a large degree explained by the other independent variables in the model. Corruption violates both the correlation matrix and the VIF test. Since there is no explicit theory that demands that Corruption should be included in the model, Corruption will therefore be omitted from the model. This measure is nec-essary in order to decrease the likelihood of faulty insignificant variables in the joint regression.
Democracy, GDP per capita and the Emerging dummy does violate the correlation matrix but not the
VIF test. Since multicollinearity does not violate BLUE and the variables will be of importance for the analysis will they not be omitted from the model.
The existence of econometric methods and models that claim to deal with multicollinearity have been recognized and taken into consideration. However do I choose not to include such models due to a statistical mismatch; these methods such as the Ridge Regression is typically applicable in time series models, this is a cross-section model. Other models such as the MMEL estimator de-veloped by Mishra (2004) involve experimental statistical methods that not yet have been vali-dated. However, do I admit the existence of multicollinearity and will analyze the model accord-ingly.
5.2 Joint hypothesis testing
A joint regression is constructed with eleven independent variables that will be tested in a joint fashion against the dependent variable and hence measure each variables effect on Private
Philan-thropy.
The following OLS model is based on the results from the individual regression as well as the correction for multicollinearity.
Private philanthropyit = β0 + β1GDP per capita + β2Government philanthropy + β3Openness + β4Democracy + β5Protestant + β6Islam + β7Catholic + β8Other religion + β9Ethnic fractionalization + β10Literacy rate + β11Emerging Dummy + µ Null Hypothesis: β1 = … = β11 = 0
Alternative Hypothesis: β1 ≠ … ≠ β11 ≠ 0
Table 9 – Joint OLS regression for Private Philanthropy
Variable Coefficient T-value P-value
GDP per Capita 0.0029 0.3918 0.6990 β = 0 Government philanthropy 0.3476*** 3.5295 0.0019 Openness -0.7725 -0.6850 0.5005 β = 0 Democracy -27.1711 -0.9280 0.3635 β = 0 Protestant 198.0402 1.2716 0.2168 β = 0 Islam 192.5638 1.2534 0.2233 β = 0 Catholic 191.3123 1.2343 0.2316 β = 0 Other religion 189.6341 1.2221 0.2345 β = 0 Ethnic Fractionalization -352.7649 -1.5929 0.1254 β = 0 Literacy rate -1.8443 -0.3455 0.7330 β = 0 Emerging Dummy 121.8101 0.7444 0.4645 β = 0 F-Stat 10.3562 R2 0.8381
***denotes significant at 0.01 level, **denotes significant at 0.05 level and *denotes significant at 0.10 level.
Equipped with the information in Table 8 can I reject the null hypothesis; there is a relation-ship between Private Philanthropy and the model. This can be seen by an F-stat higher than the ta-ble value of 2.750 (DF= 10, 23) at the 5% level. This can also be verified at an individual level where Government Philanthropy is significant at both the 5% and the 1% level. However, Government
Philanthropy is the only variable that is significant in the model, this is in sharp contrast with the
individual regressions where seven out of eleven independent variables proved to be significant at the 5% and the 1% significant level. As discussed in section 4.1 could the insignificant results re-late to the existence of multicollinearity. Further evidence that some of the other variables are important for the model can be seen when comparing the individual R2 value of 0.4045 for
Gov-ernment Philanthropy with the overall R2 value of 0.8381. Government Philanthropy nevertheless has a positive correlation with Private Philanthropy, indicating that a 1US$ increase in Government
Philan-thropy will yield an approximate increase of 34.76 cents in Private PhilanPhilan-thropy.
5.3 Modified joint hypothesis testing
For explicatory purposes will a second model be constructed, in which the most correlated vari-ables have been omitted. The argument goes as follows; varivari-ables that are highly correlated with in this case GDP per Capita and Government Philanthropy is reflected in the model since these two variables are included. Hence do I correct for multicollinearity more aggressively and restrict the model to six independent variables. The limitation of variables goes closely in line with Schiff (1985) where merely four independent variables where included in the model; including GDP and Government donations. I argues that these variables are of great significance to the model and hence will they be included. The four religious variables; Protestant, Islam, Catholic and Other religion have also been included in order show verify its previous insignificance. The religious variables are also not significantly correlated with GDP per Capita and Government Philanthropy as can be seen in Table 7.
Private philanthropy = β0 + β1GDP per capita + β2Government philanthropy + β3Protestant + β4Islam + β5Catholic + β6Other religion + µ
Null Hypothesis: β1 = … = β6 = 0 Alternative Hypothesis: β1 ≠ … ≠ β6 ≠ 0
Table 10 – Modified Joint OLS regression for Private Philanthropy
Variable Coefficient T-value P-value
GDP per Capita 0.0087** 2.0768 0.0475 Government philanthropy 0.2486*** 3.0647 0.0049 Protestant 134.3419 1.0891 0.2857 β = 0 Islam 128.6958 1.0513 0.3024 β = 0 Catholic 128.6219 1.0442 0.3053 β = 0 Other religion 127.7013 1.0392 0.3078 β = 0 F-stat 17.7994 R2 0.7982
***denotes significant at 0.01 level, **denotes significant at 0.05 level and *denotes significant at 0.10 level.
In the restricted joint hypothesis testing do two of the independent variables have significant T-values: GDP per Capita and Government Philanthropy. That combined with a significant F-stat of 17.7994 makes me to reject the null hypothesis; there is a relationship between Private
Philan-thropy and the model. Only a slightly lower R2 value of 0.7982 compared 0.8381 makes me be-lieve that only a small degree of relevance was lost in the modified model compared to the origi-nal model. GDP per Capita has a positive correlation with Private Philanthropy, as expected. On av-erage does a 1US$ increase in GDP lead to a 0.008739 US$ increase in Private Philanthropy. A simi-lar relationship can be seen between Government Philanthropy and Private Philanthropy, where on av-erage does a 1US$ increase in Government Philanthropy increase spending on Private Philanthropy with 0.2486US$.
The factors that influence Private Philanthropy have been tested with individual OLS regressions, joint OLS regressions and a restricted joint OLS regression. I believes that the latter restricted joint OLS model is the most relevant statistical model due to its higher overall significance as in-dicated by a higher F-stat. Consequently will I focus the analysis on the result from the restricted OLS regression. However will the results from the other regressions be commented, analyzed and also be used as a reference point for further analysis.
GDP per Capita was significant at the 5% level and showed a positive correlation towards Private Philanthropy. The results indicate that as income goes up so does donations to charity, and that the
poorer a country is, all else equal; the lower the rates of private donations. The relative low rate of correlation; approximately 1 US cent per every US$ increase indicates that on average does people in the countries of this study not priorities donations to charity. In fact is 99.991261US$ out of every 100US$ incremental income spent on other goods than charity. Intuitively would one expect this to be lower in the emerging economies and higher in the advanced economies, as table 5 to some extent illustrates.
Government Philanthropy was significant at the 1% level and also showed a positive correlation
to-wards Private Philanthropy. That result is opposed to several previous studies where government donations have been shown to crowd out private donations to charity. With the exception of Schiff (1985) in where he argues that some types of government spending such that are aimed at welfare enhancing activities might have a positive effect on private donations. I believe that such expenditures are highly prevalent in the countries of this study, based on the findings of Salamon et al (2003) where they pointed out several countries in where spending on healthcare and other welfare activities where common. Based on the regressions, where Government Philanthropy was significant in all three it is clear that the variable have the strongest significance and correlation of all the variables in this study. In the restricted joint OLS did Government Philanthropy correlate with the dependent variable to the degree of 0.2486, meaning that for one US$ increase in government donations does private donations increase with 24.86 cents. Probably due to the welfare effect earlier discussed but I also acknowledge the historical patterns of cooperation between private and government philanthropy, as discussed by Dickinson (1970). On further potential implication of this is that Government Philanthropy has a larger positive effect in emerging economies compared to in advanced economies. This interpretation can be intuitively being drawn due to the fact that all previous studies have been from advanced country data. Cooperation per definition means that both parties contributes and hence and increase in Government Philanthropy will trigger an in-crease in Private Philanthropy.
The religious variables; Protestant, Islam, Catholic and Other religions all proved to be insignificant at the 5% level. As all except the Protestant variable proved to be insignificant in the individual re-gression was this result expected. That makes me conclude that religion is not a determining fac-tor for Private Philanthropy, meaning that different religious beliefs does not explain the variance in
The following variables are analyzed in the context of the individual regressions and the joint OLS regression.
The Openness variable proved to be insignificant in both the individual regression as well as in the Joint OLS regression. Openness is hence rejected to influence the variance in Private Philanthropy; trade as a percentage of GDP is not relevant for private donations decisions. This makes intui-tively sense when analyzing a country like the United States with relative low Openness but a high level of Private Philanthropy.
Democracy was held as significant in the individual regressions but proved insignificant in the Joint
OLS regression. At an individual level did Democracy. Which could be due to multicollinearity problems; previous studies have also confirmed the close link between Democracy and GDP per
Capita. Based on this knowledge do I believe that an relationship exist between Democracy and Pri-vate Philanthropy but this relationship is captured in the latter model by the inclusion of GDP per Capita.
Ethnic fractionalization was in similarity to Democracy significant in the individual regression but not
in the Joint OLS regression. The expected negative correlation was also verified in the individual regressions, meaning that as the level of Ethnic fractionalization increases the amount of Private
Phi-lanthropy decreases. Due to the significant results in the individual regressions is it therefore hard
to fully reject that the level of ethnic heterogeneity plays a role in the model. I nevertheless chooses to discard Ethnic fractionalization as relevant; meaning that Ethnic fractionalization has little or no effect on the variance of Private Philanthropy in the model.
Literacy rate was significant at the 5% level in the individual regression and as expected was the
correlation positive with Private Philanthropy; an increase in people’s ability to read increases the amount of people that donate to charity. However did not Literacy rate prove significant in the joint OLS regression and I can therefore reject that Literacy rate affects the variance of Private
Phi-lanthropy among countries. One further indication of this is the small standard deviation as
de-scribed by table 4, revealing that there is small differences among the countries in contrast to the standard deviation of Private Philanthropy.
Emerging dummy proved significant in the individual regression in which it also confirmed the
ex-pected negative correlation; the fact that a country is classed as an emerging country prove to de-crease Private Philanthropy with US$ 507.24. Nonetheless did not this significance hold in the Joint OLS regression in where Emerging dummy was insignificant, possible due to multicollinearity. I be-lieve that the level of development or the more commonly used GDP is of great importance for
Private Philanthropy, hence do I conclude that GDP per Capita is a sufficient measurement for
de-termining if the level of development determines the variance in Private Philanthropy between countries. Hence do I conclude that the level of development is positively correlated with Private
Philanthropy; the higher the income the more private donations, but this conclusion can as easily
6 Conclusion
I can conclude that there is a difference in the patterns of philanthropy donations among the countries research in this study. A significant difference can be seen not only in absolute terms but also in relative terms considering GDP and population, confirming philanthropy’s position as a normal or a luxury good. Some interesting result appear from this study:
- Government philanthropy was not crowding-out private philanthropy. - Religion did not prove significant at an aggregate level.
The fact that Government Philanthropy proved to be positively correlated with Private Philanthropy is an interesting discovery. Previous studies such as Schiff (1985) has proved this on data only re-flecting welfare enhancing activities such as building hospitals, in this study did the data reflect both cash transfers and welfare enhancing activities. Further studies are needed to prove this valid, in the case of proven validity could this have widespread implications. Government policies can be directed towards enforcing the civil sectors to substitute some traditional government functions, the dual-financing model between government and private actors as indicated could reallocate significant government resources into sectors where private actors have little or no in-terest. The obvious suggestion for charity organizations if this result holds valid is to lobby the government in order to promote private donations in a sequential step.
Religion was not significant at the aggregate level, a somewhat surprising result that could indicate
that previously views on religious effects on charity can be proven faulty or overexadurated. In similarity with the interesting results in terms of Government Philanthropy are more studies needed in order to test the validity of religious insignificance. Does other factor to a larger extent now compared to the past drive people’s willingness to donate to charity? I acknowledges that the re-sults in this study are given from an aggregate level and hence does not consider people’s individ-ual donation decisions; it does for example not specify where people donate their money.
To sum up this thesis and address the research questions; large differences can be seen in terms of philanthropy among advanced and emerging economies in both absolute and relative terms. Severe problems existed in the model due to lack of previous research and data. That resulted in several statistical tribulations, which needed to be solved by omitting variables.
I suggest that studies should be conducted to further investigate the relationship between
Govern-ment Philanthropy and Private Philanthropy. GovernGovern-ments and charity organizations alike would be
interested in the results of that type of study. A joint study financed by the government and/or the charity industry conducted by academia could be an excellent assignment for a PhD thesis or other advanced levels studies.
7
References
Literature
Alesina, A., Devleeschauwer, A., Easterly, W., Kurlat, S. & Wacziarg, R. (2003), Fractionalization, Journal of economic growth [1381-4338] vol: 8 iss: 2 pg: 155
Alesina, A. & Dollar, D. (1998), Who gives aid to whom and why?, Working paper 6612, National Bu-reau of Economic Research
Andreoni, James., (1989), Giving with Impure Altruism: Applications to Charity and Ricardian
Equiva-lence, Journal of Political Economy, 1989, vol 97, no 6. P 1447
Bhalla. Surjit S. (2007), Second Among Equals: The Middle Class Kingdom of India and China, Peterson Institute for International Economics.
Bremner, Robert H, (1994), Giving: Charity and Philanthropy in History, Transaction Publishers.
Dickenson, Frank G, (1970), The Changing Position of Philanthropy in the American Economy, Elsevier Science B.V Glazer, Amihai. & Konrad, Kai A., (1996), A signaling Explanation for charity, The american
eco-nomic review; Sep 1996;86, 4; pg. 1019
Mishra, SK., (2001), Multicollinearity and Maximum Entropy Leuven Estimator, Economics bulletin
[1545-2921] Paris yr:2001 vol:3 iss:11 pg:1
Mauro, P., (1995), Corruption and Growth, The quarterly journal of economics [0033-5533], pg:681 Khanna, Jyoti., Posnett, John., & Sandler, Todd., (1995), Charity donations in the UK: New evidence
based on panel data, Journal of public economics, vol 56, issue 2, P. 257-272
O’brien. Robert M, (2007), A Caution Regarding Rules of Thumb for Variance Inflation Factors, Quality and Quantity, vol 41, number 5/October 2007, P. 673-690.
Reece. William, S, Charitable Contributions: New evidence on household behaviour, The American Eco-nomic Review, vol 69, No 1, Mar 1979, P. 142-151
Salamon, Lester M. (1994), The Rise of the Nonprofit Sector, Foreign Affairs, Vol. 74, No. 3 (July/August)
Salamon, Lester M., S. Wojciech Sokolowski, Regina List, (2003), Global Civil Society an overview, The Johns Hopkins University, Institute for Policy Studies.
Schiff, Jerald, (1985), Does Government Spending Crowd out charitable contributions? National tax jour-nal, 38,4. P.535
Warr, Peter G., (1982), Pareto Optimal Redistribution and Private Charity, Journal of public economics 19 (1982) 131-138. North-Holland Publishing Company
Weisbrod. Burton A. (1998), To Profit or Not To Profit; The Commercial Transformation of the Nonprofit Sector, Cam-bridge University Press.
Internet sources
Central Intelligence Agency (CIA), webpage, retrieved 2009-03-27 www.cia.gov
Freedom House, webpage, retrieved 2009-03-21 www.freedomhouse.org
http://www.freedomhouse.org/template.cfm?page=439
International Monetary Fund (IMF), webpage, retrieved 2009-04-03 www.imf.org
http://www.imf.org/external/pubs/ft/weo/2009/01/weodata/groups.htm#oem Nationmaster, webpage, retrieved 2009-03-27
www.nationmaster.com
http://www.nationmaster.com/cat/rel-religion
Transparency International, webpage, retrieved 2009-04-01 www.transparency.org/
http://www.transparency.org/policy_research/surveys_indices/cpi World Bank, webpage, retrieved 2009-04-05
www.worldbank.org
http://ddp-ext.worldbank.org/ext/DDPQQ/member.do?method=getMembers&userid=1&queryId=135 United Nations (UN), webpage, retrieved 2009-04-03
www.un.org