Methods for Failure Analysis Data
within Databases and Aids
Authors: Johannes Berg and Tommy Chadda Report code: MDH.IDT.FLYG.0210.2009.GN300.15HP.Av
School of Innovation, Design and Engineering
BACHELOR THESIS IN
AERONAUTICAL ENGINEERING
15 CREDITS, BASIC LEVEL 300
ABSTRACT
In an advanced avionics system, the demand of high reliability and availability is of great importance. Testability Analysis is a method of examining this. In the project RWE Tornado GE at Saab Avitronics, they use Built-In Test (BIT), for the purpose of detecting and isolating possible failures in the equipment in question. There is however the need of verification of BIT functionality. Some of the verification tests are requested by customer EADS to be simulated and demonstrated. The objective of this thesis is to understand the Testability Analysis process as well as develop a tool to assist the Testability Demonstration preparations and result recording.
SAMMANFATTNING
Kravet på hög tillförlitlighet samt tillgänglighet är av yttersta vikt inom ett avancerat avioniksystem. Testbarhetsanalys är en undersökningsmetod som man kan tillämpa. I projektet RWE Tornado GE på Saab Avitronics använder man sig av inbyggda tester – Built-In Test (BIT) – för att kunna upptäcka och isolera eventuella felmoder i en utrustning. Utöver detta vill man verifiera att BIT-funktionen faktiskt fungerar. Vissa av dessa verifieringstester måste simuleras och demonstreras i enlighet med kunden EADS begäran. Målet med examensarbetet är att förstå testbarhetsanalysprocessen samt utveckla ett verktyg för att kunna göra nödvändiga förberedelser för samt resultatinsamling under testbarhetsdemonstrationen (T-Demo).
iii Date: 15 05 2009
Carried out at: Saab Avitronics
Advisor at Mälardalen University: Odd Romell Advisor at Saab Avitronics: Niklas Båvenstrand Examiner: Olof Andersson
v
ABBREVIATIONS
BHM BIT History Memory
BIT Built-In Test
CBIT Continuous BIT
DASA DaimlerChrysler Aerospace
DASS Defensive Aids Subsystem
EADS European Aeronautic Defense and Space Company
FC Failure Catalogue
FMECA Failure Mode, Effect and Criticality Analysis FMEA Failure Mode and Effect Analysis
FSL Failure Selection List
FSL and RS Failure Simulation List and Record Sheet
IBIT Interruptive BIT
ILS Integrated Logistics Support
LoF List of Functions
LRU Line Replaceable Unit
OFP Operating Flight Program
PBIT Power-up BIT
Ru Replaceable unit
RWE Radar Warning Equipment
SRU Shop Replaceable Unit
STTE Special to Type Test Equipment
TDP Testability Demonstration Plan
TDR Testability Demonstration Report
CONTENTS
CHAPTER 1 INTRODUCTION...1 1.1 BACKGROUND...1 1.2 OBJECTIVE...1 1.3 PROBLEM FORMULATION...1 1.4 LIMITATIONS...2CHAPTER 2 COMPANY AND PROJECT INFORMATION...3
2.1 SAAB AVITRONICS...3
2.2 THE RWETORNADO GEPROJECT...3
2.2.1 Tornado RWE ...3
2.2.2 The Built-In Test Procedure ...3
2.2.3 The Failure Catalogue...4
2.3 EADSTESTABILITY DEMONSTRATION PROCESS...5
2.3.1 Purpose of the Testability Demonstration ...5
2.3.2 Preparations ...5
2.3.3 Failure Simulation List and Record Sheet ...5
2.3.4 Performance of the Testability Demonstration...5
2.3.5 Testability Demonstration Report...6
2.3.6 Testability Demonstration Acceptance ...6
CHAPTER 3 CREATING THE DATABASE...7
3.1 TRIAL AND ERROR...7
3.2 MICROSOFT ACCESS BASICS;OBJECTS AND STRUCTURE...7
3.2.1 Tables ...7
3.2.2 Queries ...8
3.2.3 Forms...9
3.2.4 Reports...10
3.3 MANAGING THE BASICS AND OPTIMIZING THE DATABASE...10
CHAPTER 4 OUR PRODUCT...12
4.1 THE DATABASE OBJECTS AND STRUCTURE...12
4.1.1 The Tables ...12
4.1.2 The Query ...13
4.1.3 The Forms...14
4.1.4 The Report ...14
4.2 THE REFRESH BUTTON...14
4.2.1 The Purpose of the Refresh Button ...14
4.2.2 The Visual Basic Code and its Logic ...14
4.3 DATABASE TOOL BREAKDOWN...15
4.4 TESTABILITY DEMONSTRATION REQUIREMENTS COMPLIANCE...15
4.4.1 Failure Simulation List and Record Sheet ...15
4.4.2 Recorded Demonstration Results...15
4.4.3 Testability Demonstration Report...15
CHAPTER 5 DISCUSSION ...16
5.1 COMMENTS ON MICROSOFT ACCESS...16
5.1.1 The Design View for Forms and Reports...16
5.1.2 Error Messages and Debugging ...16
5.2 REFRESH BUTTON AMBITION LEVEL...17
5.3 THE REFRESH BUTTON’S KNOWN ISSUES AND POSSIBLE SOLUTIONS...17
5.3.1 The Human Factor Issue ...17
5.3.2 The Time Stamp Format Issue ...17
5.3.3 The Table Transfer Method Issue ...17
vii
5.4.1 Failure Simulation List and Record Sheet Template ...18
5.4.2 Signal List Provision...18
5.4.3 Size of the Failure Simulation List...18
5.4.4 Spelling ...18
CHAPTER 6 CONCLUSIONS AND FUTURE WORK ...19
6.1 CONCLUSIONS...19
6.1.1 Microsoft Access...19
6.1.2 DASA P-TOR-0007 Requirements Fulfillment ...19
6.1.3 The Literary Study ...19
6.2 FUTURE WORK...19
CHAPTER 7 REFERENCES...20
LIST OF FIGURES...21
APPENDIX A RWE TORNADO GE TDEMO TOOL INSTRUCTIONS... 1
-A.1 GENERAL PRESENTATION...-1
-A.2 HOW TO USE THE RWETORNADO GET-DEMO TOOL...-1
-A.3 THE STRUCTURE...-1
-A.3.1 Current Location ... 1
-A.3.2 Current Structure ... 2
-A.3.3 Addition and removal of fields or tables ... 3
-A.4 THE UPDATE PROCEDURE...-5
-A.5 TOOL AND DOCUMENT REVISION...-5
-A.5.1 Performed Revisions ... 5
-APPENDIX B ORIGINAL TABLE STRUCTURE... 6
-Chapter 1
Introduction
The following chapter is an introduction to the thesis topic; the authors establish the problem at hand and also, a basic background of the project. Finally the objectives and the limitations of the thesis are clarified.
1.1 Background
In our time, an advanced electronics system’s availability is of highest importance. To ensure this, a rapid diagnostics function which is able to detect failures and their causes is necessary. The solution to this issue at Saab is the method of Built-In Test (BIT). In order to make certain the BIT operates properly, a testability analysis and validation has to be performed.
Currently, Saab is responsible for parts of the mid-life upgrade for German Luftwaffe Tornado fighter and reconnaissance aircraft Radar Warning Equipment (RWE Tornado GE). As part of this, the RWE’s BIT performance has gone through a testability analysis and – according to the purchaser EADS procedure document DASA P-TOR-0007 [1] – a failure catalogue has been created. The failure catalogue consists of all possible failures and their related information.
1.2 Objective
The objective of this thesis work is to help Saab develop an efficient database solution to manage the Failure Catalogue as well as create the Failure Simulation List and Record Sheets – specified in DASA-P-TOR-0007 [1]. A database was already created in FileMaker Pro for Mac OS X, but had to be optimized. In addition to that, Saab was looking for a Windows-based solution in their standard program for database management; Microsoft Access. Since the customer has enclosed their requests concerning the design of the Failure Simulation List and Record Sheet, one of the main objectives will be to deliver the reports accordingly and also to optimize the database to ensure it is as understandable and usable as possible. The other main objective, which actually is the most important, is to understand the testability analysis process and the outcome of the same.
There is also an optional objective, which will be performed in case the time permits. This objective consists of an investigation of the Relex software and its potential in reliability predictions as well as testability and failure mode analyses.
1.3 Problem Formulation
The failure mode data are accessible in Microsoft Excel documents, sorted in different tables and are arranged to be imported to Microsoft Access. The software is a database program, which can simplify and give structure to the massive amount of data. In order to complete this, there is need to gain basic knowledge about the software, how to handle it and how to build up and optimize the database, making sure that it works in a both time and cost efficient manner. Mainly though, the importance of understanding the procedure of testability analysis validation and demonstration is imperative rather than taking on the challenge of linking together the existing data in a database.
2
1.4 Limitations
In this thesis work we will initialize a Microsoft Access database from the Microsoft Excel worksheets, which is the outcome of the FileMaker Pro database. Our intentions thereafter is to optimize the database, regarding table and query structure, as well as the design of the input form which is used to create new items in the Failure Simulation List and Record Sheet (FSL and RS).
In the database structure, there will be a refresh button which will update the database tables from Excel. We will make an effort in creating a button which updates data in the database tables, by comparing timestamps for each row between the database tables and the Excel worksheet. This refresh function will however not be waterproof, but we will investigate its drawbacks and possible solutions in order to ease future improvements of the button.
Even though the process of learning Microsoft Access was smoother than expected, we found out quite early that the optional objective of investigating the Relex software’s potential was not possible to fit in within the duration of this thesis work and will be cancelled.
Chapter 2
Company and Project Information
In this chapter, the authors have introduced the company Saab Avitronics and the Tornado project, which is the framing of the thesis work. Also, the customer’s requirements will be given a closer look.2.1 Saab Avitronics
The Swedish company Saab Avitronics is a part of the Saab Group, which is one of the world leading companies in aviation defense technology. They are a leading supplier of Avionics and Electronic Warfare (EW) systems to purchasers around the world and are a provider of products in the areas of Electronic Protection (EP), Electronic Attack (EA) and Electronic Support Measures (ESM). There are also systems available for UV (Ultra-Violet), jammers, radar, decoys and countermeasure dispensers which are suitable for many different types of airplanes and helicopters.
Ever since the 1950’s Saab Avitronics has been developing EW systems and provided the Swedish Air Force with the latest technology for generations. Today, Saab is still going strong and the world renowned fourth generation multi-role military aircraft JAS 39 Gripen is the company’s main product of both domestic usage and export. [2]
2.2 The RWE Tornado GE Project
The project is a part of the Luftwaffe German Air Force Mid-Life upgrade of the Tornado fighter and reconnaissance aircraft and it is a part of the Tornado Defensive Aids Subsystem (TDASS), provided by the purchaser EADS. In late 2000, Saab Avitronics was awarded with the contract after a long and hard competition.
2.2.1 Tornado RWE
The functions of the Radar Warning Equipment (RWE) is to detect, identify and prioritize radar signals from air, sea and land in order to evaluate if a threat is present or closing in. The source of the signal data is identified and categorized by comparison to a signal description library (or the Emitter Library) which is mission data stored in the RWE. The compared data is stored and maintained in a track list, which afterwards is sent to the DASS Bus. However, the RWE does not have built-in displays or control units, so the DASS Bus and the Avionics Bus is connected to the aircrafts centralized display and control elements.[3]
2.2.2 The Built-In Test Procedure
As earlier stated, the method of verifying the detection and isolation of faults in the equipment is Built-In Test (BIT). The meaning of the tests is to verify that the failures that may occur within the faulty LRUs, is detected and isolated by the BIT. A way of verifying BIT functionality is to insert failures or disruptive signals into the equipment’s system and examine whether the BIT detects the failure. The BIT shall be able to detect and isolate at least 95% of the possible failures and the remaining 5% shall be marked in the failure catalogue with an index which describes the status of the failures. They can be marked as E, A, V or O which stands for External, Acoustical, Visual respectively Other. The BIT is built on a series of tests which are parts of different test categories. Every
4
failed test returns an error code, which is unique for every test case. There are three types of BIT:
- Power-Up Built-In Test (PBIT) - Interruptive Built-In Test (IBIT) - Continuous Built-In Test (CBIT)
The Power-Up and Continuous BIT is automatically initiated during the power-on sequence of the equipment. CBIT follows when PBIT is completed and the equipment is commanded to enter operation mode. CBIT is a cyclic test with a certain time period for a complete CBIT cycle. The command for IBIT initiation comes from either the DASS Bus or the Avionics Bus, which upon command, transits to Initialize Mode and performs the IBIT. When the tests are completed, all of the results are available in the DASS Bus. If a failure has been detected, it will be stored as a record in a BIT History Memory (BHM).
2.2.3 The Failure Catalogue
As mentioned in the very first chapter in this report, a failure catalogue has been created according to the customer requirements. The Failure Catalogue consists of 5120 failures, each given a unique number which identifies every single failure. These four block numbers (e.g. 01.02.03.04) are simply called failure numbers. In this number combination, the first number represents in which Line Replaceable Unit (LRU) the failure has occurred, where the number is between 01 and 07. The second number points out where on the LRU the failure is located, i.e. in which Shop Replaceable Unit (SRU). The third number is one more level in depth, to really pinpoint the exact location of the failure in the SRU. These three numbers are as a series called “Function Number” and it is a description of each function within the system. The fourth part of the failure number is simply an index of every failure in each function, e.g. if the failure number is as earlier 01.02.03.04, it means that in the function number 01.02.03, this is the fourth listed failure. Currently, there are 5120 failures in the failure catalogue, divided among 822 functions.
2.3 EADS Testability Demonstration Process
The following section is a concise description of the customer’s requirements for the Testability Demonstration (T-Demo), of which some are closely related to the framing of this thesis work. These requirements are specified in the customer’s document for testability analysis, validation and demonstration – DASA-P-TOR-0007 [1].
Testability Analysis and Validation are the stages before the actual demonstration takes place. During this stage, the objective is to validate that the avionic equipment complies with the specified testability requirements, through analysis. When the analysis is completed, the supplier must enclose a Testability Analysis Report for each tested equipment, in this case; the RWE.
2.3.1 Purpose of the Testability Demonstration
The T-Demo is the process where the supplier verifies to the customer that the test equipment, in this case the BIT, actually detects failures and is able to isolate them. The demonstration is performed through failure simulation, where failure detection and failure isolation rates are established. There are three steps for the T-Demo:
- Demonstration Preparation
- Performance of the Demonstration
- Repeat of Demonstration (performed when the equipment is to be modified or if the T-Demo was not successful)
2.3.2 Preparations
Before the demonstration commences, the supplier must enclose a Testability Demonstration Plan (TDP) to the customer. The TDP shall contain all necessary information and procedures for the preparation and performance of the demonstration.
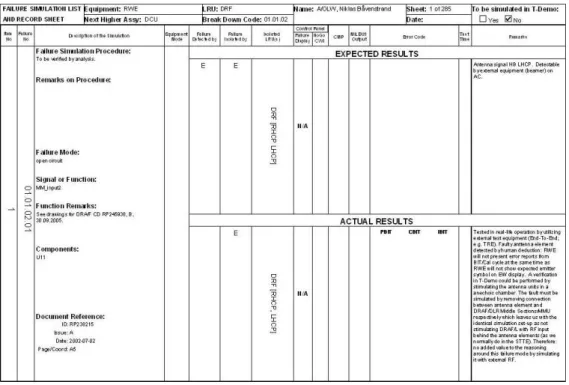
2.3.3 Failure Simulation List and Record Sheet
Included in the TDP is also the Failure Simulation List (FSL), which is the customer’s selection of items from the Failure Catalogue (FC) for the T-Demo. The FSL normally contains at least 10% of the FC, unless the supplier and EADS have another agreement. For the sake of flexibility in failure selection at the T-Demo, the FSL shall contain twice as many items agreed for the demonstration. Since the FSL is also made for recording the results of the failure simulation – including both expected and actual test results – each item in the FSL is presented on a separate sheet, called Failure Simulation List and Record Sheet (FSL and RS). The FSL and RS must contain certain data. This is specified in the procedure document from EADS.
2.3.4 Performance of the Testability Demonstration
The following process will be repeated for all selected items during the demonstration and is quoted directly from paragraph 3.4.2 in DASA-P-TOR-0007 [1]:
- The equipment shall be functionally tested before the start of the demonstration using STTE or equivalent test equipment, to ensure that it is failure free.
- A failure is induced in the equipment.
6
- The results shall be analyzed to determine whether or not a clear indication of the detection/isolation of the failure in the equipment is provided, and to determine the level of ambiguity of the equipment BIT.
- The detection test time and the diagnostic test time shall be recorded.
- After the demonstration, the equipment/LRU shall be repaired and re-tested.
2.3.5 Testability Demonstration Report
When a month has passed from the T-Demo date, the supplier shall send a demonstration report to the purchaser, including the FSL and RS, the assessment of the results, the summary of the T-Demo, etc.
2.3.6 Testability Demonstration Acceptance
To accept the demonstration, the supplier’s analysis and prediction of the equipment testability, recorded in the FC, must coincide with the results of the demonstration.
Chapter 3
Creating the Database
Before this Thesis work was initialized, none of us had neither used Microsoft Access at all, nor even been in contact with databases. Therefore, we naturally needed quite a while to become familiar with the objects of a Microsoft Access database, their respective purpose and how they are built up.
3.1 Trial and Error
When this thesis work began, we did not know anything of what is described in section 3.1 and since we had no handbooks or other educational material, we decided to make a trial and error approach in Microsoft Access. Our first tentative step of the familiarization was to recreate the template database. Simply, we had the template open on one computer and an empty database open on the other and built up a copy of the database, object by object. For each change we made to our new database, we tried to observe the effect it had. We also read a tutorial about Microsoft Access, learning more about the objects.
3.2 Microsoft Access Basics; Objects and Structure
The usage of Microsoft Access can be a very helpful instrument to manage data. Though, in order to understand the process of database creation and the relations between the tables, one must study either another database or use the help of a tutorial. In our case, both methods were applied. Before the thesis job began, our supervisor Niklas Båvenstrand had created a preliminary database, which we used as a template. In time, all the basics were learned and the first draft of the database could be created.
3.2.1 Tables
The primary object in a Microsoft Access database is the table, where the data is stored. It looks just like any other table, with rows and columns. The columns are called fields and each one of them has a name, preferably referring to its contents.
A table can be added in three different ways. The first and most simple way is to create an empty table where fields and their respective information are entered manually. The second way is to import tables from another source, e.g. a Microsoft Excel worksheet or tables in another database. The third and last way is to link a table from another source, which for
8
example also can be a Microsoft Excel worksheet or tables in another database. When choosing how to add a new table to your database, the advantages and disadvantages of each way of adding should be considered.
The tables can be viewed in Open View or Design View. In the Design View there is the possibility of choosing a primary key in the database. This is an advantage for linking together related fields between multiple tables. In the Open View, the tables simply appear as rows and columns. All changes that are made within the imported tables are of course saved within Microsoft Access. Should the data in the original tables – from which the information has been imported – be changed, the user then has the choice to either manually change the data in the imported Access tables (in order to match the changes in both tables), or to delete the existent imported table and re-import it. If a table is linked from a Microsoft Excel worksheet, the information cannot be edited directly in Access, nor can primary keys be chosen or field types be changed. However, tables linked from another database will have the same primary keys as in the database from where the tables are linked.
3.2.2 Queries
The query is the description on how to fetch and process the information supplied in the tables. Depending on what information is to be presented by the database, the tables are given certain joins in between them. Should the tables in the database have a common field – which will be of central use – this field can be selected as a primary key. When this is done, this field is marked with bold type in the design view, as shown in the picture to the right. Multiple primary keys are allowed, depending on how the database shall be built.
In the design view of the query, the terms must be declared in a series of declaration fields. First the requested fields have to be declared and also from which table the data shall be fetched (in case there would be multiple fields with the same name in
different tables). There are also other possibilities for sorting and adding additional criteria in the declared fields.
When the needed tables are placed in the query window, there are three different ways to join them, or three join types. These represent three methods of connecting data between the tables. The join types are:
- Join type 1: Only to include those rows where the joined fields from both tables are equal.
- Join type 2: Include all fields from the one table and only those from the other, which are equal.
- Join type 3: Include all fields from the other table and only those from the first which are equal.
3.2.3 Forms
The third basic object of the database is the form. This is the tool with which you enter and connect related data, as well as changing the existing. To create a new record to the recordset, simply press the “new record” button and enter what records you want to add. If the record already exists, but not in the recordset, all the information related to it – if the query is built correctly – will show up in the respective textbox. It is then possible to change the fetched information – assuming the textbox is not locked. As the picture shows beneath, there are some data that are locked; the expected, and some which can be altered; the actual results. To the left of the text boxes are the labels, where the descriptions of the text boxes are listed.
The data that appears in the text boxes are data direct from the imported tables. For this to work, the setting of the correct control source must be done, which is accessible in the text box properties in the design view of the form. Also the form itself has to have an accurate record source. If the database includes a query, it is in most cases the proper record source.
In the form there are also possibilities to create buttons, which can have one function or another. When pressing the button there is an event procedure that becomes activated. This procedure can be programmed in e.g. Visual Basic for Applications (VBA) to do a task, e.g. refreshing the existent data in the form.
10
3.2.4 Reports
The report is exactly what it sounds like, a document in which data is printed and the document itself is printable. Not unlike the form, the proper control sources must be set for each component in order for the correct data to appear, as well as the proper record source for each report.
If there are fields with the same name in different tables, the control source has to be entered with both the table name and the field name, separated by a point, e.g. tablename.fieldname. However, all available control and record sources are visible in a list in their respective input field in the properties box.
Below is a screen dump of our report and it roughly shows how a report can be built. The information about our tables, queries, forms and reports will be explained in depth in a later chapter, along with Appendix A, which includes instructions on how to use and modify the database.
3.3 Managing the Basics and Optimizing the Database
The trial and error approach was successful, even though we got totally stuck a few times. Step by step, a copy of the template was built up. This template copy had all the objects needed (i.e. tables, query, form and report), but none of them were both complete and optimized.Initially, there were 13 tables, which we thought were too many. Also, multiple tables had fields which were never used in the report. We decided to make a complete reconstruction of the tables, with new table names and exclude the fields which were never used.
Since the query is based on which input data – i.e. tables – there is, the reconstruction of the tables resulted in a need of reconstructing the query. Since the number of tables was decreased, the query became easier to overview.
The input form was completely rebuilt from zero. We had to make sure all the data required on the Failure Simulation List and Record Sheet (i.e. on the report, using Microsoft Access terminology) also could be fetched from the tables when creating a new EADS FSL Item No (i.e. record in the recordset, using Microsoft Access terminology). The report was probably the easiest object to optimize, since the purchaser had a standardized template for it. Yet, it was this object which took the most time to complete, depending on both the large number of components (e.g. text boxes, labels, boxes etc.) and the non-friendly user interface of the report design view, regarding moving and resizing components with high precision.
12
Chapter 4
Our Product
This chapter describes our achievements in Microsoft Access; the optimized database. The reader will be given a more detailed picture of the final product and its potential.
4.1 The Database Objects and Structure
After ten weeks, the database is completed and ready to use. It fulfills the customer’s requests as well as Saab’s wishes and has been optimized accordingly. The following subchapters describe the result of the optimization for each database object and the difference from how it was before; in Niklas Båvenstrand’s template.
Due to complications with the function of the refresh button (which is described in section 4.2), the database had to be split in two separate database files. One with the tables and one with the query, the form, the report and links from the tables in the other database (called the Back End database). This Back End database also includes a form, where the refresh button is located. Detailed information about the reason for using a Back End database can be found in Appendix A.
4.1.1 The Tables
Changes made to the tables have been the removal of unnecessary fields and fusing of the tables with the same amount of rows – or, to be more specific, the tables which all include all the 5120 failure numbers or all the FSL Item Numbers. By completing this, we decreased the amount of tables from 13 to six. The table structure has been improved, which gives an easy and clean view of the table structure.
A number of fields were never used on the reports and were therefore deleted when restructuring the tables. These fields are, sorted by tables in the original structure:
• Additional Data FSL
- Intermediate Delivery EADS - Isolated LRUs
- Reference to other FSL Item - Remarks
- Simulated Dept_Name - Test Simulation Pending - Test Simulation Performed • ErrorCode_BITnode_TestedFunc - Error Code - BIT Node - Resource - Function • FailNo_ErrCode Actual - Error Code • FailSim_FailNo - Test Prerequisites
- Remarks on selected failure • FMEA - Severity Class - Effect on Module - Effect on LRU - Effect on System • FSL_Item_Prod_Assist - EADS FSL Item No - Prod Tech Assist • Testability Analysis
- Localization to Modules - Localization to LRUs - Test name_test step - CoOp BIT
• Testability Analysis Actual - Localization to Modules - Localization to LRUs - Detection by CWS - Test name_test step - CoOp BIT
- BHM Binary file available
Since we merged some of the old tables in the restructuring process, we also changed the names of the tables in the new structure, to avoid mixing up the old and the new ones. LoF and FuncNo_HW were left unmodified since the contents of the List of Functions (LoF) are specified in DASA-P-TOR-0007 [1] and no other merge were possible for FuncNo_HW.
This is how the tables were merged:
- Additional Data FSL, FailSim_FailNo and FMEA became FMEA_FSL Data. - FailSel_FailNo and FailNo_DocRef became FailSel_FailNo_DocRef.
- Testability Analysis Actual and FailNo_ErrCode Actual became Testability Data_ErrCode Actual.
- Testability Analysis and FailNo_ErrCode became Testability Data_ErrCode Expected. The Following tables were completely removed:
- ErrorCode_BITnode_TestedFunc - FSL_Item_Prod_Assist
Further, a field called Latest Update has been added to the far right in each table, containing a time-stamp, enabling time comparison between new and existent data in each row. More information about this can be found in Appendix A. The original table structure is to be found in Appendix B.
4.1.2 The Query
The query consists of the six previously mentioned tables which are listed in Appendix A. The primary keys are set to Failure No within four tables and Function No for the other
14
two. For a long time we used the initial 13 tables in the query and somehow the database did not quite work. This was also one of the reasons why we optimized the tables. By doing this, it was easier to create the accurate joins between the tables. In the Appendix A you can find screenshots of each of the query in Design View.
4.1.3 The Forms
There are two forms in the database. One form is in the main database file and one in the Back End database. The form in the main database file handles addition or removal of Items in the FSL. Initially, the idea was to display only the FSL in the form and from there search for failure numbers to it. But after the breakdown of the database (see section 4.3), a workaround was performed and the form now includes the whole 5120 failure numbers of the FC. Though not all parameters in the form are able to be edited, the idea was to make all information which is displayed in the report visible in the form.
The form in the Back End database is simply the refresh button and related information.
4.1.4 The Report
The report is mainly designed to meet the customer’s requirements – specified in DASA-P-TOR-0007 [1]. There is one slight lapse from the specification – a check box which displays whether the FSL Item is to be simulated in T-Demo. Also, there is dedicated space for information regarding the simulation.
4.2 The Refresh Button
As mentioned earlier, the Back End database includes a form with a refresh button which updates the database with information from Excel worksheets. This section describes the purpose of the button and the code behind it. For more detailed information about the refresh button, see Appendix A.
4.2.1 The Purpose of the Refresh Button
Since the original tables from Microsoft Excel might someday be updated, it is important that the Microsoft Access database constantly contains accurate data. Since many people might use the database and update it independently, more recent data may be overwritten and thereby lost. On a request from our supervisor Niklas Båvenstrand, a button which updates the existent tables with information from Excel worksheets was to be created. He also requested some kind of function which determines whether the existent or the Excel worksheet information is the most recent and accurate. The easiest way to do this seemed to be a button in the form with an event procedure written in Visual Basic for Applications (VBA).
4.2.2 The Visual Basic Code and its Logic
When clicking the button, the VBA code compares time-stamps between already imported tables in Microsoft Access and the original table documents in Microsoft Excel. Since there are time-stamps for each row in the worksheets, the program knows exactly which row is connected to a specific time-stamp. If the time-stamp would be newer in an Excel row, the program memorizes this specific row and the data contents therein and replaces the Access table’s correspondent row with the newer and actual data.
4.3 Database Tool Breakdown
During the final weeks of the thesis work, we tested the tool once again and tried to add new FSL Items to the Failure Simulation List. Unfortunately, this maneuver was not successful; the form did not perform as we thought it would, as it actually did a few weeks earlier. The problem seemed to be the query and just like in the earlier phases of the work, we made a trial and error approach troubleshooting the query. We tried all types of joins between different tables, of which none were successful.
Though, we found a workaround to the problem. Instead of sorting out the FSL Items in the form, the form includes the whole 5120 Failure Numbers and from there, being able to filter out the selected failure number and assign it to a new FSL Item Number in the Failure Simulation List.
4.4 Testability Demonstration Requirements Compliance
The procedure document [1] has been carefully studied in order to identify the requirements directly connected to this thesis work. Three paragraphs were found; 3.3.1.2, 3.4.3.1 and partly 3.4.3.2.4.4.1 Failure Simulation List and Record Sheet
The FSL and RS are created as one sheet per failure, as requested in paragraph 3.3.1.2, and the report has been built in Microsoft Access in accordance with the template in Figure 9 – both found in [1]. Most of the FSL Items were already selected when this work started, but there is still a possibility to add new Items.
4.4.2 Recorded Demonstration Results
According to paragraph 3.4.3.1 in [1], the following data is to be recorded: - Failure Detected By
- Failure Isolated By - Isolated Ru(s) - Test Time - Remarks
Ru is short for “Replaceable unit”. Since the FSL and RS have been completed in accordance with the template, and the template includes all given parameters above, the requirements are fulfilled here as well.
4.4.3 Testability Demonstration Report
Paragraph 3.4.3.2 in [1] concerns the Testability Demonstration Report and states that it shall be handed over to the customer within a month after the T-Demo and that it, among other, shall include a completed FSL and RS (see paragraph 2.3.5). Since the input forms are available in Microsoft Access, the FSL and RS can be filled out and completed already during the T-Demo.
16
Chapter 5
Discussion
The discussion chapter is as always the evaluation of the projects progressions and achievements and whether they could have been done in another way or with another approach. What went wrong and why? Did the problems at hand get solved in time? These questions and more are answered in this chapter, along with the authors’ comments of it all.
5.1 Comments on Microsoft Access
Microsoft Access certainly has both its advantages and drawbacks. Unfortunately we have not been working with any other database application – or even databases – and therefore have no good comparison. Though, we have noticed a few issues regarding the usage of Microsoft Access, which made the process of creating the database unnecessarily complicated.
5.1.1 The Design View for Forms and Reports
The concept of the design view does not give a modern impression. It is possible to place components with great precision, but not in a very efficient manner. Arranging components with the highest precision on a form or a report requires that you – by typing the actual measurements in each input box – enter its distance from the left side and the top, along with its height and width. You may as well move them with the mouse, but not with the same high precision, which we needed for the FSL and RS. Also, the unit used for measurements is centimeters. It would definitely be handier to measure in points, or at least the possibility to choose unit.
When it comes to designing forms, Microsoft Visual Studio has a feature which makes components lock at the same height, width etc. A similar function in Microsoft Access would definitely speed up the process of designing forms and reports.
5.1.2 Error Messages and Debugging
When creating the query and the refresh button, we got several error messages, both from Microsoft Access itself and the debugger for the VBA editing application.
The error messages which came from Access itself were often very general and of no help. Almost all of them suggested problems in the index, primary key or relationship, creating duplicate entries. Even if you clicked on the help button in the error message, no further information was presented. More specific error messages – which present more detailed solutions to the problems and also suggesting more than one solution, depending on what the user wants to achieve with the database – would speed up the database troubleshooting. Another solution to this issue would be some kind of debugger or troubleshooting tool for the query design view, which we found very complicated and non user-friendly.
The error messages which came from the debugger of the VBA editing application were in some ways more specific – though not being specific enough. Unfortunately, they do not tell the user where in the code the error has occurred. Also here, more specific error messages would be of great help along with an error locator – though this might be more of a question for the Visual Basic applications developers rather than for the developers of Microsoft Access.
5.2 Refresh Button Ambition Level
At first glance, to create a button which updates the tables with information from Excel worksheets seemed like a task which would be done fast and smoothly. We were wrong. As a matter of fact, the button took almost three weeks to finish. This, of course, stole time and effort from more important parts of the thesis work, mostly the Access basic management and the understanding for the testability analysis and demonstration process. Also, the literary study was delayed.
5.3 The Refresh Button’s Known Issues and possible
solutions
Even though the update tool performs the requested operations, there are a few drawbacks and potential improvement areas.
5.3.1 The Human Factor Issue
First of all there is a human factor issue with the time stamp. The time stamp is to be manually updated by the person who edits the table. If this is forgotten, the updated information will not be imported to the database. The solution to this issue would be a formula, function or macro in Excel which automatically adds today’s date to the Latest Update column when a row is edited.
5.3.2 The Time Stamp Format Issue
There is also an issue with the time stamp’s format, which in fact is a date stamp in its current state. If more than one edit is made to the sheet on the same date, only the first edit will be imported to Access. There are a few possible solutions to this problem. The probably best one is to incorporate a time stamp with both date and time included.
5.3.3 The Table Transfer Method Issue
The last known issue is related to the way the DoCmd.TransferSpreadsheet method works and currently, we do not have any waterproof possible solution to it. The problem occurs when using the DoCmd.TransferSpreadsheet method to import the updated table back into the Access database. If the date is in an unrecognized format or if multiple dates are added to the same cell, then that cell will not be imported and left blank in the final updated Access table in the database. The best solution found so far is to keep to the predetermined format of the date and adding only one date in each cell. However, Microsoft Access itself will create a separate table called tablename$_ImportErrors with information regarding which cells could not be imported and why. That will give the user a chance to manually copy and paste the information which could not be imported.
18
5.4 Comments on DASA-P-TOR-0007
5.4.1 Failure Simulation List and Record Sheet Template
We find the template of the FSL very old school. DASA-P-TOR-0007 [1] is written in the early nineties and a lot has happened since that, which would make it possible to present the results of the simulation (i.e. the FSL and RS) in a smarter and more efficient way. Also, presenting the results on physical sheets is definitely out of date.
The template is supposed to be used for different equipments installed in the Tornado aircraft. Since the equipments installed may differ regarding test method, recorded parameters etc., all fields on the FSL and RS will not be applicable for all equipments. Therefore, we think a separate template for each equipment’s FSL and RS – i.e. in this case a RWE FSL and RS – would be a better solution.
5.4.2 Signal List Provision
Paragraph 2.3.4 states that “The Signal List together with the List of Functions forms one of the bases for the preparations of the Failure Catalogue…” and paragraph 2.3.5 states that “The List of Functions shall substitute or supplement the Signal List where functions cannot be measured in physical units (e.g. for digital circuits)”. These paragraphs partly contradict each other and lead to confusion regarding which cases require a Signal List and which do not. Though, we have not made any further research to find out how this is handled by Saab and EADS.
5.4.3 Size of the Failure Simulation List
Paragraph 3.3.1.1 states the following: “At least 10% of the total failures in the Failure Catalogue shall be demonstrated. In case of a very large Failure Catalogue a reasonable limitation of the sample of the selected failures may be agreed with the purchaser’s testability authority”. How large is a very large FC? What is a reasonable limitation for the FSL?
5.4.4 Spelling
This procedure is very exact in its descriptions and requirements in most aspects. Unfortunately, this does not include the spelling; there are several spelling mistakes, spread over the whole document. Though none of them leads to confusion of what is meant, a military procedure document should not have this kind of simple discrepancies – especially since the requirements it sets for the customer are at a high level.
Chapter 6
Conclusions and Future Work
This chapter concerns the authors’ conclusions and the future work of a potential follow-up job to this thesis work. The summary of their struggles and progressions are presented, along with the parts of the thesis objectives which were not completed.
6.1 Conclusions
6.1.1 Microsoft Access
Though Microsoft Access is a powerful tool, we noticed already in the beginning of this thesis work that it is a lot to learn about it before you can build a useful database. It is neither fail safe or fool proof; a guide on how to get started would be very helpful. Our guide was the template from Niklas Båvenstrand. Without it, the process of learning Microsoft Access would have taken a lot more time.
A better solution for us could have been for example to build a program in Microsoft Visual Studio; this would probably be a more time efficient solution.
6.1.2 DASA P-TOR-0007 Requirements Fulfillment
In section 4.4, we identified the requirements specified in [1] which are related to our work. Also, we found out that the requirements in all three paragraphs (4.4.1, 4.4.2 and 4.4.3) are fulfilled.
6.1.3 The Literary Study
The literary study was supposed to be within state of the art of Testability Analysis. This had two major drawbacks. First of all, we needed basic understanding for the subject before trying to understand its state of the art. Also, it was hard to fit in the literary study within the time frame of the thesis work, mostly since the process of learning Microsoft Access took more time than expected.
6.2 Future Work
The future work consists of three major parts. The most important is to deal with the structure of the database, or more specific the query, which does not quite work as expected together with the input form for new FSL Items. Since the database broke down (see paragraph 4.3), the query needs to be reworked in order to simplify the process of adding items to the FSL. The idea of the input form is to enter a failure number and assign it to an FSL number. Then the query will fetch all related information to that number and present it on the FSL and RS.
The second objective – regarding the investigation of the Relex software – specified in the initial thesis plan and section 1.2 in this report, is left unprocessed.
The third part of the future work is related to the known issues of the refresh button, presented in section 5.3, along with possible solutions.
20
Chapter 7
References
[1] DASA-P-TOR-0007, Issue 1-1, Procedure for Equipment Testability Analysis, Validation and Demonstration
[2] URL: http://www.saabgroup.com/
Viewed on 2009-03-31
[3] Furustig Peter, Basudde Raymond, Built-in-Test Verification of an Advanced Avionics System, Report code: MDH.IDT.FLYG.1000.2008.GN300.15HP.Av, School of Innovation, Design and Engineering, Mälardalen University, Västerås, 2008 [4] URL: http://www.brainbell.com/tutorials/ms-office/Access_2003 Viewed on 2009-03-02 [5] URL: http://msdn.microsoft.com/en-us/library/aa141565(office.10).aspx Viewed on 2009-05-04 [6] URL: http://msdn.microsoft.com/en-us/library/bb243150.aspx Viewed on 2009-05-04 [7] URL: http://office.tizag.com/accessTutorial/index.php Viewed on 2009-03-02 [8] URL: http://www.bluemoosetech.com/microsoft-access-tutorial.php?jid=14&title=Microsoft%20Access%20Relationships Viewed on 2009-03-02 [9] URL: http://www.bcschools.net/staff/AccessHelp.htm Viewed on 2009-03-02
List of Figures
- Front Page Figure: Panavia Tornado ECR, Courtesy of Henk Schmidt- Bergemann, Source: http://www.airliners.net, Photo ID: 1423665
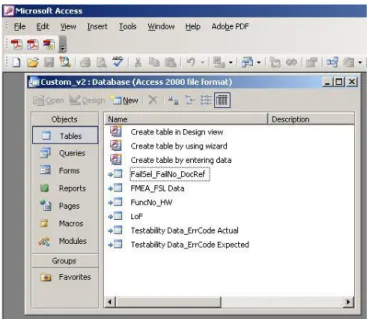
- Figure 3-1: Screenshot of tables tab in Microsoft Access
- Figure 3-2: Screenshot of query design view in Microsoft Access - Figure 3-3: Screenshot of form created in Microsoft Access - Figure 3-4: Screenshot of report created in Microsoft Access
- 1 -
Appendix A
RWE Tornado GE T-Demo Tool
Instructions
A.1 General Presentation
The RWE Tornado GE T-Demo Tool has been developed in order to present the outcome of a Testability Analysis performed by Saab Avitronics. The tool itself is a Microsoft Access database, but with the enhanced feature to update the database’s tables with information from Microsoft Excel worksheets.
A.2 How to use the RWE Tornado GE T-Demo Tool
Basic Microsoft Access handling and knowledge is a prerequisite for the user of the RWE Tornado GE T-Demo Tool. To add a record to the Failure Simulation List and Record Sheet, simply right click in the failure number textbox and add your failure number in the “Filter For:” in the menu. When the filter is applied, please enter the FSL Item No for that failure number. Then remove the filter. When this is accomplished, you will find the record on a report among the others under the reports tab.
A.3 The Structure
The database is built up of six tables, one form, one query and one report. The query and the report are static and you will never have to change them (unless tables are added or removed from the database), neither during usage of the tool nor during update of the tables. Therefore, the structure description will focus on the tables’ and the form’s respective structures.
The database uses a method called DoCmd.TransferSpreadsheet for transferring to and from Microsoft Excel. If the database already has a table with the chosen name, this method will simply add the new data to this table, creating duplicate data. The objective in this case is rather to replace existing data with the new. This forces a solution where the existing table is deleted before the new one is transferred from Excel to Access. However, the TableDefs.Delete method, which deletes a selected table, will not operate properly if the table in question is bound to a query. Since all of the database’s tables are bound to a query, a solution had to be found in order to use this method. This was accomplished by using a database utility, called a database splitter. By using the database splitter, all the tables are moved to a separate database file (referred to as the Back End) and the tables in the original database are replaced with linked tables from the Back End. The update button is found in a form called Refresh DB in the Back End.
A.3.1 Current Location
The database is located in folder Y:\SaabAvitronics\Operations\ILS_Log\Verktyg och Studier\EXJOBB 2009\04. Pågående arbete, where Y: is A on 'corp.saab.se\groups' and has the name RWE Tornado GE T-Demo Tool.mdb. The Back End database is located in a subfolder called Split database and has the name RWE Tornado GE T-Demo Tool_BE.mdb.
A.3.2 Current Structure
All six tables have determined names, as well as their respective fields, which also have a determined order. To ensure proper handling and updating of the tables, the user will have to follow the determined structure when naming the Excel worksheets and their respective fields as described below (primary keys are written in italics):
• FailSel_FailNo_DocRef - EADS FSL Item No - Failure No - Motivation - FSL Remarks - Document ID - Document Issue - Date of Issue - Page/Coordinates - Latest Update • FMEA_FSL Data - Function No - Failure No
- Analyst (dept, name) - CMP - Eqt Mode - NoGo CWS - Simulated Date - Test Time - To be simulated in T Demo - Failure Simulation Procedure - Remarks on Procedure - Failure Mode - Signal - Latest Update • FuncNo_HW - Function No - NHL - LRU - Equipment - Latest Update • LoF - Function No - Function Name - Components - Function Description - Equipment Mode - Remarks - Latest Update
• Testability Data_ErrCode Actual - Failure No
- 3 - - Detected by
- Isolated by - BIT Indication - Remarks
- Error Code CBIT - Error Code IBIT - Error Code PBIT - Latest Update
• Testability Data_ErrCode Expected - Failure No - Failure Location - Detected by - Isolated by - Detection by CWS - BIT Indication - Remarks - Error Code - Latest Update
The date entered in the Latest Update field of each table must be in the following format: YYYY-MM-DD. Note: If other formats are used or more than one date is being entered in the same cell, the cell will not be imported with the rest of the sheet. See paragraph A.4 for further information.
A.3.3 Addition and removal of fields or tables
It is possible to manually add or remove tables or fields within the database. However, there are a few tool characteristics necessary to know before restructuring the database. To add a field to a table, it has to be made sure that the field is added anywhere but last (i.e. to the far right) in the table. The “Latest Update” field must be the last field in every table in order for the update procedure to perform properly. Any field may be removed from a table except from the Latest Update field and/or the primary key field. The primary key may though be changed in order to remove the old primary key field.
If a new table is to be inserted in the database, either from an Excel Worksheet or any other source, certain fields have to be inserted in it. There has to be one field in it matching an identical field in another table in the database (most probable Failure No or Function No, which are the two primary keys) and a field on the far right of the table containing the Latest Update information. If there is no information on when the latest update was performed, simply add today’s date to the empty cells. Then the query has to include the new table.
To add or remove a table, or change its name, some slight changes also have to be made in the source code for the refresh button.
In the source code (which is found by right-clicking on the button in the form’s design view and selecting “Build Event…”) the tables are declared with names as shown below. Please notice the comments shown in green.
To add a table and let the update procedure know that this table exists, a new table has to be declared; preferably as number seven as in the case above and then assigning a name to it; do not forget the quotation marks. The table must also be included in the update procedure of the button’s source code. This is carried out as shown below. Once again, please take notice of the green comments.
Dim table1 As String Dim table2 As String Dim table3 As String Dim table4 As String Dim table5 As String Dim table6 As String
Dim table7 As String 'This is the new table.
table1 = "FailSel_FailNo_DocRef" table2 = "FMEA_FSL Data"
table3 = "Testability Data_ErrCode Actual" table4 = "Testability Data_ErrCode Expected" table5 = "FuncNo_HW"
table6 = "LoF"
table7 = "NewTableName” 'This is the new table’s name.
If RefreshQ = vbYes Then 'FailSel_FailNo_DocRef RefreshTables (table1) 'FMEA_FSL Data RefreshTables (table2)
'Testability Data_ErrCode Actual
RefreshTables (table3)
'Testability Data_ErrCode Expected
RefreshTables (table4) 'FuncNo_HW RefreshTables (table5) 'LoF RefreshTables (table6) 'NewTableName
RefreshTables (table7) 'New table is put in before the message box. RefreshC = MsgBox(...) Else Exit Sub End If
- 5 -
A.4 The update procedure
In order to simplify the refresh procedure of the RWE Tornado GE T-Demo Tool and what to have in mind when creating the Excel worksheets from which to update the tables, it is good to know how the tool performs the import.
First of all the worksheets will have to be created and named according to the structure described in the above sections – i.e. the LoF table’s corresponding Excel worksheet’s name would be LoF.xls. Only those worksheets from which it is intended to update are necessary. Each one of these sheets is from now on referred to as a “new sheet”.
When the refresh button is pressed, a prompt message box will ask the user if the database is to be updated. If the answer is yes, there will be another message box for each table, asking if it is to be updated. When clicking yes in one of those message boxes, the update procedure will export the chosen Access table into an Excel worksheet. Then each row’s time stamp (i.e. the Latest Update field) will be compared to each other. If a new sheet’s row contains a more recent date than its corresponding row in the exported Access table, the number of the row will be added to an array of integers. If no rows with a more recent date are found when both sheets are scanned, no further action will be performed and the procedure continues with the next table. However, if more recent dates are found, these rows’ numbers will be added to an array of integers and later on copied from the new sheet to the exported Access table. Finally, the original table, which is still left in the database, will be deleted and the exported and updated Access table will be imported back to the Access database.
A.5 Tool and Document Revision
In order to keep this document synchronized with the tool’s structure and performance, a new revision has to be issued when a reconstruction of the tables or other major changes to the tool has been performed. Make sure the new revision has the correct revision number in both page header and filename. Also, make sure that the new revision is saved as a new file.
A.5.1
Performed Revisions
These are the revisions performed so far: - Revision 0, April 2009
Appendix B
Original Table Structure
• Additional Data FSL- Analyst (dept, name) - CMP
- Eqt Mode - Failure Number
- Intermediate Delivery EADS - Isolated LRUs
- NoGo CWS
- Reference to other FSL Item - Remarks
- Simulated Date
- Simulated Dept_Name - Test Simulation Pending - Test Simulation Performed - Test Time - To be Simulated in T-Demo • ErrorCode_BITnode_TestedFunc - Error Code - BIT Node - Resource - Function • FailNo_DocRef - Failure No - Document ID - Issue - Date - Page_Coordinates • FailNo_ErrCode - Failure No - Error Code • FailNo_ErrCode Actual - Error Code
- Error Code CBIT - Error Code IBIT - Error Code PBIT - Failure No • FailSel_FailNo - EADS FSL Item No - Motivation - Remarks - Failure No • FailSim_FailNo
- 7 - - Failure No
- Test Prerequisites - Remarks on Procedure - Remarks on selected failure • FMEA - Function No - Failure No - Signal - Failure Mode - Severity Class - Effect on Module - Effect on LRU - Effect on System • FSL_Item_Prod_Assist - EADS FSL Item No - Prod Tech Assist • FuncNo_HW - Function No - NHL - LRU - Equipment • LoF - Function No - Function Name - Components - Function Description - Equipment Mode - Remarks • Testability Analysis - Failure No - Failure Location - Detected by - Isolated by - Localization to Modules - Localization to LRUs - Detection by CWS - BIT Indication - Test name_test step - Remarks
- CoOp BIT
• Testability Analysis Actual - Failure No - Failure Location - Detected by - Isolated by - Localization to Modules - Localization to LRUs - Detection by CWS
- BIT Indication - Test name_test step - Remarks
- CoOp BIT
- 9 -
Appendix C
Screenshots of the Database Objects
- 11 - The Report in Open View