How to save energy to reach a balance between production and consumption
of heat, electricity and fuels for vehicles
Erik Dahlquist, Iana Vassileva, Eva Thorin, Fredrik Wallin Mälardalen University, Vasteras, Sweden
Abstract: There is a potential to utilize a significant amount of renewable energy in Sweden and EU. Biomass can fulfil some 8 500- 12 500 TWh/y in EU, while the total utilization was 16 084 TWh/y 2009. Even though there is a significant amount of wind power, hydro power and potentially also solar power, it still is most economical to reduce the consumption of heat, electricity and fuels for vehicles. A saved kWh is normally cheaper than to produce one extra. In this paper different opportunities for saving energy will be discussed. This includes manufacturing industries, process industries, power plants and energy systems including distribution of power and smart grids, food production and transportation. There is also a major potential to save energy in buildings, both in the north where it is cold, and in the south where it can be very hot summertime. Here the potential is to avoid cooling instead. Technical solutions as well as economic incentives will be covered. Environmental aspects will be addressed, so that the solutions will be long term sustainable.
Key words: Balances, energy, EU 1. Introduction
There is a major interest to reach a sustainable balance for the whole world as soon as possible to both avoid negative effects of global warming as well as to avoid significant economic problems when the oil and gas resources become scarce and expensive to utilise. We have seen an increasing demand of oil globally for many years while new resources are not found to compensate for this. As the easy to produce oil sources are depleted, the technology to produce more oil will become more and more complex and expensive. This will cause problems for the global economy. If we then instead can change to use renewable energy these problems may be overcome. Still, we are spending a lot of energy in the EU27 and should look for the potential to reduce the consumption of resources as well. As this is normally the most economic action it is also very interesting for the competitiveness of EU27 in the future. In this paper we discuss both the available resources, as well as the potential to increase the amount of useful renewable resources. Also other actions for reductions of consumption are exemplified. We also will discuss different incentives for motivating actions for reduction of consumption as well as for production of electricity without utilising fossil fuels.
2. Energy consumption patterns
In EU27 the distribution between different uses of energy is as seen in table 1 below. The primary energy used to produce this was 16 084 TWh/y according to figures presented by Eurostat [1] . As can be seen the single most important use from a quantitative point of view is transportation. This includes both personal transportation and goods. Transportation also is the type of use consuming most fossil fuels. The second largest use is in industry. Here we have an easier task from the perspective that saving energy also is very often increasing the competitiveness of the industry, although there will be initial investment costs. Energy use in households and service is to a large extent related to heating and cooling of buildings. It is easier to make low energy solutions in when building new, a bit more complicated and expensive in existing ones. Still, individual consumption patterns are showing the potential to save by changing consumption patterns. It is not uncommon that persons with principally the same family situation in neighbouring apartments have differences in consumption with a factor 5 times! In figure 1 below we see some examples from Swedish households. It is from 19 apartments in two buildings in Vasteras, all with two grown-ups in each apartment. This shows that there is a potential also without any rebuilds, if people become aware and see the effect of their use. Buying most
energy efficient equipment here can be very important, as well as shutting off appliances when not in use.
Table 1. Eurostat figures for final energy consumption in TWh/year for EU27, 2007. TWh/year Industry 3755 Transportation 4388 Households 3310 Agriculture 323 Service etc 1689 Total 13465
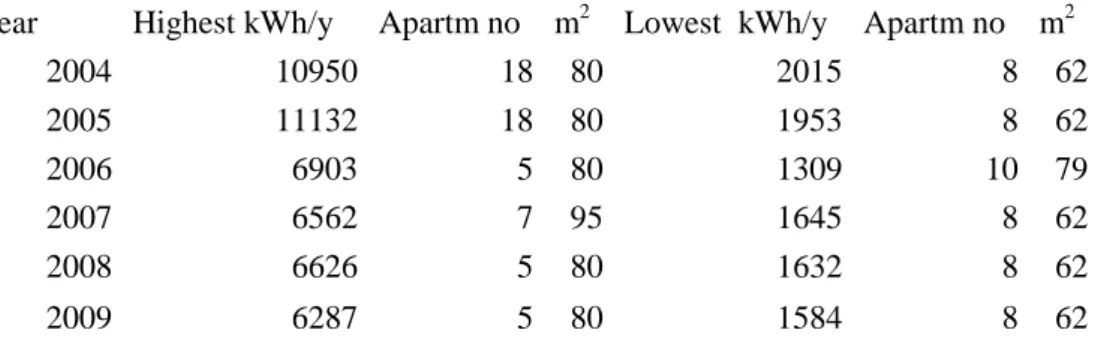
In table 2 we also see the highest and lowest consumption during 2004 – 2009. A questionnaire was sent to the originally 24 apartment owners, although only 19 were answering, and thus are presented in the figure. [2],[3][ Vassileva et al 2010a,2010b]
Figure 1. Electricity consumption in 19 apartments during 2004 – 2009.
During 2004 – 2005 we see a five fold difference in consumption while it is slightly lower,
approximately 4 times, during 2006- 2009. From the questionnaires we can see that there are
no single explanations to the differences. One common feature still seems to be that those who
can afford it consumes more than those having a bit lower household incomes. This may sound
logical, but it is also interesting to note that those who are most interested in energy savings
are those consuming most. This also may be logical, but also promising, as here we have the
highest potential for energy savings. As it is also those having best economic situation, they
can afford buying more efficient appliances.
Table 2. Apartments with highest and lowest total electricity (kWh) consumption, apartment
number and m
2.
Year Highest kWh/y Apartm no m2 Lowest kWh/y Apartm no m2
2004 10950 18 80 2015 8 62 2005 11132 18 80 1953 8 62 2006 6903 5 80 1309 10 79 2007 6562 7 95 1645 8 62 2008 6626 5 80 1632 8 62 2009 6287 5 80 1584 8 62
In figure 2 we see the heating energy for offices as a function of outdoor temperature [4]. These values are for several thousand offices and commercial buildings at central- southern part of Stockholm. It is interesting to see that the heat demand is higher during week days (red) when there are people and computers giving heat compared to week-ends (black) when neither heat source normally are present.
Figure 2. Consumption of heat (kW/kWmax*100) as a function of outdoor temperature in offices in Stockholm city week days (red) respectively week-ends (black).
Figure 2. Consumption of heat (kW/kWmax*100) as a function of outdoor temperature in offices in Stockholm city week days (red) respectively week-ends (black). [Kvarnström et al 2006].
Logically it should be a lower need during week days when every person will give 100 W of heat and each computer roughly the same. The conclusion is that we ventilate so much that we cool the
Out-door temp
oC
Max power kW
buildings and this gives an increased heat demand. With a better control of the ventilation the heat demand could be reduced with some 30 % according to the figures seen in this study.
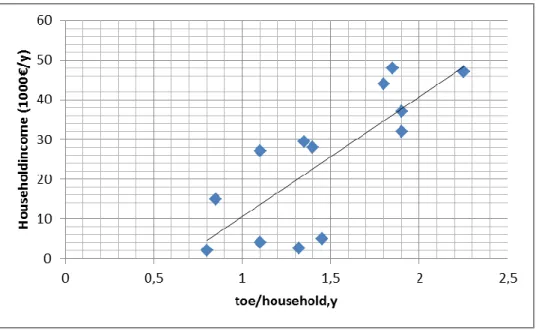
In figure 3 we have a plot of the national income in relation to the per capita energy consumption for a number of EU countries.
Figure 3 Energy consumption as toe/household,year versus income per household as 1000 €/household,year for a number of European countries from [5].
In other cases we get too much heat due to heating through windows summer time or cooling through poor insulation or leakages winter time. By improving these functions it should be possible to reduce the energy demand from in the range 150- 250 kWh/m2, year to < 50 kWh/m2,year for heating the buildings if we look at figures from Scandinavia.
In table 3 we can see how the energy is used for different purposes in EU homes. Roughly 60 % at an average is used for heating, and here the potential savings as shown above could be relevant. This means a potential reduction by some 60%*(1-(50/200))= 45 % of the total household energy if we extrapolate from the discussion from Sweden above. This would mean some 3310 *0.45 = 1490 TWh/y. On the other hand we buy more and more electric apparatus, but hopefully they will be more and more efficient.
Table 3 Split of household energy on different type of means in % in some EU countries 2005 [5]. Country Appliances/lightning Cooking Water heating Space heating
Sweden 17 2 22 59 UK 15 2 22 61 Spain 20 4 33 43 Greece 19 4 7 70 Bulgaria 23 6 6 65 Italy 17 5 8 70
In “the new world” new type of electrical machines and appliances are being used more and more. TV we have had for many years, but now they also becomes wide screen and several in each home. Earlier
we had PCs at the office, but now most families have one or more, and we use them more and more as well. According to [6] TV sets were actively used 3.5 hours and standby 20 hours per day at an average in EU homes. Desktop and laptop PCs were used 4-5 hours/day actively and 8 hours networked
standby. The investigation was made 2004-2006. Altogether this means an increased use of electricity which also gives heat. In warm climates the heat need to be removed, while it is a basically inefficient use of electric heating also in cold climates if you are not depending on direct electric heating.
One factor of very high importance for electricity consumption is the lightning. By replacing wire lamps and fluorescence lamps with LED-lamps we could save some 100- 150 TWh/y, depending on the time the lights are on. There are no exact figures for this, but as we can see from table 3 lightning is approximately 10-15 % of all energy use in households, and it is even higher in offices and services. Generally LED lamps will consume 50% of the corresponding fluorescence lamp, and 10% of the wire lamp. As the wire lamps still are 30 % of all lamps, the reduction figures above can be reasonable.
Another aspect that is important for us all is the wasting of food. Investigations in the UK indicate some 30% wasting, while some Swedish investigations indicate 10-20%, but probably 20% is more correct. If we can reduce the wasting by better logistics and control of the storage this could probably reduce the energy consumption by some 10%. This would mean some 150-200 TWh/y, as the energy in the food is approximately 1000- 1300 TWh/y + 500- 650 TWh/y for the production, or 1500- 1950 TWh/y altogether.
3. Transportation
For transportations the higher price on oil products is giving a significant incentive to reduce consumption, but here also the risks for global warming drives the authorities to increase taxes as well. Another tool is subsidies for fossil fuels free alternatives like electric vehicles, although this demands fossil fuel free electricity production as well.
According to [7] ACEA, European Automobile Manufacturer´s Association 87 % of the cars are private cars.63.8 % are having gasoline-engines, 33.7 % diesel and 2.7 % others. The power has increased from 60 to 85 kW at an average between 1990 and 2008, but was 83 kW in 2010.
In a report Enerdata [8] presents different scenarios for oil consumption and renewables for transportation. For 2007 we have a base consumption of 58.8 g oil/km, 2010 55.6 g oil/km. For plug-in-hybrids this is given to be 27.1 g oil equivalents/km, from which 18.2 as oil, the rest as electricity. For pure electric vehicle the assumption is calculated to be 12.1 g oil equivalents/km with an average electricity production mix for EU.
The total “road consumption” for EU 27 then would be 292 Million tonne oil equivalents (Mtoe) from which cars 167 and light trucks 42. In Enerdata´s base scenario the total consumption would still be 284 Mtoe 2030, but where they believe it could be possible to reduce the total consumption to 237 Mtoe, from which 16 Mtoe from electric and 16 Mtoe from bioenergy + hydrogen.
We believe these figures are far too conservative. Instead there should be only plug-in-hybrids and electrical vehicles by 2030. When the new technology has been accepted it will take over totally, as it will reduce the cost for fuel significantly. As approximately 70% of the travels are shorter than 50 km we can assume 70% electric and 30% fossil fuel of all travels. This would mean 292 * (0.7*12/58.8 + 0.3 *27/58.8) = 82 Mtoe 2030, and the actual fuel then should have biomass origin and not oil. The biomass can be converted to biogas, ethanol, bio-diesel or similar. This means a reduction from approximately 2920 TWh/y to 820 TWh/y for transportations related to personal transport (- 72%).
The transportation of goods will be a bit more difficult to reduce as far, but the potential should be at least some 30-40 %, if more transportation is done using railway transports and new plug-in-hybrids also for trucks.
4. Consumption reduction in industry
In table 4 the reduction potential in different industries are seen. These are our own estimates from different studies we have done earlier[9]. Here the driving force is to increase the profitability, and higher energy prices thus will drive the reduction directly. For both non-ferrous and ferrous industries the major potential for savings is to reduce scrapping. This can be done by better automation and control all the way from casting over formation to use in different applications. If we have a rough surface we need to grind this to smoothen it. The edges often have different properties than the bulk, and thus are cut off. By controlling these properties better we can reduce the scrapping by at least 10-20%. Of course it is not an easy task. If it had been, it would already have been done. But just because it is difficult, it also will give the ones who can control it a strong competitive edge and thus strong incentives should exist.
Table 4. Reduction potential in different heavy industries in EU TWh/y
Non Ferrous Metal 15
Ferrous metal 250
Cement industry 30
Pulp mills 30-50
Paper mills HC formation 28-45
Lime kilns 7
Total savings potential 310-340
For cement industry we also have strong advantages with better control. This includes the temperature distribution and the heat transfer in rotating respectively down draft reactors. For cement furnaces the task is easier as we don´t need to consider the risk of sintering, which is otherwise a risk for lime in pulp mills. In both cases the risk for ring formation is a problem, and should be avoided. For cement industry we also see a vast potential to use biomass and waste instead of fossil fuels.
For pulp mills there is a significant potential to reduce the primary steam consumption by using the steam more efficiently. By better control and add-ons of new heat exchanger area this can be achieved. More evaporation steps, optimal dosage of chemicals and optimal heat profile in the digester as a function of the wood quality are some actions to fulfil this. In the paper mill we today normally dilute the fibre suspension to some 0.5 % DS. By increasing this to 5% the amount of water to handle would be reduced from 200 m3/tonne fibre to 20 m3/tonne fibre. This High Consistency (HC) formation will give a significant reduction of energy losses but also reduce the amount of chemicals needed in the processing, and give a reduction of water treatment problems.
All together this would mean reductions in the range 310-340 TWh/y. If we would add other industries like chemical industry, food and electronics, this would increase even bit further, although we haven´t addressed these industries specifically in this paper.
5. Energy resources and electric power production from renewable energy resources
There are many different renewable energy sources available in Europe. The most important one is biomass, as this gives us an opportunity to store the energy in an efficient way. If we make a rough estimate of the available biomass resources from agriculture and forestry we end up at some 8 500 –
12 500 TWh/y for EU 27. This is under the assumption that we have a total production of 10-15 ton DS/ha,year for agriculture crops and 1.9 - 2.5 ton DS/ha,year for the forestry. These figure are the actual figures for cereals respectively forestry in Sweden and Northern Europe, but should be reasonable also for the rest of EU27. For cereals it includes both the grain and the straw, although figures normally only are given in statistics for the grain. With these assumptions we get a total biomass production of 6900 -10 400 TWh/year from agriculture and 1600 - 2100 TWh/year from forestry. The biomass can be used in many different ways: for electricity, vehicle fuels and for heating and process energy purpose. Also it is a raw material for paper and potentially plastics, chemicals etc. Of course also the most important function is as food and fodder. The conversion of biomass can be by combustion, gasification, fermentation, pyrolysis, torrefaction or digestion, but we will not discuss all these possibilities in this paper.
Aside of the biomass we also have a huge potential for wind power.
European Wind Energy
Association (EWEA), launched a new report recently, "EU Energy Policy to 2050" [10]. Here
they claim that wind power could produce 28.5 % of the electricity demand in EU by 2050,
and 14 % of the demand by 2020. This is according to EWEA President Arthouros Zervos
referring to the Member States' National Renewable Energy Action Plans.
9.3 gigawatt (GW) of new wind power capacity was installed in the EU during 2010, reaching
a total of 84 GW by the end of 2010, according to figures released by the European Wind
Energy Association (EWEA). While offshore wind power installations grew by 51% from 582
MW in 2009 to 883 MW last year, onshore wind power installations (8.4 GW) were down
13.9% compared to 2009 (9.7 GW). Still we have to be aware of the fact that the wind is not
blowing all the time. It can be design winds perhaps 30% of the year in off-shore installations,
while only 10-20 % in inland installations, depending on where the wind power plant is
situated. The 84 GW could give some 150 – 200 TWh/y while the production could be around
1000 TWh/y by 2030 according to the development plans presented by different wind
companies. In Sweden the national goal is 30 TWh/y and 15 GW by 2030, but already today
wind power companies are projecting for 105 TWh/y only in Sweden!
In terms of annual installations, Spain was the largest wind power market in 2010, installing
1,516 MW, compared to Germany’s 1,493 MW. France was the only other country to install
over 1 GW (1,086 MW), followed by the UK (962 MW) and Italy (948 MW). Sweden (604
MW), Romania (437 MW), Poland (382 MW), Portugal (363 MW) and Belgium (350 MW).
All these figure are from Eurostat 2010 [1].
A third major potential energy resource is the direct solar power. In 2010 12 GW Solar PV
capacity was installed (21.7% of total capacity of new production in EU). This is remarkable
as it is significantly more than the wind with 9.3 GW (16.7%), 4,056 MW (7.3%) of coal, 573
MW (1%) of biomass, 405 MW (0.7%) of CSP , 208 (0.4%) of large hydro, 200 MW (0.4%)
of peat, 149 MW (0.3%) of waste, 145 MW (0.3%) of nuclear, 25 MW of small hydro, 25 MW
of geothermal, and zero MW of tidal and wave capacity were installed. The installation of
fossil gas fuelled plants was 28 GW, representing 51% of total new installed capacity. It
should be noted that all these figures are installed capacity for electric power, and it relates to
maximum capacity, and not average values. Still, it shows where we are heading. In Portugal
the wind power contributed to 101 % of all electricity production November 2009 – February
2010 according to a presentation at WREC in Abu Dhabi in September 2010. This shows that
the renewable energy resources are of high importance already today, and not only future
possible technologies. The installed capacity long term will depend on both cost for PV cells
and how the power versus energy can be handled. With new business models we could
redistribute the load to time when it is sunny and windy, and thus the benefits with both wind
and solar power will be optimal.
Other major resources for electric power production are hydro power and nuclear power. In
table 5 we can see that they are almost of the same capacity; nuclear 127 GW and large hydro
121 GW and small scale hydro 5 GW. The total installed capacity of solar power using PV
cells is 25 GW, while concentrating solar power (CSP) has a capacity today of 0.4 GW.
Table 5. Electric power production by different means in EU 27 at the end of 2010 by Eurostat [2010] [1]. Large hydro 14% (120,578 MW) Wind 10% (84,278 MW) PV 3% (25,300 MW) Biomass 1% (5,851 MW) Small Hydro 1% (4,843 MW) Waste < 1% (3,703 MW) Geothermal < 1% (1,466 MW) CSP < 1% (435 MW) Tidal & wave < 1% (245 MW) Coal 26 % (231,050 MW) Fossil gas 24 % (212,131 MW) Nuclear 15% (127,383 MW) Fuel oil 6% (54,735 MW) Peat < 1% (2,030 MW)
From the figures we can see that already today non-fossil fuel technologies make up 43 % of the production capacity, if we include the nuclear power. If we were using biomass also for electric power production, we could already today be independent of fossil fuels if we could balance the demand and the production capacity in a good way. At least this would be possible if we were using energy in a more efficient way.
If we just look at the electric energy production it was 3400 TWh 2007 [11]. 29.5 % was from nuclear power, 20.1 from natural gas, 18.3 from coal + oil, 10.2 % from hydro, 2.7 from biomass and 2.4 from wind power. This means 44.8 % was from non-fossil resources and 15.3% from “true” renewable resources.
6. Different type of incentives
There are many different possibilities to reduce energy use in all areas – industry, households and transportations. Some actions demand significant technical development, while others more has a demand for concrete incentives to achieve the reduction using existing technologies.
Incentives can be both economic like taxes, subsidies and different regulatory actions, as well as creating an awareness of the need for reducing consumption from a societal and environmental perspective.
It can be interesting to see what the impact of different actions have been historically [12]. After the nuclear power referendum 1980 in Sweden the politicians were talking a lot about a transfer to renewable energy in different forms. Still, no economic incentives were implemented, and nothing really happened. So in 1992 an agreement was made to introduce a carbon tax for fossil carbon. It was 1.6 c€/kWh, and within 15 years the use of biomass increased from approximately 55 TWh/y to 132
TWh/y in 2010. Also the technical development has been strong as a function of economic incentives. There has been a subsidy for wind power by reduced taxes, which has made this technology expanding a lot, and as we mentioned earlier new capacity around 105 TWh/y is projected today in Sweden. With the right incentives, and this normally means economic incentives, new production can be increased.
Concerning saving energy the incentives are different. Here Sweden had a very good example where industries could reduce tax if they made investments to save energy. The higher price as such also gives positive results, although the industrialists normally complain a lot about how negative high electricity price is on economically competitiveness. Actually there are huge potentials for energy savings in industry and all other sectors as described earlier, if just the economic incentive is there. Differentiated price depending on the actual production capacity will most probably be more common in the future when we have much more solar and wind power. This also will follow the expansion of the electric grid as well as automation to fulfil the load shedding and similar to follow the actual price continuously. In the future it may be that we will see much more local or regional prices changing within a few hours due to problems to supply power, and an automatic reaction to this depending on what type of agreement you have signed with your power supplier and perhaps also the distributor. Perhaps we will see something like the Google algorithm used to analyse local patterns on-line. The future may be very different from what we have been used to!
7. Discussion and conclusions
If we now try to summarize we can first see that today´s primary energy use was 16 084 TWh/y 2009 and the actual consumption 13465 TWh/y in EU27. At the same time we concluded that we have available biomass resources in the range of 8 500 – 12 500 TWh/y for EU 27. Wind power is already today producing some 100 TWh/y but with a potential for at least 1000 TWh/y, and for solar power we could have a potential production of several hundred TWh/y within some 20 years. Hydro power is today 10.2 of the total 3400 TWh/, that is 350 TWh/y, while nuclear is 29.5% or 1000 TWh/y. If we accept nuclear as a non-fossil resource the available renewable resources would be (8500- 12500) biomass + (100-1000) wind + (5- 200) solar + 350 hydro + 1000 nuclear = 9 955 – 15 050 TWh/y.
If we then summarize the potential savings these will add up as follows: buildings (1490) + lightning (100-150) + reduced food waste (150-200) + transportations (2100) + heavy industry (310-340) = 4150 – 4280 TWh/y. If we reduce this from the present 16 084, we end up at 11 800 – 11 900 TWh/y gross energy. This is somewhere in the middle of the production span, and shows that the feasibility to become energy independent for EU27 is quite significant. Of course we also have to look for environmentally good solutions for the biomass production as well as for the installations of new power plants of all kinds, but this will have to be discussed somewhere else.
Acknowledgements
We would like to give our regards to Swedish Energy Agency who have been giving financial support. We also want to thank Mimer, Mälaranergi, Kommunfastighet, Eskilstuna energy and environment, Logica, Sustainable Innovations and ABB for participation in the different projects discussed in the paper.
References
[1] Eurostat (2010): Statistical pocketbook 2010, EU commission:
http://ec.europa.eu/energy/publications/statistics/statistics_en.htm . 2010
.
[2] Vassileva I, Dahlquist E (2010a): Analytical comparison between electricity consumption
and behavioral characteristics of Swedish households in rented apartments; International
Conference on Applied Energy, April 21-23, 2010, Singapore
[3] Vassileva I, Wallin F, Dahlquist E, Roots P (2010b): The relation between consumption of
electricity and hot water and different consumer variables. Practicing Science and Technology,
Performing the Social, September 2-4, 2010, Trento, Italy.
[4] Kvarnström J.,Dotzauer E, Dahlquist E.: Production and distribution planning of district
heating. Varmeforsk report no 990, Dec 2006. In Swedish.
[5] Bosseboeuf D. (editor): Energy efficiency trends and policies in the household & tertiary
sectors in the EU27, November 2009, ODYSSE project report.
http://www.odyssee-indicators.org/publications/publications.php
[6] Schlomann B. (editor): Energy efficiency trends of IT appliances in housholds EU27 , ODYSSEE – MURE project, Frauenhofer institute, Karlsruhe, September 2009.
[7] ACEA, European Automobile Manufacturer´s Association
http://www.acea.be/index.php/collection/statistics, 2011
[8] Enerdata: The impact of lower oil consumption in Europe on world oil prices. February 2, 2009.
www.enerdata.fr ,

![Table 5. Electric power production by different means in EU 27 at the end of 2010 by Eurostat [2010]](https://thumb-eu.123doks.com/thumbv2/5dokorg/4691499.123060/8.898.107.369.308.574/table-electric-power-production-different-means-eu-eurostat.webp)
