aggregated electric vehicle
loads in the low voltage grid
ko los C U R R EN T H A R M O N IC M O D EL IN G O F A G G R EG A TE D E LE C TR IC V EH IC LE L O A D S I N T H E L O W V O LT A G E G R ID 202 1 ISBN 978-91-7485-494-7 ISSN 1651-9256
Address: P.O. Box 883, SE-721 23 Västerås. Sweden Address: P.O. Box 325, SE-631 05 Eskilstuna. Sweden E-mail: info@mdh.se Web: www.mdh.se
Power Quality (PQ), in terms of harmonic distortion. The emissions
from individual EV, are well regulated by current harmonic emission
standards. But what the aggregation of multiple EV loads will look
like is still uncertain and the research being made in this area is still
in its early stage.
The DSO responsibilities include ensuring grid code compliance
confirmed by PQ metering. In general, 10 minute RMS values are
sufficient. However, the large scale integration of non-linear loads,
like EVs, could lead to new dynamic phenomena, possibly lost in
the process of time aggregation.
In this thesis PQ and, in more detail, the concept of harmonics, and
how this is related to EVs, is presented. A current-harmonic load model
using power exponential functions and built from actual
measure-ment data during the individual charging of four different fully
elec-tric vehicles was constructed. The model was based on individual
emitted current harmonics as a function of state of charge (SOC),
and was used to deterministically simulate the simultaneous
charg-ing of six vehicles fed from the same bus. The aggregation of current
harmonics up to the 11th was simulated while randomizing battery
SOC, the start of charging, and the kind of vehicle. Additionally, an
investigation of the impact on aggregation in time was conducted.
The analysis clearly shows the importance of phase angle
informa-tion, its correlation to SOC, and how the aggregation of EV loads is
influenced by these factors. The analysis also shows that 10 minute
RMS aggregation could lead to significant deviations from the
“ac-tual” (200ms) data. This indicates that 10 minute value monitoring
could lead to information losses.
Mälardalen University Press Licentiate Theses No. 302
CURRENT HARMONIC MODELING OF AGGREGATED
ELECTRIC VEHICLE LOADS IN THE LOW VOLTAGE GRID
Georgios Foskolos 2021
School of Business, Society and Engineering
Mälardalen University Press Licentiate Theses No. 302
CURRENT HARMONIC MODELING OF AGGREGATED
ELECTRIC VEHICLE LOADS IN THE LOW VOLTAGE GRID
Georgios Foskolos 2021
Copyright © Georgios Foskolos, 2021 ISBN 978-91-7485-494-7
ISSN 1651-9256
Printed by E-Print AB, Stockholm, Sweden
Copyright © Georgios Foskolos, 2021 ISBN 978-91-7485-494-7
ISSN 1651-9256
“Time moved in two directions because every step into the future carried the memory of the past”
Paul Auster
Impossible without Boel, Love, Birger & Nora
“Time moved in two directions because every step into the future carried the memory of the past”
Paul Auster
Impossible without Boel, Love, Birger & Nora
iv
Acknowledgements
I would like to thank my supervisor Prof. Erik Dahlquist, my co-supervisor Dr. Fredrik Wallin and my company mentor Torbjörn Solver for their continuous support over the past years. I would also like to thank my close colleagues at Mälarenergi Elnät AB “grid planning” department for guiding me through the world of electricity distribution and company activities. Surely we have had some great times between working hours as well!
A very special thanks to my former colleague Dr. Tokhir Gafurov for his guidance and support in my academic struggles. Your heart is truly in the right place!
I would also like to thank my parents for their support throughout my life. Last, but certainly not least, I would like to thank my beloved wife Nora for being a partner in crime and taking the edge off when things appeared to be hopeless.
This thesis is based on the work conducted within the industrial post-graduate school Reesbe – Resource-Efficient Energy Systems in the Built
Environment. The projects in Reesbe are aimed at key issues in the interface
between business responsibilities of different actors in order to find common solutions for improving energy efficiency that are resource-efficient in terms of primary energy and low environmental impact.
The research groups that participate are Energy Systems at the University of Gävle, Energy and Environmental Technology at the Mälardalen University, and Energy and Environmental Technology at the Dalarna University. Reesbe is an effort in close co-operation with the industry in the three regions of Gävleborg, Dalarna, and Mälardalen, and is funded by the Knowledge Foundation (KK-stiftelsen).
Västerås, Sweden, in January 2021 Georgios Foskolos
vi
Summary
About a quarter of all energy-related greenhouse gas emissions can be attributed to the transport sector. In order to meet the objectives of the Paris Declaration on Electromobility and Climate Change, which require at least 20% of all road transport vehicles globally to be electrically powered by 2030, the deployment of electric vehicles (EVs) is necessary.
Political frameworks and environmental awareness are both driving forces that have led to great growth in EVs, both globally and nationally. In Sweden, the annual growth since 2016 has been more than 50%. Last 12 months the growth has actually been more than 80% and at present (January 2021), there are more than 180 000 chargeable vehicles in the Swedish vehicle fleet. The forecast from Power Circle (an interest group for the electric power industry) states that this volume in 2030 will be over 2 500 000.
This development can however have negative effects on the electrical distribution network, e.g. increased peak power, and increased losses, power quality issues and overloading of transformers.
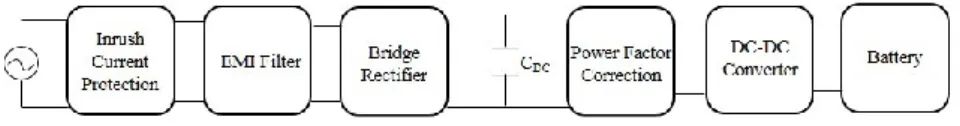
In this work one of these potential problems has been studied - an area within power quality called harmonics. This problem is a consequence of the fact that batteries within EVs are charged with direct current (DC), provided by the rectifier, which converts alternating current (AC) to DC. During this process, the power electronic circuit of the rectifier and its control strategies will cause a distortion of the charging current which in turn may cause distortion in the supply voltage. Since different manufacturers have different rectifiers and control strategies, the harmonics will vary and therefore the combination of different EVs will vary too.
This work presents a measurement-based current harmonic model, which has been used to simulate the multiple EV charging. The model has also been used to evaluate the effects of aggregation in time, that is, what happens when the original 200 ms values are aggregated to 3s, 1 min and 10 min values. The analysis shows how battery state-of-charge and the type of vehicle will
vi
Summary
About a quarter of all energy-related greenhouse gas emissions can be attributed to the transport sector. In order to meet the objectives of the Paris Declaration on Electromobility and Climate Change, which require at least 20% of all road transport vehicles globally to be electrically powered by 2030, the deployment of electric vehicles (EVs) is necessary.
Political frameworks and environmental awareness are both driving forces that have led to great growth in EVs, both globally and nationally. In Sweden, the annual growth since 2016 has been more than 50%. Last 12 months the growth has actually been more than 80% and at present (January 2021), there are more than 180 000 chargeable vehicles in the Swedish vehicle fleet. The forecast from Power Circle (an interest group for the electric power industry) states that this volume in 2030 will be over 2 500 000.
This development can however have negative effects on the electrical distribution network, e.g. increased peak power, and increased losses, power quality issues and overloading of transformers.
In this work one of these potential problems has been studied - an area within power quality called harmonics. This problem is a consequence of the fact that batteries within EVs are charged with direct current (DC), provided by the rectifier, which converts alternating current (AC) to DC. During this process, the power electronic circuit of the rectifier and its control strategies will cause a distortion of the charging current which in turn may cause distortion in the supply voltage. Since different manufacturers have different rectifiers and control strategies, the harmonics will vary and therefore the combination of different EVs will vary too.
This work presents a measurement-based current harmonic model, which has been used to simulate the multiple EV charging. The model has also been used to evaluate the effects of aggregation in time, that is, what happens when the original 200 ms values are aggregated to 3s, 1 min and 10 min values. The analysis shows how battery state-of-charge and the type of vehicle will
influence the aggregation and also why phase angle measurements are important. The evaluation of aggregation in time also shows that 10 min value monitoring will result in information losses.
influence the aggregation and also why phase angle measurements are important. The evaluation of aggregation in time also shows that 10 min value monitoring will result in information losses.
viii
Swedish summary
Cirka en fjärdedel av alla energirelaterade växthusgasutsläpp kan tillskrivas transportsektorn. För att uppfylla målen i Parisdeklarationen om elektromobilitet och klimatförändringar som ställer krav på att minst 20 % av alla vägtransportfordon globalt måste drivas elektriskt fram till 2030, är utbredningen av elfordon nödvändig.
Politiska ramverk och miljömedvetenhet är båda drivkrafter som har lett till en stor tillväxt av elbilar, både globalt och nationellt. I Sverige har den årliga tillväxten sedan 2016 varit mer än 50 %. De senaste 12 månaderna har tillväxten varit så hög som 80 % och för närvarande (januari 2021) finns det mer än 180 000 laddbara fordon inom den svenska fordonsflottan. Prognosen från Power Circle (en intressegrupp för elkraftindustrin) anger att denna siffra år 2030 kommer att vara över 2 500 000.
Denna utveckling kan dock ha negativa effekter på det elektriska distributionsnätet t.ex. ökad toppeffekt, ökade förluster, elkvalitétsproblem och överbelastning av transformatorer
I detta arbete har ett av dessa potentiella problem studerats- ett område inom elkvalitét som kallas övertoner. Övertoner är en följd av att batterier i elbilar laddas med likström (DC), som levereras av likriktaren, vilken omvandlar växelström (AC) till DC. Under denna process kommer likriktarens kraftelektroniska krets och dess styrning att orsaka en distorsion av laddströmmen som i sin tur kan orsaka distorsion i matarspänningen. Eftersom olika tillverkare har olika likriktare och kontrollstrategier, kommer övertonerna att variera och därför kommer också sammanlagringen av olika elbilar att variera.
Detta arbete presenterar en mätbaserad strömövertonsmodell, som använts för att simulera multipla elbilsladdningar. Modellen har också använts för att utvärdera effekterna av aggregering i tid, det vill säga, vad som händer när de ursprungliga 200 ms-värdena aggregeras till 3s, 1 min och 10 min värden.
Analysen visar att både elbilstyp och batteriets laddningstillstånd kommer påverka aggregeringsresultatet och också varför strömövertonens fasvinkel är av betydelse. Analysen av tidsaggregering visar även på att 10 minuters värden kommer leda till ett väsentligt informationsbortfall.
.
Analysen visar att både elbilstyp och batteriets laddningstillstånd kommer påverka aggregeringsresultatet och också varför strömövertonens fasvinkel är av betydelse. Analysen av tidsaggregering visar även på att 10 minuters värden kommer leda till ett väsentligt informationsbortfall.
.
x
List of papers
Publications included in the thesis
This thesis is based on the following papers, which are referred to in the text by their roman numerals:
I. Foskolos, G. (2020) Measurement-based current-harmonics modeling of aggregated electric-vehicle loads using power-exponential functions. World Electric Vehicle Journal, 11(3), 51 II. Foskolos, G. and Lundengård, K. (2020) The impact of
aggregation interval on current harmonic simulation of aggregated electric vehicle loads, ICHQP 2020 March 22-25, Dubai, United Arab Emirates
The author’s contribution to the included
publications
I. Karl Lundengård has assisted in the model construction. All other work has been made by the author of this thesis
II. Karl Lundengård has helped in the model construction and some related writing. All other work has been made by the author of this thesis
Publications not included in the thesis
I. Foskolos, G., Lennerhag, O. and Ackeby, S. (2018) Evaluation of conservation voltage reduction in a distribution grid – a comparison based method. 53rd International Universities Power Engineering Conference (UPEC), September 2018, pp.1-5 II. Lennerhag, O., Pinares, G., Bollen, M., Foskolos, G. and Gafurov,
T. (2017) Performance indicators for quantifying the ability of the grid to host renewable electricity production. CIRED - Open Access Proceedings Journal, Vol.2017(1), pp.792-795
III. Lennerhag, O., Ackeby, S., Bollen, M., Foskolos, G. and Gafurov, T. (2017) Using measurements to increase the accuracy of hosting capacity calculations. CIRED - Open Access Proceedings Journal, Vol.2017(1), pp.2041-2044
Contents
Acknowledgements ... iv
Summary ... vi
Swedish summary ... viii
List of papers ...x
List of figures ...xv
List of tables ... xvi
Abbreviations ... xvii
1 INTRODUCTION ...1
1.1 Aims and objectives ...3
1.2 Thesis structure ...4
2 POWER QUALITY ...5
2.1 Electromagnetic compatibility ...7
2.2 Power Quality Defects ...7
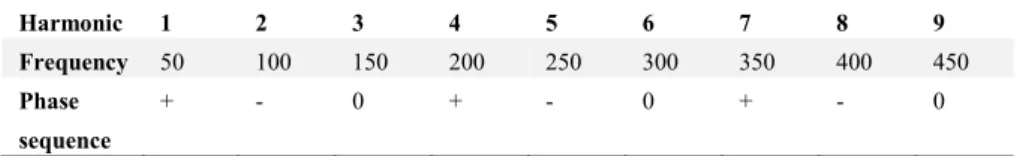
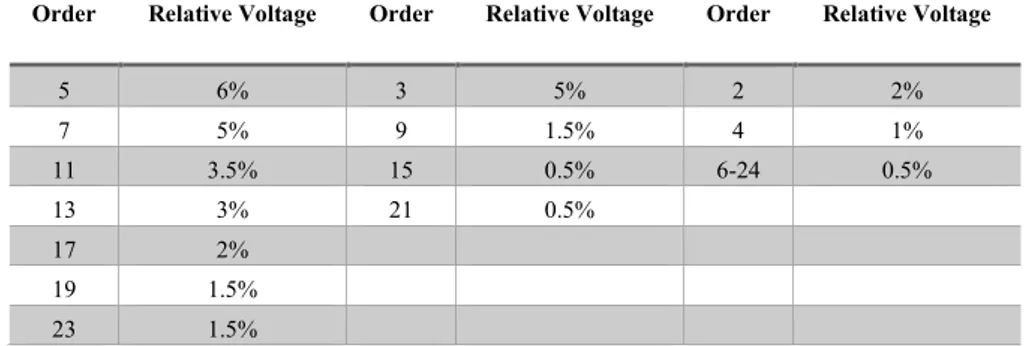
2.2.1 Voltage variations ...8 2.2.2 Unbalance ...9 2.2.3 Voltage dips ...10 2.2.4 Voltage swells ...10 2.2.5 Flicker ...11 2.2.6 Transients ...11 2.3 Harmonics ...12 2.3.1 Fourier series...12 2.3.2 Fourier coefficients ...14 2.3.3 Phase sequence ...15 2.3.4 Harmonic indices ...16
2.3.5 Point of common coupling ...16
2.3.6 Harmonic sources ...17
2.3.7 Harmonic distortion consequences ...17
2.3.8 Harmonic reduction techniques ...19
Contents
Acknowledgements ... ivSummary ... vi
Swedish summary ... viii
List of papers ...x
List of figures ...xv
List of tables ... xvi
Abbreviations ... xvii
1 INTRODUCTION ...1
1.1 Aims and objectives ...3
1.2 Thesis structure ...4
2 POWER QUALITY ...5
2.1 Electromagnetic compatibility ...7
2.2 Power Quality Defects ...7
2.2.1 Voltage variations ...8 2.2.2 Unbalance ...9 2.2.3 Voltage dips ...10 2.2.4 Voltage swells ...10 2.2.5 Flicker ...11 2.2.6 Transients ...11 2.3 Harmonics ...12 2.3.1 Fourier series...12 2.3.2 Fourier coefficients ...14 2.3.3 Phase sequence ...15 2.3.4 Harmonic indices ...16
2.3.5 Point of common coupling ...16
2.3.6 Harmonic sources ...17
2.3.7 Harmonic distortion consequences ...17
xiv
2.4 Power quality standards ... 19
2.4.1 EN 50160 ... 20
2.4.2 Applicable IEC standards ... 20
3 ELECTRIC VEHICLES ... 23
3.1 Electric vehicles and harmonics ... 26
4 MATHEMATICAL MODELLING ... 29
4.1 Measurements and modelling data ... 30
4.2 Summation coefficients ... 35
5 RESULTS ... 37
5.1 Measurement results... 37
5.2 Aggregated EV loads ... 41
5.3 Aggregation in time... 43
6 DISCUSSION AND CONCLUSION ... 47
7 FUTURE WORK ... 49
REFERENCES ... 52
PAPERS ... 59
xiv 2.4 Power quality standards ... 19
2.4.1 EN 50160 ... 20
2.4.2 Applicable IEC standards ... 20
3 ELECTRIC VEHICLES ... 23
3.1 Electric vehicles and harmonics ... 26
4 MATHEMATICAL MODELLING ... 29
4.1 Measurements and modelling data ... 30
4.2 Summation coefficients ... 35
5 RESULTS ... 37
5.1 Measurement results... 37
5.2 Aggregated EV loads ... 41
5.3 Aggregation in time... 43
6 DISCUSSION AND CONCLUSION ... 47
7 FUTURE WORK ... 49
REFERENCES ... 52
List of figures
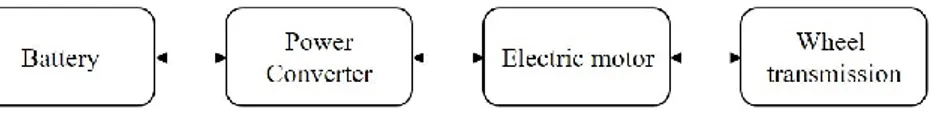
Figure 1: Accumulated chargeable private cars (per year in Sweden). [15] ... 2 Figure 2: Balanced three-phase AC voltage (or current) ... 5 Figure 3: Voltage variations categorization (taken from [5] ) ... 8 Figure 4: Example of a waveform and the corresponding spectra of individual harmonics described as % of voltage fundamental .. 13 Figure 5: Block diagram of an EV powertrain system ... 23 Figure 6: Block diagram of EV charger unit, where CDC is the DC link capacitor ... 24 Figure 7: Yokogawa WT3004E ... 30 Figure 8: Grid configuration ... 31 Figure 9: EV1 3rd current harmonic 200ms polar plot (SOC 20-100%) .. 38 Figure 10: EV1 3rd current harmonic – magnitude (blue), phase angle (red) and SOC as the vehicle is being fully charged from 20-100% SOC ... 38 Figure 11: 3rd current harmonic polar plots a) EV2 b) EV3 c) EV4 ... 39 Figure 12: Current harmonic IEC 61000-3-12 limits and measured values 40 Figure 13: Current harmonic Class A IEC 61000-3-2 limits and measured values ... 40 Figure 14: 3rd current harmonic polar plots for different aggregation intervals... 46
List of figures
Figure 1: Accumulated chargeable private cars (per year in Sweden). [15] ... 2 Figure 2: Balanced three-phase AC voltage (or current) ... 5 Figure 3: Voltage variations categorization (taken from [5] ) ... 8 Figure 4: Example of a waveform and the corresponding spectra of individual harmonics described as % of voltage fundamental .. 13 Figure 5: Block diagram of an EV powertrain system ... 23 Figure 6: Block diagram of EV charger unit, where CDC is the DC link capacitor ... 24 Figure 7: Yokogawa WT3004E ... 30 Figure 8: Grid configuration ... 31 Figure 9: EV1 3rd current harmonic 200ms polar plot (SOC 20-100%) .. 38 Figure 10: EV1 3rd current harmonic – magnitude (blue), phase angle (red) and SOC as the vehicle is being fully charged from 20-100% SOC ... 38 Figure 11: 3rd current harmonic polar plots a) EV2 b) EV3 c) EV4 ... 39 Figure 12: Current harmonic IEC 61000-3-12 limits and measured values 40 Figure 13: Current harmonic Class A IEC 61000-3-2 limits and measured values ... 40 Figure 14: 3rd current harmonic polar plots for different aggregation intervals... 46
xvi
List of tables
Table 1: Phase sequence of harmonics in balanced three-phase system 15 Table 2: Individual harmonic voltage limits according to EN 50160 20 Table 3: Harmonic current emissions for ≤ 16 A loads as per IEC
61000-3-2 21
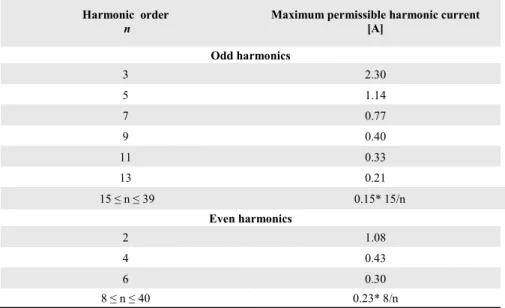
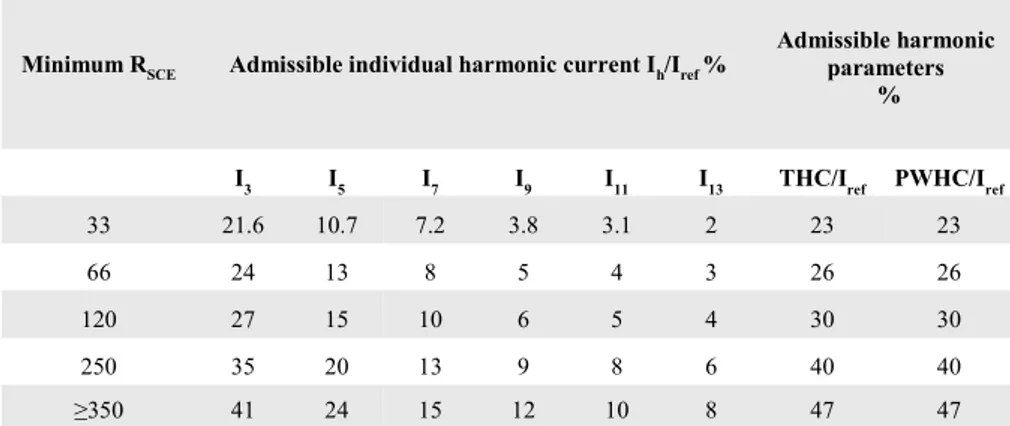
Table 4: Harmonic current emissions for >16 A loads as per IEC
61000-3-12 22
Table 5: Technical and measurement data of EVs included in the study 31
Table 6: Summation coefficients for harmonics 35
Table 7: Current harmonic data EV1- EV4 39
Table 8: 3rd -11th 200ms aggregated current harmonic results 42 Table 9: Time aggregated simulation results for current harmonic 3, 5 and
7 44
Table 10: Time aggregated simulation results for current harmonic 9 & 11 45
xvi
List of tables
Table 1: Phase sequence of harmonics in balanced three-phase system 15 Table 2: Individual harmonic voltage limits according to EN 50160 20 Table 3: Harmonic current emissions for ≤ 16 A loads as per IEC
61000-3-2 21
Table 4: Harmonic current emissions for >16 A loads as per IEC
61000-3-12 22
Table 5: Technical and measurement data of EVs included in the study 31
Table 6: Summation coefficients for harmonics 35
Table 7: Current harmonic data EV1- EV4 39
Table 8: 3rd -11th 200ms aggregated current harmonic results 42 Table 9: Time aggregated simulation results for current harmonic 3, 5 and
7 44
Table 10: Time aggregated simulation results for current harmonic 9 & 11 45
Abbreviations
AC Alternating current BEV Battery electric vehicle CSC Cell supervision circuit DC Direct Current
DSO Distribution System Operator EMC Electromagnetic Compatibility EMI Electromagnetic Interference
EV Electric vehicle (in this work this refers to fully electric vehicles FACTS Flexible AC Transmission Systems
HEV Hybrid electric vehicle HVDC High voltage direct current ICE Internal combustion engine vehicle IEC International Electrotechnical Commission PCC Point of common coupling
PLL Phase locked loop PQ Power Quality RMS Root mean square
SMPS Switch Mode Power Supply SOC State-of-charge
TDD Total distortion demand THD Total harmonic distortion TSO Transmission system operator V2G Vehicle-to-Grid
1
Introduction
Electrifying the transport sector is one of the most promising technologies to reduce greenhouse gas emissions. Apart from minimizing tailpipe emissions electric vehicles (EVs) could also improve energy security by diversifying energy sources and foster economic growth by creating new advanced industries. EVs have more efficient power trains than internal combustion engine vehicles (ICEVs). To put it simple, the performance of an EV outstands the performance of ICEV. With that being said, the continuous development of EV technologies – mainly power train and battery performance – are crucial factors to ensure competitiveness. EVs still have a limited driving range due to limitations in current electrical storage technologies – the energy and power density of batteries compared to conventional liquid fuels is low – and the recharging time is, by far, longer than refueling a tank. Charging infrastructure and public awareness of benefits are other influencing factors. But, in the end, it all comes down to the price tag. For EVs to become a true alternative for ordinary people, the purchase price needs to be competitive and the second-hand value needs to be predictable.
The collective name of EVs can be subdivided into several types based on the vehicle hybridization ratio: hybrid electric vehicles (HEVs), plug-in hybrid electric vehicles (PHEVs) and battery electric vehicles (BEVs). Both HEVs and PHEVs use a combination of internal combustion engine and an electric motor. HEVs cannot be charged from external sources, like the power grid. The battery is only charged by the internal combustion engine or through regenerative braking. In the latter mechanism, the kinetic energy of the vehicle is converted into chemical energy, which is stored in the battery for later use. PHEVs have the same features as HEVs, with the difference that the battery can be recharged from external sources. BEVs operates only on the battery power.
Current harmonic modeling of aggregated electric vehicle loads in the low voltage grid
2 Georgios Foskolos
Within this work the term EV is used to represent fully electric vehicles, that is BEVs.
During the last years a massive growth of EVs (relative to past EV sales) can be seen - globally, nationally and locally. Since 2016, Sweden have had a continuously yearly growth of the amount of purchased chargeable private cars (see Figure 1). Parallel to this the monitoring practices of the distribution grid are changing. Legislations in Sweden states that by 2025 all debit meters must have a default setting of reading of 1 hour resolution, with the possibility to get 10 minute values. During this update Mälarenergi Elnät (a local distribution system operator) decided to install these kind of meters in all secondary substations as well. Besides of being a billing meter, the meter is also able to get some power quality parameters, including total harmonic distortion (THD) (see chapter 2). These two facts – the EV deployment and the development of new power quality practices – have been the main motivation for this work. How will EV penetration affect the low voltage grid and how can monitoring practices be used to aid operational and planning of a grid with large EV penetration?
In terms of environmental impact of EVs there is no consensus. Even if EVs have zero tailpipe emissions, the electricity used to charge EVs is generated from the power grid which means that the well-to wheel emissions, depends on the sources of electricity. Yet another concern are the materials needed in the battery - the energy required to mine these materials and how
Figure 1: Accumulated chargeable private cars (per year in Sweden). [15] 0 20 000 40 000 60 000 80 000 100 000 120 000 140 000 160 000 180 000 200 000 2016 2017 2018 2019 2020 EV PHEV
Introduction
this is being done both from a labour standard and environmental point of view.
Other misgivings are, perhaps not a concern for the consumer but for the Transmission System Operator (TSO) and the Distribution System Operator (DSO), due to the interconnection of EVs to the power grid. How will the power grid react to a massive adoption of EVs? Is there enough energy within our national energy system to provide an entire EV fleet and can we handle the power demand needed if all EV owners want to charge simultaneously. Based on the research being made on the subject the anticipated problems are: increased power demand, system losses, voltage drop, equipment overloading, phase unbalance, stability issues and harmonics. If these problems need to be handled by reinforcing or rebuilding the electric grid, who will pay?
1.1 Aims and objectives
Each of the previously mentioned issues are large enough to be handled in separate works. The work made in this thesis aims to adress a small part of the subject of power quality and EVs by contributing to the overall EV harmonic research. This is done by constructing a measurement based EV current harmonic model. The model is based on measurements made during the charging of 4 different EV models during the mains part of state of charge (SOC). SOC is a measurement of the amount of energy available in the battery expressed as percent of a fully charged battery. Using power-exponential functions, a non-linear model was constructed, fitted by using least-square fitting procedures and conducted in Matlab software that uses an interior reflective algorithm based on [1], [2]. The modelling procedure has not, best to the authors knowledge, previously been used to model current harmonics.
The initial model is based on measured 200 ms values, a resolution much too high to be practical in terms of continuous power grid monitoring. As monitoring of the grid becomes legion, DSOs have to handle a massive amount of data. If used properly, this will certainly facilitate network operation and planning. But, high resolution will increase data service costs, including proper data management. For this reason an evaluation of the time aggregation effects has been made. What will happen if 3-second, 1-minute or 10-minute values are used instead? Will there be a loss of information or is the time resolution sufficient to draw relevant conclusions?
Current harmonic modeling of aggregated electric vehicle loads in the low voltage grid
4 Georgios Foskolos
This work does not claim to be fully exhaustive, but merely give an indication on the aggregated effects of simultaneous charging. The model does not take into consideration the surrounding environment, that is, other non-linear loads or distorted feeding voltage. Both are in fact needed to make a realistic prediction of the harmonic effects of EV charging in an actual grid. This means that the work made is an initial assessment and should be seen as such.
Based on the above resoning this thesis aims at answering the following research questions (RQ):
RQ1: Can measurement of emitted harmonics from different EVs be used to reduce the negative effects on the grid?
RQ2: Is 10 minute resolution values enough to capture the harmonic effects of EV charging?
1.2 Thesis structure
This thesis is organised as follows:
Chapter 2 describes the concept of Power Quality (PQ) and subchapters describe different PQ defects and standards.
Chapter 3 describes EVs and how an expansion can effect PQ. Chapter 4 describes the measurement setup and mathematical
modelling.
Chapter 5 presents the results.
Chapter 6 highlights and discuss the main findings of the thesis. Chapter 7 discusses future work.
2
Power Quality
Power Quality (PQ) is a collective headline to essentially assess the technical quality of the electrical energy delivered. It describes the electric current, voltage and frequency at a given point in an electrical power system, evaluated against a set of reference technical parameters [3]. The concept of PQ can roughly be divided into two parts: continuity and voltage levels. The first deals with the degree to which the user can rely on a constant availability of delivered electricity. The latter, deals with the degree to which the voltage is maintained within certain levels. A perfect power supply (perfect PQ) would be one that is always available, within voltage and frequency tolerances, and has a perfectly sinusoidal shaped waveform.
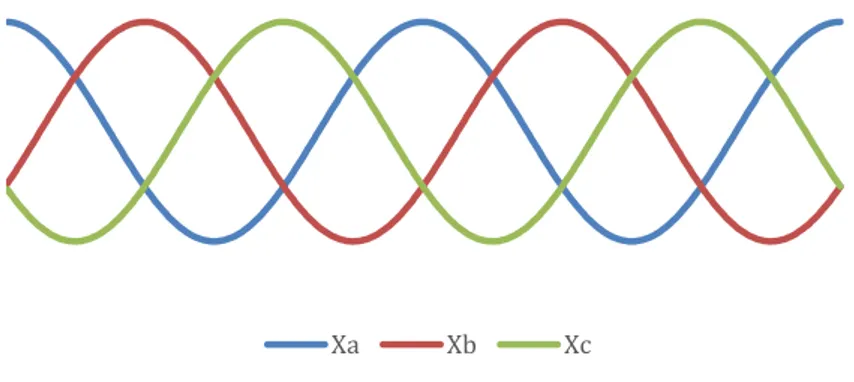
A balanced three-phase situation, as well as the model used when considering voltage (or current) magnitude variations can be seen in figure 2 and be described by equation (1).
Xa Xb Xc
Figure 2: Balanced three-phase AC voltage (or current)
2
Power Quality
Power Quality (PQ) is a collective headline to essentially assess the technical quality of the electrical energy delivered. It describes the electric current, voltage and frequency at a given point in an electrical power system, evaluated against a set of reference technical parameters [3]. The concept of PQ can roughly be divided into two parts: continuity and voltage levels. The first deals with the degree to which the user can rely on a constant availability of delivered electricity. The latter, deals with the degree to which the voltage is maintained within certain levels. A perfect power supply (perfect PQ) would be one that is always available, within voltage and frequency tolerances, and has a perfectly sinusoidal shaped waveform.
A balanced three-phase situation, as well as the model used when considering voltage (or current) magnitude variations can be seen in figure 2 and be described by equation (1).
Xa Xb Xc
Current harmonic modeling of aggregated electric vehicle loads in the low voltage grid 6 Georgios Foskolos 𝑋𝑎(𝑡) = 𝑋√2 cos(2𝜋𝑓0𝑡) 𝑋𝑏(𝑡) = 𝑋√2 cos(2𝜋𝑓0𝑡 − 2𝜋 3⁄ ) 𝑋𝑐(𝑡) = 𝑋√2 cos(2𝜋𝑓0𝑡 + 2𝜋 3⁄ ) (1)
, where X can be either voltage or current and fo is the fundamental frequency.
In terms of signal-processing, the challenge is to extract or estimate the value of the magnitude X. For distorted signals different methods will give different results. In this work the standard estimation method IEC 61000-4-30 [4] (for more information see section 2.4.2) has been used. The current and voltage magnitude has been obtained as the root-mean-square (RMS) value of the voltage and current waveform. The RMS value during one-phase measurements is obtained by (exemplified for the current): 𝐼 = √1 𝑁∑ 𝑖𝑘2 𝑁 𝑘=1 (2)
, where N is an integer multiple of the number of samples during one half-cycle of the power system frequency (window length of 10 half-cycles for 50 Hz system).
There are standards that set the levels required to maintain high PQ. These standards were established with the goal to develop recommended practices and requirements for voltage control in the electrical power system. They concern both utilities and end-users. The former, as they are obliged to provide electrical power of “good quality” and the latter as they are responsible for not degrading the voltage, by, for example drawing significant non-linear or distorted currents.
What about the effects when the voltage is too high or too low or when we have a large deviation from the sinewave? Well, equipment connected to the grid is basically built to function under certain conditions. When these conditions changes, the devices could begin to malfunction; less performance, self-shut-down, shorter lifetime or total break-down. Ultimately, as professor Math Bollen so elegantly expressed during a lecture in 2018, the goal with PQ is to prevent this from happening, that is, prevent interference, or rather, reduce the probability of interference [5].
Current harmonic modeling of aggregated electric vehicle loads in the low voltage grid
6 Georgios Foskolos
𝑋𝑎(𝑡) = 𝑋√2 cos(2𝜋𝑓0𝑡)
𝑋𝑏(𝑡) = 𝑋√2 cos(2𝜋𝑓0𝑡 − 2𝜋 3⁄ )
𝑋𝑐(𝑡) = 𝑋√2 cos(2𝜋𝑓0𝑡 + 2𝜋 3⁄ )
(1)
, where X can be either voltage or current and fo is the fundamental frequency.
In terms of signal-processing, the challenge is to extract or estimate the value of the magnitude X. For distorted signals different methods will give different results. In this work the standard estimation method IEC 61000-4-30 [4] (for more information see section 2.4.2) has been used. The current and voltage magnitude has been obtained as the root-mean-square (RMS) value of the voltage and current waveform. The RMS value during one-phase measurements is obtained by (exemplified for the current): 𝐼 = √1 𝑁∑ 𝑖𝑘2 𝑁 𝑘=1 (2)
, where N is an integer multiple of the number of samples during one half-cycle of the power system frequency (window length of 10 half-cycles for 50 Hz system).
There are standards that set the levels required to maintain high PQ. These standards were established with the goal to develop recommended practices and requirements for voltage control in the electrical power system. They concern both utilities and end-users. The former, as they are obliged to provide electrical power of “good quality” and the latter as they are responsible for not degrading the voltage, by, for example drawing significant non-linear or distorted currents.
What about the effects when the voltage is too high or too low or when we have a large deviation from the sinewave? Well, equipment connected to the grid is basically built to function under certain conditions. When these conditions changes, the devices could begin to malfunction; less performance, self-shut-down, shorter lifetime or total break-down. Ultimately, as professor Math Bollen so elegantly expressed during a lecture in 2018, the goal with PQ is to prevent this from happening, that is, prevent interference, or rather, reduce the probability of interference [5].
Power Quality
Still, just how much deviation from perfection that can be tolerated depends on the user’s application, the type of equipment and the user’s view of requirements.
2.1 Electromagnetic compatibility
The term electromagnetic compatibility, or simply EMC, is strongly related to the concept of PQ. According to standard IEC 61000-1-1 [6], EMC is defined as “…the ability of an equipment or a system to function satisfactory in its electromagnetic environment without introducing intolerable electromagnetic disturbances to anything in that environment.” Putting it simply: equipment’s ability to coexist without disturbing each other.
The Swedish legislation is based on the EMC-directive, and handles disturbances that can affect PQ in the electrical grid. These disturbances can be derived from an individual apparatus or from permanent electrical installation. In terms of individual apparatus there are standards (see section 2.4) that sets technical requirements on the level of electromagnetic disturbances an apparatus may generate and be able to bear.
2.2 Power Quality Defects
PQ defects falls into several categories, but can, on a higher level, be divided into two types: variations and events. Variation is a disturbance that exists constantly during normal operation and that can be measured continuously. An event is a large and sudden deviation from normal magnitude and waveform that only occurs on an irregular basis, and in order to detect needs some sort of threshold value. The defects are listed below.
Variations: o Voltage variations o Unbalances o Harmonics Events: o Voltage dips o Voltage swells o Transients
o Short and long interruptions
In the following sections these defects will be discussed briefly, followed by a more comprehensive review of the harmonic concept.
Current harmonic modeling of aggregated electric vehicle loads in the low voltage grid
8 Georgios Foskolos
2.2.1 Voltage variations
The voltage of an electrical network is subject to various switching on/off operations of electrical equipment. As the loads vary in time, so will the voltage. Depending on whether it is a progressive variation of the total load supplied by the grid, or a sudden variation of a large load, the resulted voltage variation can be slow or fast.
As can be seen in Figure 3, voltage variations are subdivided into categories depending on the time scale. There is no strict definition between the categories, only a rough delimitation [7]; slow voltage variations are said to deal with variations in the time scale of minutes or more, semi-fast voltage variations in time scale of seconds to minutes (not an admitted concept) and rapid voltage change (or VSV- very short variations) in time scale of seconds or less.
Slow voltage variations are described by the voltage RMS-value over a 10 minute period. Standard EN 50160 [8] states that this value should be between 90% and 110% of nominal voltage.
According to the same standard there are two kinds of rapid voltage change: individual (voltage step) or repetitive (voltage flicker).
Figure 3: Voltage variations categorization (taken from [5] )
Current harmonic modeling of aggregated electric vehicle loads in the low voltage grid
8 Georgios Foskolos
2.2.1 Voltage variations
The voltage of an electrical network is subject to various switching on/off operations of electrical equipment. As the loads vary in time, so will the voltage. Depending on whether it is a progressive variation of the total load supplied by the grid, or a sudden variation of a large load, the resulted voltage variation can be slow or fast.
As can be seen in Figure 3, voltage variations are subdivided into categories depending on the time scale. There is no strict definition between the categories, only a rough delimitation [7]; slow voltage variations are said to deal with variations in the time scale of minutes or more, semi-fast voltage variations in time scale of seconds to minutes (not an admitted concept) and rapid voltage change (or VSV- very short variations) in time scale of seconds or less.
Slow voltage variations are described by the voltage RMS-value over a 10 minute period. Standard EN 50160 [8] states that this value should be between 90% and 110% of nominal voltage.
According to the same standard there are two kinds of rapid voltage change: individual (voltage step) or repetitive (voltage flicker).
Power Quality
Voltage variation is basically caused by variations in active and reactive power and variations in the grid. For example, voltage drops because of the load, voltage rises because of distributed generation, voltage steps because of tap changers and shunt capacitors, and rapid voltage change because of fast variations in active and reactive power.
2.2.2 Unbalance
Voltage unbalance is a condition in a three-phase system in which the RMS values of the line voltages, or the angles between succeeding line-to-line voltages, are unequal. In order to define unbalance the concept of symmetrical components is applied.
Symmetrical components is a way to divide three asymmetric complex voltages into three combinations of symmetric complex voltages. Based on the connotation of symmetrical components V+, V- and V0 is used, where
𝑉+ 𝑖𝑠 𝑡ℎ𝑒 𝑝𝑜𝑠𝑖𝑡𝑖𝑣𝑒 𝑠𝑒𝑞𝑢𝑒𝑛𝑐𝑒 𝑣𝑜𝑙𝑡𝑎𝑔𝑒 𝑉− 𝑖𝑠 𝑡ℎ𝑒 𝑛𝑒𝑔𝑎𝑡𝑖𝑣𝑒 𝑠𝑒𝑞𝑢𝑒𝑛𝑐𝑒 𝑣𝑜𝑙𝑡𝑎𝑔𝑒 𝑉0 𝑖𝑠 𝑡ℎ𝑒 𝑧𝑒𝑟𝑜 𝑠𝑒𝑞𝑢𝑒𝑛𝑐𝑒 𝑣𝑜𝑙𝑡𝑎𝑔𝑒 𝑉+= (𝑉1+ 𝑎𝑉2+ 𝑎2𝑉3) 3 (3) V−= (𝑉1+ 𝛼2V 2+ α𝑉3) 3 (4) V0= (𝑉1+ V2+ α𝑉3) 3 (5) , where 𝑎 = 𝑒𝑥𝑝(𝑗2𝜋⁄ )3 and V
1, V2 and V3 are the line-to-neutral voltages. The level of unbalance is then quantified as the ratio between V- and V+, expressed in percent of 10 min RMS values (according to IEC 6100-4-30). In high voltage grids, unbalance is often caused by unsymmetrical impedances in overhead lines. In low voltage grids the cause is unbalanced
Current harmonic modeling of aggregated electric vehicle loads in the low voltage grid
10 Georgios Foskolos
loads i.e. one-phase loads. The Swedish legal framework states that unbalance of 10 min RMS is allowed to have a maximum value of 2%.
2.2.3 Voltage dips
A voltage dip is a temporary reduction in supply voltage. During the dip the voltage RMS value falls under a certain threshold (usually 90% of nominal voltage) and returns to reference voltage (threshold voltage, nominal voltage or a sliding value, representing the voltage immediately before the start of the dip) within a few seconds or minutes. The dip is specified in terms of duration and retained voltage (lowest 20 ms RMS value), often expressed as the percentage of nominal RMS voltage remaining at the lowest point during the dip.
The voltage dip is associated with the occurrence and termination of short-circuit or other large increases in current taking place at any point in the electricity supply system or installations connected to the grid. A large increase in current, either because the switching of large loads or in the event of a short circuit, will, in turn, give rise to a voltage drop in the impedances of the supply system.
A short circuit can have many causes, but ultimately it involves a breakdown of the dielectric between two structures which are meant to be insulated from each other. Depending on where this short circuit occurs, the effects could be either a total loss of voltage or a voltage dip (or variations). That is, if the short circuit occurs within “the own part of the grid”, the protective devices will disconnect the short circuit and the voltage will be lost. On the other hand, if the short circuit occurs in “another part of the grid”, we will, as a result of the large short circuit current, have a voltage dip. The magnitude of the dip depends on where the fault occurs and is a function of power and impedance. Once the protective devices have disconnected the affected part, the voltage will return to normal.
2.2.4 Voltage swells
A voltage swell is a short-time increase in the RMS value of the supply voltage, with the magnitude of between 110% and 180% of the rated voltage. Similarly as for dips, swells are specified in terms of duration and retained voltage (highest 20 ms RMS value). The swell is associated with a shortfall of large loads, the plugging-in of production units (distributed energy), large one-phase loads and one-phase faults in the low voltage grid. Earth faults in
Power Quality
the medium voltage grid will result in voltage swells in the medium voltage grid, but not in the downstream low voltage grid.
Usually, voltage swells appear at low voltage customers, far away from nearest transformer, and are fed from a long cable or wire. The voltage swell consequences for customers are damaged appliances and for the network operator a reduction of life expected for cables and capacitors.
2.2.5 Flicker
Rapid cyclic variations in load (pulsating or intermittent) may affect the supply voltage by causing it to fluctuate. These voltage fluctuations may cause blinking of lightning apparatus, a phenomena perceived by the human eye, and causing nuisance, like migraine and loss of concentration. Incandescent lamps are generally more susceptible for these variations in voltage than non-incandescent lamps. Quantification the severity of voltage fluctuations is perception-based, which means that humans have been exposed for different levels of flicker and the result has been statistically processed. The method results in flicker severity for a 60 W incandescent lamp fed with 120 V and 240 V for instantaneous (Pinst), 10 min (Pst (short time)) and 2 hours (Plt (long time)).
The main sources of rapid voltage fluctuations are industrial loads. For example: resistance welding machines, arc furnaces, saw mills, rolling mills, x-ray machines, large motors with variable loads and the switching of power correction capacitors. Example flicker producing lighter loads are photocopying machines, heat-pumps and air-conditioning equipment.
2.2.6 Transients
A transient is a very rapid change in voltage or current, typically less than one period. It may be either an increase or a decrease of the magnitude and will take the form of an oscillatory or non-oscillatory (impulsive), often highly damped, wave. The distinction between oscillatory and impulsive events is based on the appearance of the event – the impulsive transient is unidirectional and oscillatory transients oscillating around a new steady-state value [9]. This distinction should, however, not be used as an absolute classification as many transients show impulsive as well as oscillatory behavior, and could also change character as they propagate through the system [7].
![Figure 1: Accumulated chargeable private cars (per year in Sweden). [15]](https://thumb-eu.123doks.com/thumbv2/5dokorg/4721714.124642/21.718.92.599.64.398/figure-accumulated-chargeable-private-cars-year-sweden.webp)
![Figure 3: Voltage variations categorization (taken from [5] )](https://thumb-eu.123doks.com/thumbv2/5dokorg/4721714.124642/27.718.95.598.372.724/figure-voltage-variations-categorization-taken-from.webp)