Ma...»... egi ...
to tilting trains specrflcaspects
of high speed curving
Pap-er presented at WCRR 99, World Congress On Railway
Research, October 19 23, 1999, Tokyo, Japan
Björn Kufver, VTI and Hallstein Gåsemyr, JBV, Norway
O') m as 1-1 N N
m
x 0 > h 4..-h 2GB U)Swedish National Road and
Transport Research Institute
VTI särtryck 327 - 1999
Adaptation of Norwegian tracks
to tilting trains - specific aspects
of high speed curving
Paper presented at WCRR 99, World Congress on Railway
Research, October 19 23, 1999, Tolwo, Japan
Björn Kufver, VTI and Hallstein Gåsemyr, JBV, Norway
Wåäiåfå ' ååå Copyright©, with permission of WCRR 99 Secretariat.
Adaptation of Norwegian tracks to tilting trains
- speci c aspects of high speed curving
Björn KUFVER
Hallstein GASEMYR
VTI Railway Systems
Jembaneverket
SE-581 95 Linköping N-OO48 Oslo Sweden Norway Telephone: +46 13 20 43 91 +47 22 45 51 94
Facsimile: +46 13 14 14 36 +47 22 45 52 49 E-mail: bjorn.kufver@ vti.se hallstein.gasemyr@jbv.no
Summary
During 1993 and 1996, successful trials with foreign tilting trainsets were carried out in Norway. Following positive results, the decision was made to acquire tilting trains for Norway.
Even though tilting trains may run faster on curves than conventional trains, it is clear that the ride comfort in tilting trains can be improved with minor changes to the existing alignment and cant. It is also wise to consider speci c aspects of tilting when designing major realignments and new lines. Hence, there is a need for a complete set of track standards for tilting trains.
The Norwegian trains will have a xed compensation ratio, eliminating 55% of the lateral acceleration in the track plane. Therefore, when vehicle speed is xed, the magnitudes of different vehicle motions will be highly dependent on track quantities such as curve radius, cant and length of transition curves. In order to evaluate contradictory objectives, the approach has been to quantify ride comfort at the most aggregated level possible. The most relevant aggregated function is passenger comfort in curve transitions, PCT, since this takes into consideration lateral acceleration in the vehicle body, lateral jerk and roll velocity. Aspects concerning motion sickness have been considered by estimating the expected roll velocity of the vehicle bodies, which has been compared with published results from Japan and Sweden.
The investigation shows that the track standards, if applied with an approach where permissible train speed is maximised within de ned terrain corridors, result in alignments which minimise the comfort disturbances according to the PCT functions. The major uncertainty in the present study is the risk of motion sickness.
Keywords
1 Introduction
Interest in high speed curving is not new in Norway (Serigstad & Potter 1995). The possibilities of operating tilting trains were already being taken into consideration in 1973, and in 1981, special express trains with an approximately 10% higher curving speed than conventional rolling stock were put into service. During 1993 and 1996, successful trials (with cant de ciencies up to 300 mm) with the Swedish X2 (also called X2000) and the German VT610 tilting trainsets were carried out in Norway. As a result of positive results with these trains, the decision was made to acquire 28 tilting trains for Norway. One of the 16' EMUs for the new Oslo-Gardermoen Airport line, having a maximum speed of 210 km/h, has been equipped with active tilt technology. Another 16 EMUs and 11 DMUs have been ordered and will be put into traf c on existing main lines with a maximum speed of 160 km/h. (Maximum speed on these lines is 130 km/h for conventional trains and express trains.)
Even though tilting trains may run faster on curves than conventional trains, it is clear that the ride comfort in tilting trains can be improved with minor changes to the existing alignment and cant. It is also wise to consider speci c aspects of tilting when designing major realignments and new lines. Hence, there is a need for a complete set of track standards for tilting trains. These standards must provide reasonable and practical guidance for track engineers.
2 Investigation of track forces and track stability
During tests with the X2 and VT610, track forces were measured with instrumented wheelsets and were found lower than the limits according to the criterion of Prud homme (Gåsemyr 1999). Using a Swedish laboratory coach, track stability was measured and it was con rmed that the track could carry lateral loads exceeding the limits of Prud homme.
Where tilting trains run through curves at a higher curving speed than normal, relative displacements between rails and sleepers were measured in order to investigate the roll behaviour of the rails and risk of fatigue of the rail fasteners (Pandrol PR 341A and Pandrol e1877). For all types of vehicles, the de ections in the fasteners were smaller than the limit speci ed by Pandrol.
3 Principles for analysis of alignment related comfort in trains
In the present study, passenger comfort or discomfort is related to the motions of the vehicle body when these motions are caused by alignment and cant. This leaves mainly quasi-static lateral acceleration, lateral jerk and roll motions for the analysis.
It is preferable to evaluate the combined effect of acceleration, jerk and roll since measures to reduce one of these physical quantities often result in an increase in another. An investigation (Kufver 1997b) found that the PCT functions (Harborough 1986, CEN 1995) offer the most reasonable way of quantifying instantaneous discomfort when running through curves. The two PCT functions, one for standing passengers and another for seated, show the percentage of passengers who nd the lateral ride uncomfortable, expressed as functions of lateral acceleration, lateral jerk and
since different groups of passengers may have different requirements on comfort, but it is believed that the PCT functions may nevertheless be used in relative comparisons.
A small percentage of passengers in tilting trains are affected by motion sickness, which is believed to be a cumulative effect of vehicle motions on a number of curves. The contribution of different types of vehicle motion is unclear (Förstberg & Ledin 1997), but results from Japan (Koyanagi 1985, Ohno 1996) and Sweden (Förstberg 1996) indicate that roll velocities and/or roll acceleration are important. In Japan, a limit for roll velocity (5 degrees/s, later changed to 0.1 rad/s) and a limit for roll
acceleration (15 degrees/sz, later changed to 0.3 rad/S2) have been introduced, and since
then tendencies to motion sickness have decreased, although they have not been totally eliminated (Ohno 1996).
According to CEN (1995), the magnitudes of the physical quantities should be calculated for the vehicle oor. In a study (Kufver 1997c) it was found that differences between the physical quantities in the vehicle oor and those in the track plane are mainly explained by the roll behaviour of the vehicle. Since vehicle data for the primary and secondary suspensions of the Norwegian tilting trains were not available at the time of the present study, a simple vehicle model was developed, with only one degree of freedom; rolling. It was mainly assumed that roll angle was in phase with lateral acceleration in the track plane, but additional calculations were made for the rst vehicle in the trainset, with an assumed delay of 0.2 seconds in roll motion. Using this simple vehicle model, the roll velocity, but not the roll acceleration, may be estimated. The simple model leads to underestimation of the physical quantities, but it was assumed that this underestimation is approximately the same for the compared alternatives.
The comfort analysis has been structured in a hierarchy with an increased complexity in the decisions to be taken: (1) - The choice of compensation ratio in the tilt system (and/or the choice of cant) when horizontal alignment and vehicle speed are
xed. (2) - The choice of horizontal alignment in a prede ned terrain corridor when
vehicle speed is xed. (3) - The choice of speed level when the alignment is xed. 4 Choice of cant and choice of compensation ratio in the tilt systems
The rst level in the comfort analysis is the choice of cant and the choice of compensation ratio in the tilt systems for a prede ned alignment and a prede ned speed of the tilting trainset. For passengers, it is of no importance whether the track is superelevated or the vehicle body tilts in relation to the track. Hence the compensation ratio is used as the independent variable in the analysis, while the cant is xed at the level that maximises the permissible speed for conventional trains according to the Norwegian track standards, see Table 1.
Tablel Extract of limits for conventional trains in the Norwegian track standards.
Cant Cant de ciency (Radius>600 m) Rate of cant Rate of cant de ciency 150 mm 150 mm 55 mm/s 80 mm/s
Figure 1a-1b shows PCT for both seated and standing passengers, together with roll velocity for two cases where a tilting train runs through curves at a speed of 155 km/h.
40 , ,, , 10 40 x ,
+ Pct standing
+ Pct standing %. %
30 + Pct seated ,,,..T 8 § 30 --5 Pet seated " 8 å
_ ' G..-..,. _| - I f.,-'.'.
5. _. Rol veloCIty "___/..,...»- __ 6 å ä. ._ Roll veloctty .____.___.__._....-o __ e £
0- 20 "o .____.._ .- ". "'"", " 4| => s 20 "' '#'-_.f.d-""". k4 => n. ___/___ g n. =. - - 3 10: _, 2 % 1° " " 2 å
*
. E
'
| s
o - . - : A A A : - . : - . A 0 0 A . : A A A A, A A : . - - 0 20 40 60 00 100 20 40 60 80 100Compensation ratio [%] Compensation ratio [%]
Figure 1 PCT and roll velocity for a tilting train running through a curve at a speed of 155 km/h. Left: Radius is R=665 m, cant is D=150 mm and transition lengths are Lt=99 m. Right: R=1330 m, D=65 mm, Lt=46 m. In the alignments in Figure 1a 1b, the best compensation ratio with respect to PCT is in the range 70-85%. However, the roll velocity reaches 6.5 degrees per second for such high levels of compensation ratio.
In Norway, a compensation ratio of 55% has been chosen. Roll velocities may reach levels up to approximately 5.5 degrees per second. This may be regarded as a compromise between the contradicting desires of low PCT values and low roll velocities. 5 Choice of horizontal alignment in a prede ned terrain corridor
The second level in the analysis is focused on the lengths of the transition curves. As quanti ed in Kufver (1999), PCT is lower for a long transition curve than a short transition curve if the curve radius is the same in the two alternatives. However, lengthening the transition curves requires an inward shift of the circular portion of the curve, and if the terrain corridor allows such a lateral shift, the corridor may instead be better utilised by a larger curve radius (Kufver 1997a, Kufver 1997c and Kufver 1998).
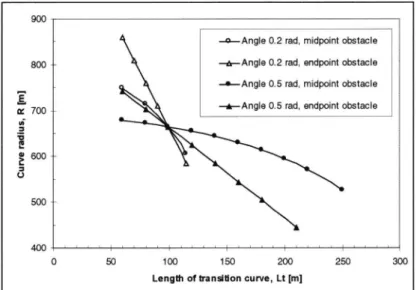
Hence, various hypothetical terrain corridors for single curves were analysed. The corridors were de ned by the angle of the adjacent straight lines and by the longitudinal position of the binding obstacle. In the main study, the lateral position of the hypo-thetical obstacle was chosen to enable an evaluation of the combination radius R=665 m and transition length Lt=99 rn, see Figure 2. These are the smallest radius and the correspondingly shortest transition curve for a permissible speed of 130 km/h for conventional trains. Deviations from this R/Lt combination lead to a lower permissible
speed for conventional trains if the track remains within the de ned corridor, without
expensive removal of the obstacles (Kufver & Gåsemyr 1999). Additional corridors with other permissible speeds for conventional trains have been evaluated and it was found that for higher train speeds, the conclusions will be slightly different.
900
_o_Ang|e 0.2 rad, midpoint obstacle
goo __ +Angle 0.2 rad, endpoint obstacle
0 Angle 0.5 rad, midpoint obstacle +Angle 0.5 rad, endpoint obstacle
Cu rv e ra di us , R [m ] 500 4 0 0 0 50 100 150 200 250 300
Length of transition curve, Lt [m]
Figure2 Possible combinations of curve radius R and lengths of transition curves Lt in different hypothetical terrain corridors. The PCT values for seated passengers in a tilting train running through the curves at a speed of 155 km/h are shown in Figure 3. (At the reference alternative R=665 m and Lt=99 m, the cant de ciency is 1:276 mm, the rate of cant de ciency is
dI/dtzl20 mm/s and the rate of cant is dD/dt=65 mm/s.)
20
0 Angle 0.2 rad, midpoint obstacle +Angle 0.2 rad, endpoint obstacle
15 " 0 Angle 0.5 rad, midpoint obstacle
+Angle 0.5 rad, endpoint obstacle
Pc t, se at ed [% ] ES 0 50 100 150 200 250 300
Length of transition curve, Lt [m]
Figure 3 Passenger discomfort in terms of PCT (seated passengers) for a tilting train running through curves at a speed of 155 km/h. On short transition curves, discomfort is caused mainly by high levels of lateral jerk and roll velocity, while on long transition curves, discomfort is caused mainly by a high level of lateral acceleration. In two of the cases, the lowest discomfort in terms of PCT is achieved with the transition length Lt=99 m, which is the transition length which maximises permissible speed for conventional trains. In the other two cases, slightly lower PCT values are achieved with a shorter and a longer transition curve, respectively.
Further calculations were made for the same terrain corridors as in Figure 2. It was assumed that the tilting trains passed the curves at a lower speed than 155 km/h, see Figure 4. PCT is generally lower in Figure 4 than in Figure 3, but PCT minima are still found at approximately Lt=99 m.
n Angle 0.2 rad, midpoint obstacle
A Angle 0.2 rad, endpoint obstacle Angle 0.5 rad, midpoint obstacle +Angle 0.5 rad, endpoint obstacle
Pc t, se at ed ["/ o] 4__ . &t'
IO)»
0 50 100 150 200 250 300Length of transition curve, Lt [m]
Figure4 Passenger discomfort in terms of PCT (seated passengers) for a tilting train running through curves at a speed of 150, 145 and 140 km/h.
PCT values for standing passengers form the same patterns as in Figures 3 and 4, but are of larger magnitudes. PCT minima are found at approximately Lt=99 m.
However, roll velocities decrease with increased transition lengths, and the risk of
motion sickness may justify longer transition curves.
The investigation has also been extended to a more dynamic evaluation of tilting vehicles with the use of the multibody computer code GENSYS. Each vehicle was modelled with seven rigid bodies (a vehicle body, two bogies and four wheelsets), each having six degrees of freedom (three translations and three rotations). Vehicle data according to the Swedish X2 trainset were used, but with a lower tilt compensation ratio. Simulations were conducted in the time domain.
The results from the dynamic simulations correspond very well with the original
investigation. For the coach centre, the PCT values are almost the same. Above the
bogies, PCT may be up to 3% higher. The differences are explained by a high level of yaw acceleration when the vehicles enter the curves. For all positions within the coaches, PCT minima were found at approximately Lt=99 m.
6 Choice of speed level for tilting trains in Norway
After finding procedures for choosing cant and alignment, the remaining task was to evaluate whether or not the comfort level for an assumed cant deficiency of 280 mm will be reasonable. This evaluation was based on comparisons of resulting PCT values in tilting trains and conventional trains in Norway and Sweden.
7 Conclusions
After evaluation of further cases, it was decided to set the track limits for tilting trains to the values in Table 2.
Table 2 Extract of suggested track limits for tilting trains in Norway. Cant Cant de ciency Rate of cant Rate of cant de ciency
150 mm 280 mm 75 mm/s 140 mm/s
In the application of the track standards in Tables 1 and 2, it is recommended to maximise the permissible speed for conventional trains. Hence, the limit for rate of cant should not be binding for tilting trains since an overspeed of 36% (75 mm/s in Table 2 compared to 55 mm/s in Table ]) cannot be justi ed when applying other limits in Tables 1 and 2. It should also be noticed that in the case of single curves, only one of the limits for cant de ciency and rate of cant de ciency will be binding (as in Figure la
and lb, respectively).
On the worst curves, the resulting PCT values for tilting trains may reach levels of 73% and 29.5% for seated and standing passengers, respectively. For the conventional trains in Norway, the corresponding gures are 11.0% and 36.0%. Hence, the instantaneous discomfort is believed to be lower in the tilting trains than in the conventional trains. However, the roll velocity reaches 5.4 degrees/second in the worst cases and curves are frequent in Norway. The risk of motion sickness is therefore the maj or uncertainty in this investigation.
Acknowledgements
This project is a part of a study in track/vehicle interaction conducted in cooperation with Professor Evert Andersson at the Department of Railway Technology, Royal Institute of Technology (KTH), Stockholm, Sweden.
BIBLIOGRAPHY
CEN, (1995), Railway applications Ride comfort for passengers Measurement and evaluation. CEN TC256 WG7 (Final committee draft for official CEN enquiry), Brussels.
Förstberg, J., (1996), Motion-related comfort levels in trains - A study on human response to different tilt control strategies for a high speed train. TRITA-FKT Report
1996141, KTH, Stockholm. (Also published as VTI Särtryck 274, Linköping.)
Förstberg, J. & Iedin, T., (1996), Discomfort caused by low-frequency motions A literature survey of hypotheses and possible causes of motion sickness. VTI Meddelande 802A, Linköping. (Also published as TRITA FKT Report 1996:39, KTH,
Stockholm.)
Gåsemyr, H., (1999), Norwegian case study: Upgrading the permanent way for the introduction of tilting trains. Proceedings: Infrastructure maintenance & renewal
99, 8-11 February 1999, AiC, London.
Harborough, PK, (1986), Passenger comfort during high speed curving -analysis and conclusions. BRR TR DOS 018, British Rail Research/AEA Technology, Derby.
Koyanagi, S., (1985), Ride quality evaluation of a pendulum car. QR of RTRI, 26 (3): 89-92.
Kufver, B., (1997a), Mathematical description of railway alignments and some preliminary comparative studies. VTI Rapport 420A, Linköping. (Also published as
TRITA-FKT Report 1997130, KTH, Stockholm.)
Kufver, B., (1997b), Methods for evaluation of ride comfort as a function of vehicle reactions caused by railway alignment. VTI Rapport 421A, Linköping. (Also
published as TRITA FKT Report 1997:31, KTH, Stockholm.)
Kufver, B., (1997c), Optimisation of single horizontal curves in railway alignment. VTI Rapport 424A, Linköping. (Also published as TRITA FKT Report
1997245, KTH, Stockholm.)
Kufver, B., (1998), Realigning railways in track renewals methods and objectives. Proceedings: Railway Engineering 98, 10 July 1998, London: 53 57. ISBN 0-947644-37 7. (Also published as VTI Särtryck 303, Linköping.)
Kufver, B., (1999), Realigning railways in track renewals - linear versus S shaped superelevation ramps. Proceedings: Railway Engineering 99, 25-26 May 1999, London. ISBN 0-947644-39-3. (Also published as VTI Särtryck 318, Linköping.)
Kufver, B. & Gåsemyr, H., (1999), Norwegian railways adapted for higher train
speeds track aspects of tilting trains. Proceedings: Railway Engineering - 99, 25-26 May 1999, London. (Also published as VTI Särtryck 319, Linköping.)
Ohno, H., (1996), What aspect is needed for a better understanding of tilt
sickness? QR of RTRI, 37 (1): 9-13.
Serigstad, K. & Potter, T.J., (1995), Tilting trains and computer simulation in Norway. Rail Engineering International, (1): 15-20.