5 '. « d h. a! .4 2 '5 I . nV v
Reflec onpmpe es Oforoad '
~ j
'
~ .. markings in Vehit 'e
. _ I
' headlig {illumina'
_
~
i
i *
I .
The: National i5wedi51h Road and
bY'SVen-Olonundlwist, _. "
:
' ._
j
" :.
- - Traf cg esearch'lnftmgs v' en __ .
' '
' Danishl l lu,
I a x
« - . \ . 1 I . » ~,b -~ . t _ ' . ~ ' I y !. . ,. h * J. . . n \ I I -. '~ ~ ' r: C._ . . . . . x \ -. I ; x I \ . . x 1 . . .7 ,h ._ V ' . ; } . I l l A . _ t . i \ . f . ' > . ; . x l. > * 4 . ~ ~ " - ' .J 'r, " \' m r g. . I . 3 " D l ' p I t 7.! no: a u - » x: h < ..z .v 1.. . l . . ,
Nr 189A - 1980
ISSN 0347 6030
189A
Statens viig- och trafikinstitut (Vl'l) - 581 01 linkiiping
National Road & Traffic Research Institute - S-581 01 Linkoping - Sweden
Reflection prOperties of road
markings in vehicle
headlight illumination
by Sven-Olof Lundkvist,
The National Swedish Road and
Traffic Research Institute, Sweden
and Kai Sorensen,
The Danish Illuminating Engineering
PREFACE
This report is based on an investigation on the
influ-ence of the measuring geometry on the reflection
proper-ties of road markings in vehicle headlight illumination.
The investigation was financed by the National Road Administration in Sweden and the Danish Illuminating
Engineering Laboratory in Denmark and it was intitated
in contact with the subcommittee on retroreflection of
CIE committee TC-2.3, "Materials", which kindly made
some of the road marking samples available for the
measurements.
The investigation is, further, to be seen as a
fore-runner of a number of projects into reflection proper
ties of road surfaces and road markings in vehicle
headlight illumination, which are planned within the
Nordic research co-operation for the study of night time traffic conditions.
This investigation has been carried out by the National
Road and Traffic Research Institute, VTI, in Linkoping,
Sweden and the Danish Illuminating Engineering
Labora-tory, LTL, in Lyngby, Denmark.
Reflection properties of road markings in vehicle headlight illumination
by Sven-Olof Lundkvist
National Swedish Road and Traffic Research Institute, 581 01 LINKDPING Sweden
and Kai S¢rensen, The Danish Illuminating Engineering
Laboratory, Denmark
ABSTRACT
With the purpose to investigate how the specific luminance of dry road markings depends on observation- and illumina-tion angles, laboratory measurements on nine different
road samples have been carried out. The geometries of
the measurements have been chosen in such a way that they simulate observation distances between 10 and 100 metres, observer eye heights 1.0, 1.2 and 1.5 metres and headlight mounting height 0,65 metres.
The results indicate that at any observation distance the specific luminance is lower, the larger the observer eye height is, which could be expected at least from road markings containing retroreflective micro-pearls. Further on, those samples with drop-on micro-pearls show an initial increase in specific luminance up to a
maximum at 15 to 30 metres observation distance. At
larger distances the specific luminance decreases. From
the results it can also be concluded that a simple
relationship of variation of the specific luminance with
the distance on the road does not exist.
The report also contains discussion and analysis of the
results, including comparison to measurements carried out in Belgium and Denmark.
1 INTRODUCTION
Reflection properties of road surfaces and road markings
in vehicle headlight illumination is a field, which has been partly neglected in comparison to reflection
pro-perties in roadlight illumination.
Some studies have been carried out for the situation
of vehicle headlight illumination. e.g. by the two
institutions involved in this project (see VTI internal reports No. 89 and 93, LTL reports No. 9 and 10, and
Morkertrafik report No. 2). It has to be stated,
how-ever, that these and other studies give a far from complete picture of reflection properties for vehicle
headlight illumination, and that even basic problems
of measurement are hardly yet resolved.
In spite of this lack of data, there is now a
consider-able interest in the reflection properties, in parti
cular of road marking materials in vehicle headlight illumination. This interest is probably aroused by the
role of these reflection properties for the visual
guidance and for other aspects of traffic safety in night time driving on unlit roads. The interest
mani-fests itself in the devleopment of simplified, portable
measuring equipments, in activities in some countries in drafting codes for the reflection properties of road markings and in studies of these matters in some
committees within the CIE.
These developments might easily lead to unsatisfactory
conditions and even mistakes, if not a firmer basis for the activities is established within a not too long period.
Projects for a thorough study of reflection properties
of road surfaces and road markings in vehicle headlight
illumination have been planned and will be carried out
within the Nordic research co-operation for the study
of night time traffic conditions.
The present investigation is to be considered a
fore-runner for these projects, and an investigation of the
limited aim of the influence of the measuring geometries
on the reflection properties of some road marking
mate-rials. This investigation is further seen as a test of
the already existing measuring equipment at VTI,
con-cerning the modification of this equipment for future
studies of the influence of the measuring geometry. Further reasons to initiate this investigation were some urgent questions raised by the subcommittee on retroreflection of CIE committee TC-2.3 "Materials".
This investigation is
therefore, not complete and
does not pretend to give final answers. Thus the equip ment at VTI was not able to reproduce all the desired measuring geometries.
Further, the set of road marking samples, which is composed of samples kindly made available by the CIE
subcommittee with.timaaddition<3f some existing samples
from Sweden and Denmark, is hardly representative of
road markings most commonly used in practise. Finally,
the influence of wear and wet conditions is not included. Even considering the limitations of this investigation, it does undoubtedly represent the largest, systematic
study of the influence of the measuring geometry found
today. Thus it is illustrated that the measuring geometry has a large influence, varying in manner from one road marking sample to another.
2 DEFINITIONS AND NOTATIONS
The measuring geometries used by Prof. Morren, Laboratorie Central d'Electricite, Belgium, in his reports to the CIE subcommittee on retroreflection are characterized by an angle of entrance, 8 and an angle of observation, d.
The reports of Prof. Morren are "Guidelines for the
photometry of retroreflecting paints for road marking"
of January 1978, "A report on tests on retroreflective
road marking samples" of October 1978 and "An additional
report on retroreflective road markings" of March 1979.
Those reports were summarized in a further draft report
of August 1979, "A report in view of drafting a
recommendation for the photometry of retroreflective
road markings".
The angle 8 is defined as the angle between the
direc-tion of illuminadirec-tion and the normal to the surface of
the sample, while the angle d is the angle between the
directions of illumination and observation. These two
directions are in the same vertical plane.
It would be tempting to use these definitions and notations in this report also. This could, however, lead to some confusion, as the notation "angle of observation", is already used in road lighting in another definition, namely as the angle between the
direction of observation and the plane of the surface.
Further, in road lighting an angle 8 is used for the angle between the vertical planes of illumination and observation, see CIE publication No. 30.
It is prefered, therefore, to stick to those defini-tions and notadefini-tions of angles already in use in the
Nordic countries and found also in a draft CIE technical
report "Road surfaces and lighting" of TC-4.6. These
definitions and notations are those used in road
lighting except for the use of the complementary angle to the entrance angle, namely the angle of illumina-tion, a. This set of angles, which is illustrated in fig. 1, also allows the directions of illumination and observation to be in different vertical planes.
For the reflection parameter different names and nota-tions, like retroreflection, automobile headlight
factor etc., are used. The definitions are, however,
the same or practically the same, namely the luminance
of the surface divided by the illuminance on a plane
perpendicular to the direction of illumination, so
that the choice of name and notation is a matter of
convention only. Again it would be tempting to use
the term considered by Prof. Morren and the subcommittee on retroreflection, which is "coefficient of
retro-»reflected luminance", CRL. However, this term indicates that the luminance is due to a retroreflective mechanism, which is not the case for all types of road markings
and not at all the case for road surfaces.
For this reason the term specific luminance, SL as
presently used in the Nordic countries is maintained in this report. The definition of the specific luminance appears in fig. 2.
VTI REPORT NO.
Eigure 1
Definition and computation of angles in
head-light illumination. U ' U C E O
189A
ObserverHeadlight
Point Observation distance, road surface Illumination distance, road surface Observer eyemeasured along the measured along the height above the road surface
Headlight mounting height above the road
surface 1
Observation angle = tan
(HO/DO) J HO/DO
Illumination angle= 9OO y, where y is the angle of incidence
(Hh/DhVMHh/Dh
Azimuthal angle, angle between vertical planes of illumination and observation
/EL
Eigure 2 PI REPORT NO. H: P: SLwhere L (cd/m2) is the luminance of the road
SD *3 £1.
189A
_E-L
Definition of the specific luminance, SL.
Headlight
Point on road surface or road marking
l: (Cd/m2)/lux
surface or road marking at the point
P (depends on the observer position)
T? (111v\ 'ic
4.14 \Auxx/ .Lu
plane, which is situated at th
point
P and orientated perpendicular to the
direction of illumination.
3 ROAD MARKING SAMPLES
The set of samples include twin samples to the samples
3, 4, 5, 6 and 7 used by Prof. Morren. These samples
are all prefabricated material cut into dimensions of
10 cm times 38 cm, and for the sake of stability they
were glued onto blackpainted 3 mm thick steelplates
of dimensions 20 cm times 40 cm.
From LTL the set of samples is extended by a 3M
Stay-mark, in fact of the same type as samples 3 and 4, but
exposed to a severe traffic load by lorries in a factory
exit for about one month. Further was included a road
marking of the common spray plastic type with premix
micro-pearls, which has also been exposed to traffic
for a short period, and finally a laboratory sample of
a sidemarking of quite some use in Denmark, being a
surface treatment with large-sized bright Synopal
stones. These three samples are all of dimensions 20
cm times 40 cm.
One more sample, included by VTI, is a spray plastic
without micro-pearls, manufactured by a Swedish firm.
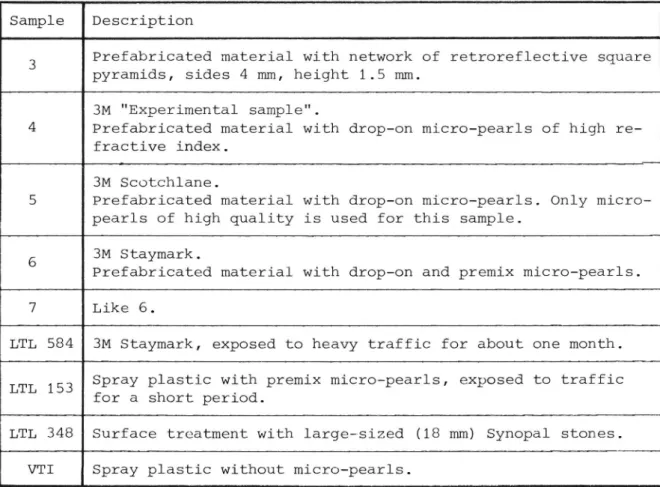
Some short descriptions of these samples, nine in
total, are given in table 1.
Table 1
Description of the 9 road marking samples
Sample Description
Prefabricated material with network of retroreflective square pyramids, sides 4 mm, height 1.5 mm.
3M "Experimental sample".
4 Prefabricated material with drop on micro pearls of high re fractive index.
3M Scotchlane.
5 Prefabricated material with drOp on micro pearls. Only micro pearls of high quality is used for this sample.
A
3M Staymark.
Prefabricated material with drop on and premix micro pearls. 7 Like 6.
LTL 584 3M Staymark, exposed to heavy traffic for about one month. Spray plastic with premix micro pearls, eXposed to traffic T 53
L L 1 for a short period.
LTL 348 Surface treatment with large-sized (18 mm) SynOpal stones. VTI Spray plastic without micro pearls.
4 MEASUREMENTS AT VTI 4.1 Measurement method
The specific luminance measurements have been carried
out with a Prichard Model 1980 luminance meter externally
calibrated to a silicon standard with a known specific
luminance. This standard was calibrated to a barium
sulphate standard.
The luminance meter is equipped with a special rectangular
aperture of abt. 3.6' x 21', which gives a length of
the measuring area of 38 cm at the smallest angle of
obserVation, 0.570. Measuring distance is 3.6 metres.
The light source is a slide projector giving a rectangular
illuminated field. The lens has an iris diaphragm. The
luminance meter and the projector are mounted in a specially designed goniometer equipment, which allows
a convenient setting of the observation and
illumina-tion angles. A sketch of this equipment is found in
figure 3.
TI REPORT NO.
189A
L um i n a n c e m e t e rMe
as
ur
in
g
ob
je
ct
F
i
g
ur
e
3
M
e
a
s
ur
i
n
g
e
q
ui
p
m
e
n
t
Ad
jus
ta
bl
e
lO
ll
4.2
Choice of measuring geometries
In terms of the angles appearing in fig. 1, Prof. Morren employs illumination angles, 8 of 3.50, 2,50 and 1.330. For each of these illumination angles five different observation angles, cx, determined by d =
-+20', 30', 40', 60' or 90', are used giving 15
different sets of measuring angles for each sample.
The azimuthal angle, 8 is 1800 in each case.
On basis of these measurements Prof. Morren determines
the specific luminance for a range of simulated
distances from the headlight to the road marking and for a certain car geometry. In this car geometry the
headlight mounting height is 0.7 m, the observer eye
level is 1.2 m and the observer is situated 2 m behind
the headlight. For the simulated distances of 11.5 m,
16 m and 30 m the specific luminance can be determined
by interpolation among the measured data, while for
the distances 50 m, 75 m and 100 m an extrapolation to smaller illumination angles is required in addition
to interpolation. Some reliability in this extrapolation
is ensured by the fact that the specific luminance
should be zero at illumination parallel to the road
marking.
The measuring geometries used by Prof. Morren lead to
quite a large number of measurements, of which not all are relevant in practical situations, for instance geometries of large observation angles in combination with small illumination angles.
Therefore, in this report measuring geometries are chosen directly with reference to the distance on the
road. For the sake of simplicity the headlight and the
12
observer is assumed to be in the same distance to the
point of measurement. Further, the headlight mounting height and the observer eye height are set to the values currently used in the Nordic countries, namely
0.65 m and 1.2 m respectively. However, in order to
study the effect of varying the ratio between these
two heights and, not the least important, to be able
to duplicate and extend the measuring geometries used
by Prof. Morren, observer eye heights of l m and 1.5 m
are used also.
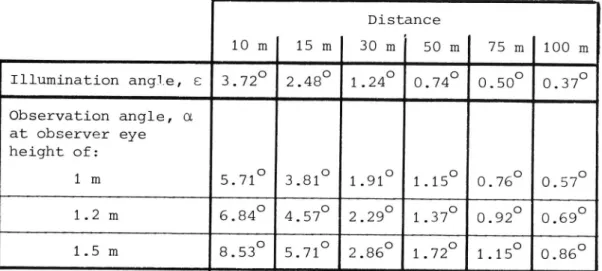
In these geometries the specific luminance is measured for simulated distances of 10 m, 15 m, 30 m, 50 m,
75 m and 100 m. The Values of observation and
illumina-tion angles are then computed to those found in table
2, while the simulated measuring geometries are shown
in fig. 4.
Table 2 Variation of the illumination angle, 8 and the
observation angle, d with the distance on the
road. The headlight mounting height is assumed to be 0.65 m, while the observer eye height is either 1 m, 1.2 m or 1.5 m. The observation point is directly above the headlight, so that
the azimuthal angle, 8 is
1800-Distance 10 m 15 m 30 m 50 m 75 m 100 m
Illumination angle, e 3.720 2.480 1.240 0.740 0.500 0.370
Observation angle, a at observer eye height of:1 m
5.710 3.810 1.910 1.150 0.760 0.570
1.2 m
6.840 4.570 2.290 1.370 0.92O 0.690
1.5 m
8.530 5.710 2.860 1.720 1.150 0.860
13
It is assumed in table 2 that the azimuthal angle, B
is 1800. In practise, however, at least one of the two headlights of a car has some lateral displacement from
the vertical plane of observation and the effect of
this displacement is hardly negligible for retroreflec-tive road markings. It was considered, therefore, to repeat all measurements for some B-angles differing from 1800. Unfortunately, the VTI equipment does not
at present allow this, so that the study of the effect
of the lateral displacements of the headlights must await further studies.
(35
A
A
A
.
.1
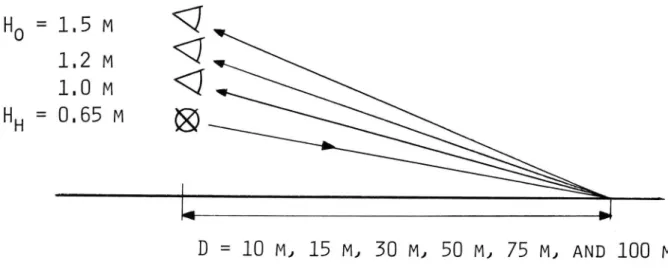
D = 10 M, 15 M, 30 M, 50 M, 75 M, AND 100 M
Figure 4 Geometries simulated in the measurements at
VTI.
H
0:
Observer eye heightHh: Headlight mounting height
D: Simulated distance on the road
4.3
Choice of aperture angles
Prof. Morren in his reports to the subcommittee on retroreflection concludes that the choice of aperture VTI REPORT NO. 189A
l4
angles is not important, buf eventuelly he uses quite
small aperture angels of 3.5' in the observation system
and 6' in the illumination system. In an internal report
to a Nordic working group, E. Frederiksen suggest
aperture angles of 5' in both systems, see Morkertrafik report No. 3. CIE publication No. 30 recommends that
for the measurement of road reflection tables the
aperture of the observation system should not exceed
5' in the vertical plane and 10' in the horizontal plane.
The equipment at VTI available for this work has in
the observation system aperture angles in the vertical
and horizontal plane of 12' and 22' respectively,
while the aperture angle of the illumination system
was adjusted to 13'
(diameter).
These aperture angles are reasonably small compared to
the steps in measuring angles of the geometries described
in table 2. This choice of aperature angles does,
therefore, allow a reliable determination of the varia-tion in specific luminance among the variuos measuring geometries.
The aperture angles used are, hoWever, comparatively
large, and modifications of the equipment should be
carried out, before more studies are initiated.
.4 Presentation and discussion of results
The measured specific luminances, SL are shown in the diagrams of fig. 5 to 13, one for each of the 9 road marking samples. In the diagrams the specific luminance
for each of the simulated observer eye levels 1 m,
1.2 m and 1.5 m, is given as a function of the distance
on the road. Each point represents a mean value of 5
different measurements.
15
The diagrams of fig. 5 to 13 indicate that at any
distance on the road the specific luminance is lower, the larger the observer eye height is.
The above-mentioned feature is quite natural, as all illuminated facets, micro-pearls etc. in the surface of the road marking are visible even at the lowest observer eye height. An increase in the observer eye
height thus results in an increase in the percentage
of the apparent area of the road marking, which is occupied by shadows. For road markings with
micro-pearls or other retroreflective elements a further
de-crease in specific luminance with increasingobserver eye height might result from the consequent increase in angular distance between the directions of
illumina-tion and observaillumina-tion.
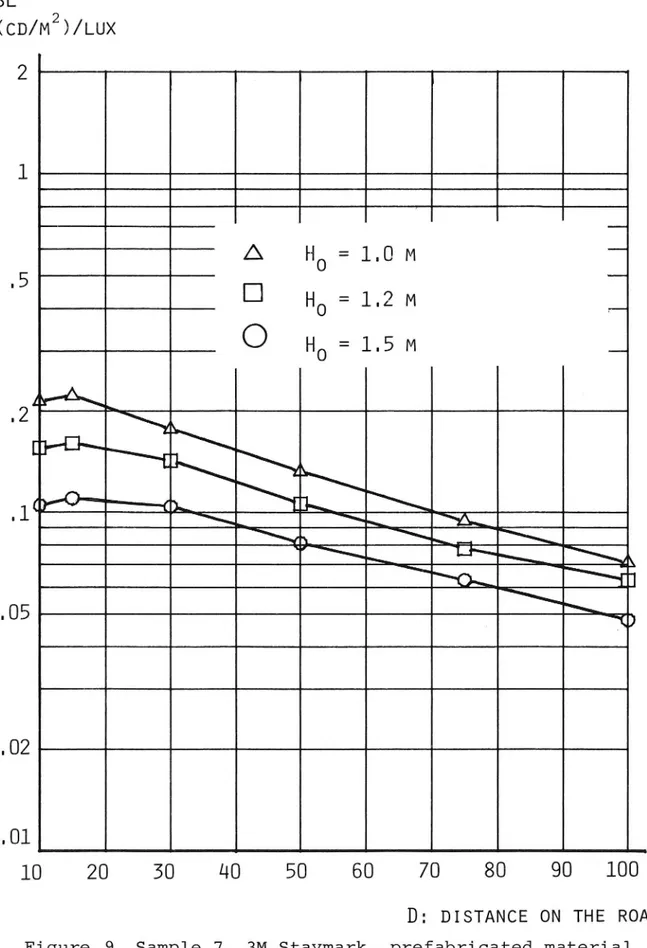
Those samples with drop-on micro-pearls 4, 5, 6, 7 and LTL 584, have roughly similarvariations of the specific ,luminance with the simulated distance on the road, see
fig. 6 to lO.The specific luminance shows an initial
increase up to a maximum at 15 to 30 m, and then decreases at larger distances.
A mechanism, which mightbe responsible for the above-mentioned initial increase in specific luminance with distance, is the increase in retroreflection of the pearls, as the angular distance between the directions
of illumination and observation decreases.
At larger distances the samples with drop-on micro-pearls show a decreasing specific luminance. For this a number of mechanisms might be responsible, but no explanations are forwarded at this point.
The sample with premix micro-pearls, LTL 153, has a somewhat different feature, as the specific luminance increases with distance up to distances about 75 m, VTI REPORT NO. 189A
16
see fig. ll.
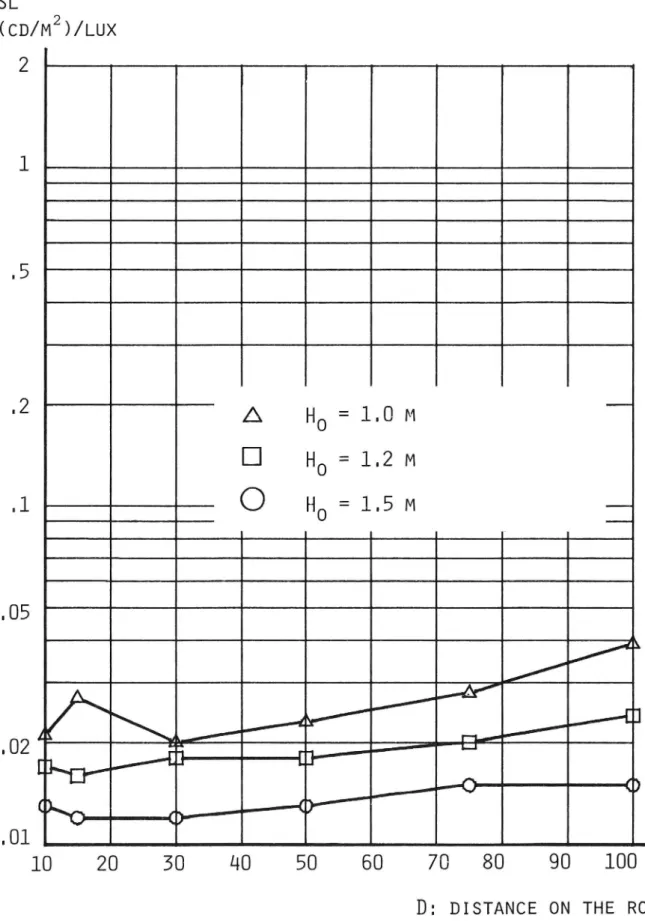
The samples without micro-pearls, 3, LTL 348 and VTI,
give an even more confusing picture, as the specific
luminance respectively decreases, stays roughly constant,
and increases with distance.
This, rather limited, set of road marking samples thus indicates that there is hardly any simple and universal
manner of variation of the specific luminance with the
distance on the road.
l7
SL
(CD/M2)/LUX
2
l
.5
[k
HO = 1.0 M
.2
[3
HO = 1.2 M
_M
O
HO = 1.5 M
.l H
Lr ' \ [- _ \.05
~ "
7*1
\~
f9
.02
.01
10
20
30
40
50
60
7O
8O
90
100 M
D: DISTANCE ON THE ROAD
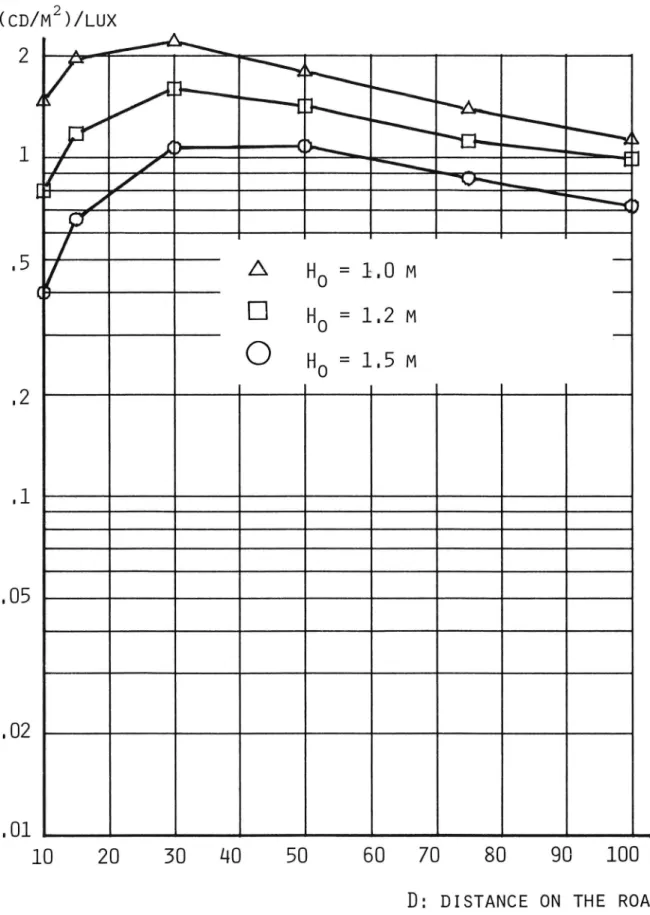
Figure 5
Sample 3, prefabricated material with network
of retroreflective, square pyramids. Specific
luminance values, SL are measured in the geometries of fig. 4.
18
SL
(CD/M2)/LUX
2
l
I"
52-\
\
ASE/J
N
" O\
C
.2
A
HO = 1.0 M
D HO = 1.2 M
.l
O HO = 1.5 M
..
«
.05
.02
.Ol
10
20
30
£10
50
60
7O
80
90
100 M
D: DISTANCE ON THE ROAD
Figure 6
Sample 4, 3M "Experimental sample", prefabricated
VTI REPORT NO.
material with drop-on micro-pearls of high
refractive index. Specific luminance values
measured, SL are measured in the geometries
of fig.
4.
19
SL
(CD/M2)/LUX
2
.05
.02
.01
10
20
30
40
50
60
70
80
90
100 M
D: DISTANCE ON THE ROAD
Figure 7 Sample 5, 3M Scotchlane, prefabricated material
with drop-on micro-pearls. Only micro-pearls
of high quality is used for this sample.
Specific luminance values, SL are measured in
the geometries of fig. 4.
20
SL
(CD/M2)/LUX
2
.05
.02
.Ol
10
20
30
40
50
60
7O
80
90
100 M
D: DISTANCE ON THE ROAD
Figure 8
Sample 6, 3M Staymark, prefabricated material
with drop-on and premix micro-pearls. Specific
luminance values, SL are measured in the
geometries of fig. 4.
21
SL
(CD/M2)/LUX
2
l
A
HO = 1.0 M
.5
__
D
HO = 1.2 M
__A
(:>
HO = 1.5 M
__
ZZA
.
\\\i&\\\ \
l
L_.
~ \\\f
. ~§ \~ < \.02
.01
10
20
30
40
50
60
70
80
90
100 M
D: DISTANCE ON THE ROAD
Figure 9 Sample 7, 3M Staymark, prefabricated material
with drop-on and premix micro-pearls. Specific
luminance values, SL are measured in the
geometries of fig. 4.
22
SL
(CD/M2)/LUX
2
l
5
A HO=l.0M
#
D
HO=12M
_.
O HO=l.5M
.2
Arl r¥ {5~ --~1'
{}~ -
&~
---\ ~ 3
J
<>
.05
.02
.01
10
20
30
40
50
60
70
8D
90
100 M
D: DISTANCE ON THE ROAD
Figure 10 Sample LTL 584, 3M Staymark, exposed to heavy
traffic for about one month. Specific luminance
values, SL are measured in the geometries
of fig. 4.
23
SL
(CD/M2)/LUX
2
1.0 M
I IIA
'3
H=l.2M
'
O
.2
HO = 1.5 M
__
M
.02
.Ol
10
20
30
40
50
60
70
80
90
100 M
D: DISTANCE ON THE ROAD
Figure 11
Sample LTL 153, spray plastic with premix
micro-pearls, exposed to traffic for a short
period. Specific luminance values, SL are
measured in the geometries of fig. 4.
24
SL
(CD/M2)/LUX
2
1
'5
A
HO = 1.0 M
__
D
HO = 1.2 M
O HO = 1.5 M
.2
1 i_A 1'1r
~ A
;r
H
45
LJ"
1
cf
1
.05
.02
.01
10
20
30
140
50
6O
70
80
90
100M
D: DISTANCE ON THE ROAD
Figure 12
Sample LTL 348, surface treatment with
large-sized (18 mm) Synopal stones. Specific
luminance values, SL are measured in the
geometries of fig.
4.
25
SL
(CD/M2)/LUX
2
2 _ ___
13
HO
1.0 M
[3
HO = 1.2 M
.1
O
HO = 1.5 M
__
.05
/ '.02
E}
,
u}"
-
__._.__=- -B-=
(KC
-<>/"
.Dl
_
10
20
30
40
50
60
7O
80
90
100 M
D: DISTANCE ON THE ROAD
Figure 13 Sample VTI, spray plastic without
micro-pearls. Specific luminance values, SL are
measured in the geometries of fig. 4.
26
5 COMPARISON TO MEASUREMENTS AT LTL
At LTL the samples, except for the VTI sample, were
measured in one of the geometries used at VTI for
reasons of providing a mutual check between the two sets of measurements. The geometry used at LTL
corresponds to an observer eye height of 1.2 m and a simulated distance on the road of 50 m, see fig. 3.
The aperture angles are 5'
(diameter) in both
observa-tion and illuminaobserva-tion systems.
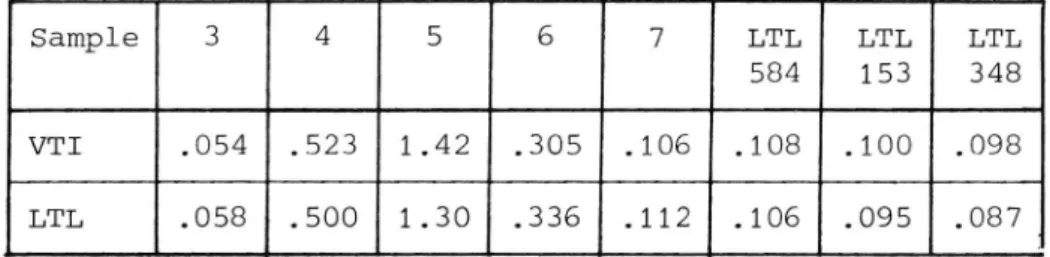
The two sets of results are given in table 3, from
which it appears that deviations are at most approximately 10%.
Table 3
Specific luminances, SL (cd/m2)/lux measured
for eight samples at VTI and at LTL for one
geometry, corresponding to an observer eye
height of 1.2 m and a simulated distance on
the road of 50 m. See fig. 4.
Sample 3 4 5 6 7 LTL LTL LTL 584 153 348 VTI .054 .523 1.42 .305 .106 .108 .100 .098 LTL .058 .500 1.30 .336 .112 .106 .095 .0871
27
6 COMPARISON TO MEASUREMENTS OF THE SUBCOMMITTEE ON
RETROREFLECTION
6.1 Conversion to the measuring geometry of the subcommittee The geometry considered by Prof. Morren in his
measure-ments for the subcommittee on retroreflection of CIE
committee TC-2.3, which is also discussed in section
4.2, is shown in fig. 14. Specific luminances for this
geometry is obtained on basis of the VTI measurements in the simulated geometries of fig. 4 in the following
way.
The distances on the road are first scaled to fit the
headlight mounting height of 0.70 m in fig. 14, instead
of 0.65 m as in fig. 4, by multiplication with
0.70/0.65 = 1.077. The new distances read 10.8 m, 16.2 m, 32.3 m, 53.9 m, 80.8 m and 107.7 m.
For the above-mentioned distances the observation
angles of the geometry of fig. 14 are respectively
5.360, 3.770, 2.000, 1.230, 0.830 and 0.630. Results
for these observation angles are now obtained by
inter-polation between VTI measurements for observer eye
heights of 1 m and 1.2 m, using the observation angles corresponding to these observer eye heights, as given in table 2. It appears, however, that for the shortest distance of 10.8 m a slight extrapolation is required
instead of an interpolation.
6.2 Presentation and comparison of results
Specific luminances for the geometry of fig. 14, and for the samples 3, 4, 5, 6 and 7, as obtained in the
manner described in the previous section are shown in
the diagrams of fig. 15 to 19 respectively. Also shown
28
in the diagrams are the results obtained by Prof. Morren
by means of interpolation and extrapolation as indicated
in section 4.2.
Fig. 15 to 19 show that at short distances on the road,
the results of Prof. Morren are 10% to 50% lower than
those obtained from the VTI measurements. With increasing distance on the road both sets of results show decreasing specific luminances, with, however, the less rapid
decrease shown by the results of Prof. Morren. At the
largest distances, the specific luminances obtained by
Prof. Morren are approximately 25% lower to 20% higher than those of VTI.
This comparison indicates for the shortest distances that there might be a difference in the scale of calibration, or other systematic differences, of
approximately 30%. Even allowing for this, a deviation of approximately 20% from sample to sample remains. The comparison further indicates that variations with
the distance on the road differ between the two sets
of results. Here the VTI results are probably the more reliable, as they are obtained most directly, while the other set of results is based on a rather complex set of interpolations and extrapolations.
(8?
HO = 1.2 M
HH = 0.70 M
Figure 14
VTI REPORT NO.
189A
Geometry considered by Prof. Morren. Results for this geometry are obtained by interpola-tion in the measuring results for the
geometries of fig. 4, for distances,
= 10.8 m, 16.2 m, 32.3 m, 53.9 m,
and 107.7 m.
D:
30
SL
(CD/M2)/LUX
2
AX
VTI (THIS WORK)
(:) PROF. MORREN (CIE TC-2.3)
-.05
.02
.Ol
10
20
30
40
50
60
70
80
90
100M
D: DISTANCE ON THE ROAD
Figure 15
Sample 3. Comparison of specific luminances,
SL for the geometry of fig. 14, as obtained
by interpolation in the VTI results,
and
as given by Prof. Morren.
31
SL
(CD/M2)/LUX
2
A:
VTI (THIS WORK)
(:)
PROF. MORREN (CIE TC-2.3)
.05
.02
.01
10
20
30
40
50
60
70
80
90
100 M
D: DISTANCE ON THE ROAD
Figure 16 Sample 4. Comparison of specific luminances,
SL for the geometry of fig. 14, as obtained
by interpolation in the VTI results, and as
given by Prof. Morren.
32
SL
(CD/M2)/LUX
2
A
_4
F--_ $~ ~orO /Q\
\\ &-\
1 \~ \<} -~H -____ l5.2
.1
13
VTI (THIS WORK)
__
(:)
PROF. MORREN (CIE TC 2.3)
*
.05
.02
.01
10
20
30
40
50
60
7O
80
90
100 M
D: DISTANCE ON THE ROAD
Figure 17
Sample 5. Comparison of specific luminances,
VTI REPORT NO.
1
SL for the geometry of fig. 14, as obtained
by interpolation in the VTI results, and as
given by Prof. Morren.
89A
33
SL
(CD/M2)/LUX
2
13
VTI (THIS WORK)
'
O
PROF. MORREN (CIE TC-2.3)
.02
.Ol
10
20
30
MD
50
60
70
80
90
100 M
D: DISTANCE ON THE ROAD
Figure 18
Sample 6. Comparison of specific luminances,
SL for the geometry of fig. 14, as obtained
by interpolation in the VTI results, and as
given by Prof. Morren.
34
SL
(CD/M2)/LUX
2
A:
VTI (THIS WORK)
(:)
PROF. MORREN(CIE TC-2.3)
'
if
1/ f
\M
.05
.02
.Ol
10
20
30
40
50
60
70
8O
90
100 M
D: DISTANCE ON THE ROAD
Figure 19
Sample 7. Comparison of specific luminances,
SL for the geometry of fig. 14, as obtained by interpolation in the VTI results, and as
given by Prof. Morren.
35
7 CONCLUSIONS
The measurements of VTI indicate that the specific
luminance of a road marking varies considerably with
the simulated illumination and observation geometry.
The ranges of these variations are for the samples and
the geometries considered in this investigation by factors of 2 to 5.
One feature of the above-mentioned variations seems to be universal, namely that larger observer eye heights
means smaller specific luminances.
Otherwise, the manner of the variation with the simulated distance on the road differs from sample to sample. For some samples the specific luminance first increases with distance, and then decreases at larger distances. For Other samples the specific luminance either stays roughly constant, or increases or decreases steadily with the simulated distance on the road.
These measurements thus reveal some interesting features, but the influence of the geometry is : n: from fully
clarified. Thus the measurements do not include a
lateral displacement between the observer and the head-light, which might be important. Further, most of the
samples are prefabricated materials (tape) of little
application in practise, as compared to paint and spray plastic. Moreover, the samples are either new, or has been worn for a short period only, and wet
conditions are not included.
Therefore, measurements should be carried on in order to include all relevant geometries, more road marking materials, realistic conditions of wear and wet condi
tions. Most likely new features of the influence of the geometry might emerge from such continued studies.
36
An intercomparison of the VTI measurements to a smaller set of measurements done at LTL indicates a relatively
good agreement. Another intercomparison to measurements
carried out by Prof. Morren for the subcommittee on
retroreflection of CIE committee TC-2.3 leads to a much
poorer agreement.
This discrepancy between the two sets of results is
partly attributed to the use of extrapolation by Prof.
Morren in obtaining some of the data.
In view of the above-mentioned, the goal of the sub-cOmmittee on retroreflection, to give at this point a single, standard geometry for the measurement of
reflection properties of retroreflective road markings, is hardly justified. Measurements carried out for the suggested, standard geometry, corresponding to a
distance on the road of 30 m, might not describe to a reasonable accuracy the reflection properties of road markings at distances that are longer and probably
more relevant to the drivers need of visual guidance.
Further, the standardization of a measuring geometry, choice of definitions, notations etc., for
retro-reflective road markings alone is not a very practical aim. In these matters there are vital interests in a joint consideration of road marking materials, with or without retroreflective elements, and road surfaces. Further, these matters should be considered with due regard to methods and conventions, which are already
established for reflection properties in the
illumina-tion situaillumina-tion in road lighting.
It can be hoped, therefore, that the CIE will initiate a work of a broader aim, as outlined above, and that further data will be collected and made available for
such a work.
37
REFERENCES
CIE report No. 30. Calculation and measurement of
luminance and illuminance in road lighting.
CIE, Paris (1976).
CIE. Road surfaces and lighting. Draft CIE technical
report of TC-4.6.
CIE. A report in view of drafting a recommendation for
the photometry of retroreflective road markings.
Draft CIE technical report of TC-2.3.
LTL report No. 9. Road surfaces in traffic lighting.
Kai Sorensen & Bjarne Nielsen, The Danish
Illuminating Engineering Laboratory, Copenhagen
(1974).
LTL report No. 10. Road surface reflection data. Kai
S¢rensen, The Danish Illuminatin Engineering
Laboratory, Copenhagen (1975).
Morkertrafik report No. 2. Vagbelaggningars ljustekniske
egenskaper. Nordic research co-operation for the
study of night time traffic conditions (1978).
Morkertrafik report No. 3 (to be published). Lystekniske
og visuelle forhold pa veje uden fast belysning.
Nordic research co-operation for the study of
night time driving conditions.
VTI internal report No. 89. Uppfoljning av faltforsok
med olika material for trafiklinjemarkering
1969 1970. National Swedish Road and Traffic
Research Institute, Sweden (1972).
VTI internal report No. 93. Undersokning av
trafikmar-keringsmaterial i statens vag- och