Reprinted from August 1990, Vol. 112, Journal of Solar Energy Engineering
Analysis and Simulation of a
Two-Phase Self-Pumping Water Heater
H. A. Walker
J.
H. Davidson
Solar Energy Applications Laboratory, Colorado State University.Fort Collins, CO 80523
The thermal per/ ormance of a two-accumulator self-pumping solar water heater is characterized in a daily simulation. The passive vapor transport system operates in cycles, alternating between run, pressurizing, and pump phases. Three isothermal closed-system thermodynamic models characterize the operational phases of the system. The applicable conservation of mass and energy equations of each model are combined in the numerical simulation. Instantaneous temperature and heat transfer rates, as well as integrated energy quantities and thermal efficiencies, are compared to experimental values. The qualitative behavior of the analytical model agrees with that of the physical system. Multiplying thermal loss coefficients by 2.5 and adjusting the theoretical solar model to correspond with measured insolation forces quantitative agreement of overall daily per/ ormance. The simulation reveals the impact of the duration of the pressurizing and pumping phases on overall per/ ormance. The volume and thermal capacitance of the components used during the pressurizing and pump phases should be minimized, while the insulation on those components should be maximized to optimize system per/ ormance. The val-idated model will be used in future work to optimize system design.
Introduction
Although self-pumping, two-phase solar heating systems have numerous advantages over mechanically pumped, sen-sible heat systems, experimental studies indicate that the design could be modified to improve thermal performance, reliability, and economics (Davidson et al., 1988, 1989; Hedstrom and Neeper, 1985, 1986; and Neeper and Hedstrom, 1985). Efforts at optimizing the design and efficiency of these systems have been largely heuristic. Neither the approximate algebraic model of a single accumulator system presented by Neeper (1988) nor a more detailed simulation developed by Gari and Fathalah (1986) applies to the dual accumulator design.
System operation is cyclic, progressing through a run or heat collection phase, a pressurizing phase, and a pump phase. During the run phase, shown in Fig. 1, liquid refrigerant (R-113) is gravity fed to the collector from the upper accumulator. Vapor travels downward to the condenser and liquid refriger-ant collects in the lower accumulator tank. After a preset quantity of refrigerant (determined by the setting of the lower float switch in the upper accumulator) condenses, solenoid valve No. l closes, solenoid valve No. 2 opens, and the pres-surizing phase shown in Fig. 2 begins. Since vapor is prevented from entering the condenser, pressures and temperatures in the collector and lower accumulator increase. When the pres-sure in the lower accumulator exceeds the prespres-sure in the upper accumulator by an amount equivalent to the hydrostatic pres-sure of the liquid column in the return pipe, the pump phase
Contributed by the Solar Energy Division of THE AMERICAN SOCIETY OF MECHANICAL ENGINEERS for publication in the JOURNAL OF SOLAR ENERGY EN-GINEERING. Manuscript received by the ASME Solar Energy Division, Oct. 18,
1989; final revision, Feb. 26, 1990.
is initiated and liquid refrigerant is forced from the lower to upper accumulator. As soon as the upper float switch is tripped, solenoid valve No. l reopens and solenoid valve No. 2 closes. This re-initiates the run phase and system temperature drops as pressurized vapor vents to the condenser.
System reliability is high, since neither mechanical pump nor solar controller are needed . Freezing, corrosion, and scaling are eliminated. Performance is expected to improve by using mechanically operated float valves, and in-tank condenser, and environmentally benign refrigerants. These modifications, which reduce the complexity and expense of the system and make the system totally passive, are addressed in an optimi-zation study (Davidson and Walker, 1990).
The drawback of the system is that intensified thermal losses during the pressurizing and pumping phases, when collector temperatures are significantly higher than storage water tem-perature, degrade thermal performance. The minimum rise in collector operating temperature (Tc) over water storage tem-perature (T,) required for pumping is,
(Tc - T,) = (p1gz)/(API A1)v. (1)
The practicality of this design depends on the extent to which the relative magnitude of these losses can be reduced .
This paper presents an analytical model of the two-accu-mulator self-pumping system and compares the results of a numerical daily simulation to experimental results (Davidson et. al. , 1989). The approximate analytical approach treats the system as three isothermal, lumped capacitance systems, each representing one phase of operation. The conservation of mass and energy equations of each model are combined and solved
VALVE SOLENOID VAL VE #2 . : .--~~-~~~~-"---,·· t
... :
UPPER
CCUMULATOR _ _ _.,ccuMULATOR UPPER
RESER VOI R +
!
!
i
,~---~_....c_v~---~+ c::l ···• VA POR - - UOUI O MECHANICAL PU MPING LOOP r---1 I c.v.Q I c~_____
___. STORAGE LOWE R ACCUMULATOR L-V
--@-~--~ CV D ···• VAPOR - - LIQUI O MECHANICA L PUMPING LOOP c v r--- - ----1 I c.v.Q CV1-l
i
l
l
l
l
i
r
L._v--0-
L--t
1
i
__ r
STORAGEFig. 1 Self-pumping two-phase solar water heater in the run phase Fig. 2 Self-pumping two-phase solar water heater in the pressurizing and pump phases
numerically. The system is modeled as a water heater, but any situation where it is desirable to passively transfer heat from an upper elevation to a lower one offers a potential application
of this system. The components included in the pressurizing, pump, and run models are illustrated in Figs. 3, 4, and 5, respectively. Com-ponents not included in a given mode model are considered as lumped capacitances being cooled (or heated) by system sur-roundings. Transition from one mode model to the next is accomplished by conserving the energy of those components Analytical Model
The system is modeled by identifying an isothermal, lumped capacitance closed-system model for each operational phase ..
No mencla ture
A area, m2
v
volume, m3
c specific heat, kJ/ kg°C w power, W
E
internal energy, Jw
work, JFRb collector heat removal factor x refrigerant vapor quality
modified for two-phase flow
z
height of liquid lift, mg gravitational acceleration, ex absorptivity, m2/ s
mls2
€ condenser effectiveness
hi v latent heat of the refrigerant, 8 angle between incident beam
J/ kg radiation and collector
nor-I insolation, W / m2 ma!, rad
Kra empirical incident angle T/ thermal efficiency' Q cond/ Q sol
modifier p density, kg/ m3
m mass flow rate, kg/s T
=
transmissivityM mass, kg
NTU
number of transfer units ap- Subscriptsplicable to the condenser a ambient
q heat flow rate, W beam beam radiation
Q heat, J b boiling
p pressure, kPa c collector
PE
gravitational potential en- cap thermal capacitanceergy, J cir circulating refrigerant mass
t time, s cond condenser
T
temperature, °C dd refers to those componentsUA
effective overall heat con- which drain down to lowerductance, W /°C accumulator
diff diffuse radiation
f
at the end of the day gain solar thermal gains by thesystem
at the beginning of the day
j component index
k index of the pressurizing pipe
liquid refrigerant loss thermal loss
0 reference value
pres pressurizing mode
pump pump mode
r refrigerant
run run mode
s water at the condenser inlet, assumed to be the same as bulk storage water
sol solar
sp incurred as a result of self-pumping
T
tilted at 45 deg with respect to the horizontalD ·•VAPOR • -LIQUID
UPPER PORTION ---~-'
OF LOWER .,,.,,,,,,, .. ,. • ·· • • ··· • • ACCUMULATOR
Fig. 3 Pressurizing phase analytical model
C'l -VAPOR •-LIQUID
LOWER .::::: .. • • • •· • ACCUMULATOR ~'.::;;'"''' dW
, dQ/on
Fig. 4 Pump phase analytical model
involved in the transition. The resulting temperature of the isothermal model is the capacitance average of the components. This technique is responsible for a small discontinuity in tem-perature upon changing from the run phase to the pressurizing phase.
Mass Transfer. Assuming isothermal conditions, heat transfer is always accompanied by mass transfer. Thus, the quantity, Mei,, the mass of liquid refrigerant available to the collector in both the reservoir and upper accumulator, is used to signal a change in operational mode.
Pressurizing Model. The pressurizing model, shown in Fig. 3, describes system behavior from the time the lower float switch in the upper accumulator is tripped until the pressure in the lower accumulator is sufficient to raise the column of liquid from the lower to upper accumulator. The pressure required to initiate pumping is,
(2)
where
P.,.
is the saturated vapor pressure in the upper accu-mulator at storage water temperature. At the onset of the pressurizing mode, when the reservoir is full and the upper accumulator is empty, Meir is arbitrarily set to zero. Differentialmass transfer from the collector loop to the lower components depends on the heat loss associated with condensation on the walls of those components which drain down to the lower accumulator, dQ1oss,pres,dd• heat required to increase the
tem-perature of those components, dQeap,pres,dd• and any change in
IZl •VAPOR • -LIQUID LOWER ACCUMULATOR UPPER ACCUMULATOR
Fig. 5 Run phase analytical model
vapor quality, dx. The expression for dMeir during pressurizing is,
dMcir,pres (dQ1oss,pres,dd
+
dQcap.pres,dd)h1 v Mr.pres dx,
(3)
where Mr.pres is the refrigerant mass and the subscripts dd refer
to those components which drain down. The circulating mass becomes increasingly negative during pressurizing. If M eir drops
below the mass contained in the reservoir and piping feeding the collector, the collector dries out and the system ceases operation. If this occurs, operation can be restored by sup-plying heat from an auxiliary source to the lower accumulator.
Pump Model. The pump model, illustrated in Fig. 4, in-cludes operation immediately after the system pressure reaches
Ppump until the liquid level in the upper accumulator reaches
the upper float switch. The system includes only the vapor portion of the lower accumulator. As a result, system volume increases by volume dVpump as liquid is pushed out of the lower
accumulator. During the pump mode, dMeir given by,
(dQ1oss,pump,dd
+
dQeap,pump,dd)dMcir,pump = - h
I v
dW - P . ,,a'Vpump (4)
- Mr . pump dx
+
gz,
increases as liquid is returned from the lower to the upper accumulator. The differential work used to pump is dW. The product P . ,.dVpump is the work done on the vapor in the upper
accumulator and does not contribute to the elevation of liquid refrigerant.
Run Model. The fixed volume, run phase model shown in Fig. 5 describes system behavior after the upper float switch is tripped until the refrigerant level in the upper accumulator reaches the lower float switch. The full reservoir only affects the heat capacity of the model. The expression for dMeir during the run mode is,
(dQeond
+
dQ1oss,run ,dd+
dQeap,run,dd)dMeir,run = - hi v (5)
- Mr,run dx,
where dQeond is the heat transferred to storage water via the
condenser. When M eir,run equals zero, the system begins another
cycle.
model to quantify energy flow rates and energy stored in the system. The differential radiant solar energy incident on the collector is dQ801. The portion of dQ.01 retained by the collector after optical losses is dQgain· The differential heat lost to the system surroundings is dQioss· The differential change in the energy stored in the system is denoted by dE. Energy conser-vation equations for the three models are:
dQgain - dQ1oss,pres = dEpres (6)
during pressurizing,
dQgain - dQ1oss,pump - dW = dEpump (7)
during pumping, and
dQgain - dQ1oss,run - dQcond
=
dErun (8)in the run mode. For given ambient and initial conditions, the only unknowns in equations (6), (7), and (8) are model tem-peratures.
Incident energy, dQ,01> is calculated using a standard
at-mosphere model along with sunpath geometry to express both the beam, fr.beam• and diffuse, Ir,diff> components of incident
radiation as functions of time of day, day of year, latitude, collector tilt and azimuth, and clearness indices (Duffie and Beckman, 1980).
Solar collector performance is modeled by modifying results of standard tests (ASHRAE, 1977) to account for two-phase operation. The absorber plate temperature is assumed to be uniform in the direction of the flow . Subcooling and super-heating in the collector are neglected. During the run phase, there is no superheating because the gravity feed maintains a full collector. During the pressurizing and pump phases, the liquid level in the collector drops and experimental data (Walker, 1989) indicate that some superheating occurs. How-ever, percolation in the riser tubes keeps the tube wall suffi-ciently wet to maintain a tube wall temperature profile which decreases from the collector midpoint to the outlet. The sat-urated operation assumption results in a boiling heat removal factor, FRb• equal to the collector efficiency factor (Neeper, 1987). In addition, since the convective heat-transfer coeffi-cient inside the tubes is much greater than the loss coefficoeffi-cient of the collector, F Rb reduces to a constant dependent only on the absorber plate geometry (Walker, 1989 and Davidson et al., 1989). The differential optical gain of the collector, dQgain•
is thus expressed as,
dQgain
=
(FRbra.)Ac(fr,beamKT<X,beam+
fT,diffKT<X,diff)df. (9)The empirical thermal-loss coefficient of the collector, mod-ified by FRb• is combined with loss coefficients of the other components to form the overall loss coefficients, UA10 .., of
the mode models. The loss coefficients of all components other than the collector are calculated by treating the component wall, insulation, and outside air as serial resistances in parallel. Heat loss from the pressurizing and pump mode models to the liquid in the lower accumulator, dQ10ss,la• is calculated using an approximate integral technique with an assumed linear tem-perature profile in the stratified liquid (Walker, 1989).
Heat transfer across the condenser, dQcond• is modeled using an NTU-effectiveness relation with the assumption that the capacitance flow rate of the refrigerant is much greater than that of the water. Thus, dQcond is
dQcond = m,t:, E (T - T,)dt, (10)
where E is a function of temperature and heat exchanger
prop-erties.
The differential expression for work done by the pump mode model is,
dW = P.,dVpump· (11)
The incremental volume change of the pump model, dVpump•
divided by the time increment, dt, determines the volume flow
Table 1 System component description
A c= 1.7 m1 (FRbTCX) = 0. 7938 (FRbUc) = 4.74 W/ m1C Km = I - 0.09 [(l/coslJ) - I) (Mc)c = 4752.0 J/ C Ve = 0.0011 m3 m, = 0.13 kg/ s M, = 300.0 kg (UA), = 11.97 W/C
z
= 6.2 msingle-pass, brass shell-and-tube heat exchanger, A = 1.05 m1
type L, 1.27-cm copper piping, total length = 45.4 m upper accumulator, 3-mm steel, V = 26 !tr.
lower accumulator, 1.6-mm steel, V = 19 !tr. reservoir, 1.6-mm steel, V = 11 !tr.
rate of the returning condensate. Neglecting pipe and valve friction and inertia, dVpump is a function of the geometry of the two accumulators and the lifting height,
dz = (dPv - dPv.s)I p1g. (12)
The energy of the system, E, includes internal energy of the refrigerant and hardware as well as gravitational potential en-ergy. Internal energy of each system model is,
E = (Mc)(T- T0 )
+
E,+
PE, (13)where (Mc) is thermal capacitance of the components included in the specific model, T0 is an arbitrary reference temperature,
E, is the internal energy of the refrigerant, and PE is the gravitational potential energy of refrigerant elevated above the liquid level in the lower accumulator.
Due to the nonlinearity of the relation of refrigerant prop-erties to temperature, equations (6), (7), and (8) are solved iteratively using a simplified secant method. A finite difference scheme is used to simulate daily performance in 1-s intervals.
Comparison of Simulated and Experimental
Perform-ance
To assess the validity of the daily simulation, output of the model is compared to measured results obtained during a single day as part of a 2-year experimental study of a single collector, self-pumping solar system in Fort Collins, Colo. (Davidson, et al., 1988, 1989). The physical characteristics of the actual system are listed in Table I. Two simulations of the system are compared to the experimental study. Run 1, in which an-alytical loss coefficients and the theoretical solar model are used, overestimates the thermal performance of the experi-mental system. In an effort to determine the source of dis-agreement between model and reality, loss coefficients are increased by a factor of 2.5 and solar radiation multiplied by I. I (to conform to the maximum measured insolation) in Run
2.
Measured and predicted temperatures are plotted in Figs. 6 and 7. Figure 6 compares daily predictions of system and water temperatures to actual collector outlet temperature and water temperature at the condenser inlet. Since ambient temperatures in the model are specified to match actual conditions, only measured ambient values are shown. Temperatures during a single midday cycle are shown on an expanded scale in Fig. 7. Daily simulated heat transfer rates q,01> qgain• q10.., qcond and
power required to pump, w, as well as experimental values of q501 and qcond• are shown in Fig. 8. Significant operational
points are noted on each plot with corresponding number des-ignations. Runs I and 2 are distinguished from the experimental data with a single and double prime, respectively.
Morning Heat Recovery. Daily operation is characterized by three periods: morning warmup, repeating midday cycles, and evening shutoff. The first mode of operation each day is determined by the status of the system at the end of the previous
day. On this particular day, operation begins in the run phase. Duration of the initial run phase depends on refrigerant volume in the upper accumulator as well as climatic conditions. The actual initial refrigerant volume is not known but is guessed to be half that of the upper accumulator. Based on the
simi-80 --T 70 60 50 40 30 20 10 QL 80 70
®·®
I (.)"'
60..
..,
50 w 40 a:: :::>li
a:: 30 w Q. 20 :Ii RUN 2 w...
10 0 80 70 60 50 40 30 20 EXPERIMENTi:oo
7i!O BOO 900 10:00 11:00 1200 1300 14.00 15:00 16:00 17-00 IB·OOTIME OF OAY
Fig. 6 Run 1 and Run 2 simulated system temperatures and actual collector outlet and ambient temperatures measured on Apr. 6, 1988 plotted throughout the day
65 (.) "'
..
..,
60 w a:: :::>...
<t a:: 55 w Q. :Ii w...
50 5 10 15 20larity in lengths of the simulated and actual initial run phases, this assumption appears reasonable.
As shown in Fig. 6, the first run phase is characterized by slow heating of the system as it recovers from overnight cooling of the refrigerant and hardware. Since thermal losses are less significant at the low temperatures characteristic of this period, no significant difference in the two predicted temperatures curves exists prior to 7:30 a.m. Agreement in simulated and measured temperatures supports the theoretical treatment of the system as a single lumped capacitance. The model, how-ever, cannot account for the fluctuations in collector outlet temperature (noted at point 1 on the experimental curve) which mark a change from sensible to latent heat collection. System temperatures do not exceed water temperatures until nearly three hours after sunrise at point 2. At this point , a positive value of q conct in Fig. 8 indicates that useful heat is recovered.
At pom 3 on Figs. 6 and 8, the switch from the first-run pha&e to the pressurizing phase is denoted by a sharp increase m temperature and no heat transfer across the condenser. The discontinuities in simulated temperatures at this point are a consequence of changing from the run system model to the lower temperature pressurizing model. Changing ambient con-ditions cause trivial changes in subsequent pressurizing/ pump/ run cycle characteristics until point 8 late in the day. There is, however, a gradual increase in system temperature with rising water temperature. Thermal losses estimated in Run I are less than those of the poorly insulated experimental apparatus . Consequently, simulated heat flow across the condenser is exaggerated, water temperatures are increasingly overesti-mated as the day progresses, and cycle duration is too short. Run 1 predicts nine midday cycles contrasted with seven actual cycles. The gross discrepancies between model and experiment are corrected in Run 2, but as seen in the expanded midday cycle temperatures, the isothermal model does not replicate the details of actual operation .
Midday Cycles. The limitations of the model are apparent in the midday cycle temperatures plotted in Fig. 7. The cycle begins at point 4 in the pressurizing phase. For the sake of comparison, this cycle is modeled with the initial water tem-perature equal to the measured value.
Pressurizing Phase. The actual pressurizing phase lasts 13
--
EXPERIMENT----
RUN I ... RUN 2 7" ,_,, 7 25 35 40 45 TIME (min)Fig. 7 Run 1 and Run 2 simulated system temperatures as well as collector outlet temperature measured on Apr. 6, 1988 plotted through· out the midday cycle beginning at 11:40 a.m.
2.2 2.0 1.8 1.6 ···Qcond ,
~
--- qloss !!
! --- Qsoll
· : : ·
RUN I 1.4 1.2 1.0 0 .8 0 .6 0.4 0 .2 0 3: -0 .2""
2.2 a: 2.0 w- ~
: ; . 3: 1.8 0 ll.. 1.6 RUN 2 w 1.4ti
1.2 0:: 1.0 0:: w 0.8 u.. en 0 .6 z ~ 0:: 0.4 I- 0.2 I- 0 ~ w -0.2 :c ~® 4" 2.2 2.0 1.8 1.6 EXPERIMENT 1.4 1.2 1.0 0.8 0 .6 0.4 0 .2 0 -0 . 2~~~~~~~~~~~~~~~~~~ 6.00 700 8:00 9:0040:0011:0012:0013:0014:0015:0016.0017:0018:00 TIME OF DAYFig. 8 Run 1 and Run 2 simulated solar insolalion (q.01), collector ther·
mal gains (qg.1,,), system losses (q,0 .. ), heat across the condenser (q000
.>
and pumping power (w) and actual solar lnsolatlon (q.0J and heat across the condenser (q000.>
measured on Apr. 6, 1988 plotted throughout the dayminutes, ending at the knee in the collector outlet curve at point 5. In Run 1, the pressurizing phase is 10 minutes long, ending at point 5' . In Run 2, the duration of the pressurizing phase (ending at point 5 ") agrees with the measured value. However, due to the inability of the isothermal model to ac-count for localized superheating in the collector, simulated temperatures are consistently 2-3 °C lower than measured val-ues. The increase of thermal losses during this phase, shown in Fig. 8 between points 4 and 5, with increasing temperature emphasizes the impact of the duration of pressurizing on per-formance .
Pump Phase. At the beginning of the pump phase, the rate
of temperature increase slows as the system does work to el-evate the liquid refrigerant. The slope of the temperature curve during the pump phase conforms to the rate of pressure in-crease and is proportional to the rate at which the height of the liquid column increases. Actual pumping occurs from point
5 to point 6 in four minutes. The predicted pumping time of
Run 1 is approximately one minute ending at point 6'. Run 2 pumping occurs in just under two minutes ending at point 6" . The shortened pump phase in both runs is due to under-estimation of the lower accumulator temperature.
Conse-quently, condensation on the free surface of the liquid in the lower accumulator and the exposed metal walls is not ade-quately represented. In a daily simulation, expanding differ-ences in water storage temperature can increase the disparity in pumping duration. Neglect of both collector superheating and pipe friction is the source of the 2°C depression of pre-dicted temperature below measured collector outlet tempera-ture.
Simulated pumping power, shown between points 4 and 5 in Fig. 8, is nearly constant at approximately 30 W for Run 1 and 21 W for Run 2. Roughly half of pumping work increases the potential energy of the refrigerant and is recuperated as thermal energy as the refrigerant descends to the lower ac-cumulator during the run phase. The other half compresses the vapor present in the upper accumulator and is recuperated as thermal energy since the upper accumulator is at all times open to the condenser.
Run Phase. The temperatures and heat transfer rates across
lhe condenser plotted for the real system in Figs. 7 and 8 reveal the non-isothermal aspects of system behavior. The plateau in collector outlet temperature in Fig. 7 occurring between 18 and 22 minutes is caused by liquid refrigerant previously heated in the pressurizing and pump phases entering the collector before the cooler liquid from the lower accumulator. The depression in temperature, circled in Figs. 6 and 7, and the sharp drop in qcond• circled in the experimental curve of Fig.
8, are due to subcooled liquid from the upper accumulator entering the collector. Collector inlet temperature drops more than 20°C during this run cycle. Eventually, the warming of liquid in the upper accumulator and the mixing of liquid exiting the collector with liquid from the upper accumulator cause collector inlet and outlet temperatures to stabilize. Spatial vari-ations in temperature are not accounted for within the ana-lytical model of Fig. 5.
At the beginning of the run phase, simulated temperatures in Fig. 7 drop sharply as vapor expands into the condenser. Figure 8 indicates a corresponding increase in q cond as energy
stored in the system thermal capacitance during the pressur-izing and pump phases is transferred to the condenser. After the initial drop in temperature, simulated temperatures decay to three to 5°C above water temperature. Consequently, as shown in Fig. 8, thermal losses and heat flow rates across the condenser decrease. Temperatures during steady-state opera-tion in Run 1 are as much as 2°C higher than in the real system. Run 2, with increased thermal losses, predicts temperature to within 1 ° C. The run phase ends at point 7.
Cycle thermal efficiencies, defined as heat transferred across the condenser divided by energy incident on the collector during one cycle, for Runs 1, 2, and the real system are 54, 39, and 36 percent, respectively.
Evening Shutoff. Attenuation of available solar energy in the afternoon prevents the system from completing the last pressurizing phase. Beginning at points 8, 8 ', and 8 " in Fig. 6, temperatures increase well above water temperature, but do not rise enough to pump. Consequently, all energy collected during the last pressurizing phase is lost as the system cools over night. Energy loss depends primarily on the operational status of the system late in the afternoon. Usually, the system ends the day in the pressurizing phase. Pressurizing continues only if collector temperature is elevated above storage tem-perature by the amount required to pump whereas the run phase progresses as long as insolation is adequate to maintain collector temperature above storage temperature. The system is likely to end the day in the run mode only in the event of afternoon clouds.
The randomness of this end-of-the-day loss is apparent in the three-system temperature curves of Fig. 6. In the actual system, 4.65 MJ of incident radiation is wasted pressurizing
the system from 3 p.m. until sunset. In Run 2, the last pres-surizing phase begins at 3:11 p.m. after which 5.24 MJ is incident on the collector. With lower loss coefficients, rumping can occur at lower insolation levels. Li ing theore:ical los coefficients in Run l, the number of cycles is increased and last pressurizing phase is 90 minutes later at 5:30 pm . As a result, only 1.41 MJ of available energy is lost.
Daily efficiency of the system is defined as the he t trans-ferred to the storage water divided by the energy incident on the collector from sunrise to sunset. Run I predicts a daily efficiency of 44.2 compared to 27. l percent for Run 2. Ex-perimentally measured self-pumping thermal efficiency is 26 .5 percent.
Thermal Penalty of Self-Pumping
In a perfectly insulated system, the only effects of self-pumping would be fluctuation of the internal energy of the system and intermittent heat transfer across the condenser. Energy stored within the system would increase during pres-surizing and pumping, but during the run phase, all stored energy would be transferred to storage water. Thus. none of the energy required to lift liquid from the lower to upper accumulator would be lost.
In reality, thermal losses cannot be avoided and the increase in collector and lower accumulator temperatures required for pumping decreases system efficiency. The elevation of oper-ating temperature, T, above water storage temperature, Ts,
required to drive the steady heat flow rate across the condenser which occurs at the end of the run phase is D..Tcond· Any tem-perature elevation above (Ts
+
D..Tcond) is attributed to self-pumping. The length of time that T is elevated above (Ts+
AT cond) depends primarily on the total time spent in the pres-surizing and pump phases. Temperatures are also elevated early in the run phase before energy stored in the thermal capacitance of the system during the pressurizing and pump phases exits across the condenser or is lost to the system surroundings. In addition, losses from the pressurizing pipe connecting solenoid valve No. 2 to the lower accumulator are attributed to self-pumping, since this pipe is needed only during the pressurizing and pump phases. Also, capacitance effects must be considered if the pipe temperature at the end of the day is higher than at the beginning of the day. Thus, total daily thermal loss due solely to self-pumping is given by,
Qioss,sp
=
~dayE
{ (UA)iossJC0 -
Ts - A Tcond) )dtj
+
~day {(UA)1oss.k(Tk
- T0))dt+
(McMTkJ - Tk) (14)where the subscript j refers to all components except the pres-surizing pipe, which is represented by subscript k.
Values of Qioss..sp are listed in Table 2 along with overall daily energy quantities. Also shown in Table 2 is the estimated re-duction in daily efficiency in percentage points caused by self-pumping, AT/sp· Experimental values of Q10ss,sp and AT/sp are
determined by comparing operation of the self-pumping system to the identical system operated with a mechanical pump (Dav-idson et al., 1989). Values of ATJsp predicted by the simulation are determined by subtracting the efficiency of the self-pump-ing simulation runs from the efficiency of runs which are identical except that the liquid refrigerant is instantaneously returned to the upper accumulator at the end of a run phase. A comparison of the value of Qioss..sp in Run l and Run 2
indicates that overall thermal loss coefficients do not corre · spond exactly with the thermal penalty of self-pumping. In-creasing the loss coefficients in Run 2 by a factor of 2.5 over those in Run l increases Qioss.sp by a factor of 2.8. The mag-nitude of the first integrand in equation (14) increases pro-portionally to the increase in (UA)1055 , but the time that Tis
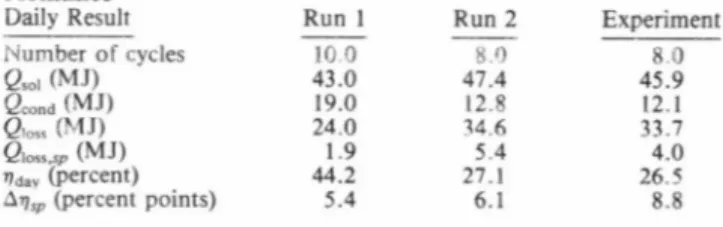
Table 2 Comparison of daily measured and simulated per-formance
Daily Result Run 1 Run 2 Experiment
Number of cycles 10 0 8.1) 8.0 Q ,01 (MJ) 43 .0 47.4 45 .9 Q cond (MJ) 19.0 12.8 12.l Q ioss (MJ) 24.0 34.6 33 .7 Qloss.sp (MJ) 1.9 5.4 4.0 'ldav (percent) 44.2 27.l 26.5 671,P (percent points) 5.4 6.1 8.8
elevated above (Ts
+
D..T cond) also increases since cycle duration is lengthened. Note that Q10ss,spl Q,01 is not equivalent to AT/spsince only a portion of Qioss..sp would be delivered to the water in a mechanically pumped system.
Taken independently, AT/sp is somewhat misleading since a 5-9 percentage point drop in daily efficiency may not be critical for a well-designed system operating at 60 percent efficiency. However, in this system ATJsp equal to 8.8 means that actual self-pumping operation hypothetically dropped system effi-ciency to 26.5 percent from 35 percent for the identical system operated with the mechanical pump. In Run 2, using vapor pressure to pump decreases daily thermal efficiency by 18 per-cent, from 33 .2 to 27. l percent. The thermal penalty of self-pumping predicted in Run l is significantly less. With a 31 percent decrease in total thermal losses as compared to Run 2, self-pumping causes only an 11 percent drop in efficiency, from 49.5 to 44.2 percent. This result emphasizes the impor-tance of insulation and component selection on overall per-formance.
Conclusion
The self-pumping, boiling collector system is potentially more cost effective, more reliable, and more thermally efficient than current solar heating systems. The technical feasibility of the design is proven. The emphasis of the current research is to identify methods of improving system operating characteristics and collection efficiency. In this paper, an analytical model of the system is developed and incorporated into a daily sim-ulation. The approximate model simulates system operation in three distinct isothermal phases: pressurizing, pumping, and running (heating).
Comparison of the simulation to experimental data supports the validity, but also indicates the limitations, of the analytical model. The qualitative behavior of the analytical model agrees with that of the physical system. However, quantitative esti-mates of energy flow rates and efficiency differ. This is partly due to the inability of the isothermal model to predict spatial variations in temperature resulting from subcooling in the con-denser, but the majority of the discrepancies are attributed to underestimation of thermal losses from the poorly insulated experimental system. It is possible to adjust this parameter and thus force the theoretical predictions to match the exper-imental behavior of the system.
Both the experimental data and theoretical analysis identify elevated collector temperatures and concurrent aggravated thermal losses during pressurizing and pumping as the major culprit in reducing overall performance. The duration of these phases depends on lifting height, refrigerant quantity and prop-erties, and thermal capacitances and volumes of the collector, reservoir, lower accumulator, and connecting piping. The pip-ing and tanks used in this prototype system could support a larger collector area than the I. 7 m2 considered here. Increasing
the collector area would improve performance by increasing gains without proportionally increasing losses. An additional loss mechanism is the inability to take full advantage of low insolation values in the evening. This loss may be reduced by decreasing system capacitance and volume.
In the current design, the reduction in efficiency attributed to using vapor pressure to pump is on the order of nine
per-centage points. Daily efficiency of the experimental system averaged over a heating season increased from 17 to 26 percent by avoiding the cyclic temperature excursions t rough the use
of a mechanical pump (Davidson et al. , 1989). Ui.mg relatively high loss coefficients, the simulation predicts that self-pumping reduces efficiency from 33.2 to 27 .1 percent on a representative April day in Fort Collins, Colo. In a well-insulated system, simulated with theoretical loss coefficients, the detrimental effects of using vapor pressure to pump are minimized. Self-pumping decreases daily efficiency only 11 percent, from 49.5 to 44.2 percent. The reduction in efficiency attributable to self-pumping is one figure of merit which may be used to evaluate future designs.
The simulation results point out the inadequacies of the present design. Considerable improvement in performance is expected for a second generation system with optimized in-sulation and component selection. A parametric study of the effects of design parameters on self-pumping performance is underway. The theoretical model described in this paper will be used to determine the effects of collector area, relative component elevation, circulating refrigerant and accumulator volumes, heat exchanger size, insulation, and working fluid selection on overall performance. The environmental hazards associated with chlorinated fluorocarbons are of primary con-cern in selecting the working fluid . Alternative refrigerants under development hold promise for the future .
Acknowledgments
The support of the U.S. Department of Energy through grant No. DE-FG03-86SF16036 and the Colorado State University Computer Center are gratefully acknowledged.
References
ASH RAE, 1977, " Methods of Testing to Determine the Thermal Performance of Solar Collectors. " Standard 93-77, American Society of Heating Refriger-ation, an<l Air Conditioning Engineers, Atlanta, Ga .
Davidson, J . H .. and Walker, H . A., 1990, "Design Optimization of a Two-Phase Passive Solar Water Heater," presented at SOL TECH 90. Austin, Texas, March, 1990.
Davidson. J. H ., Walker, H . A., and Lof, G. 0. G., 1988, "Development and Improvement of Self-Pumping Boiling Collector Solar Hot Water Storage System," Final Report, June 1987 - May 1988, Department of Energy Report No. SAN 16306-9.
Davidson, J . H .. Walker, H . A., and Lof, G. 0 . G., 1989, " Experimental Study of a Self-Pumping Boiling Collector Solar Hot Water System, " ASME JOURNAL OF SoLAR ENERGY ENGINEERING, Vol. 111 , pp. 211-218.
Davidson, J . H., Walker, H. A., and Karaki, S., 1989, "Development and Improvement of Self-Pumping Boiling Collector Solar Hot Water Storage Sys-tem, " Final Report, June 1988 - March 1989, Department of Energy Report No. SAN 16306-13.
Duffie, J ., and Beckman, W., 1980, Solar Engineering of Thermal Processes,
John Wiley and Sons, New York, pp. 6-81 .
Gari. H., and Fathalah, K .. 1986, " Investigations of a Very Long Heat Pipe, ·• King Abdulaziz University Research Projects, Sponsored by SANCT. Report No. 3, Grant No. At-6-067.
Hedstrom, J . C., and Neeper, D. A., 1985, " Passive Vapor Transport Solar Heating Systems," Proc. 10th National Passive Solar Conference, Raleigh, N .C.,
p 231.
Hedstrom, J . C.. and Neeper. D. A., 1986, " Passive Space Heating With a Self-Pumping Vapor System," Proc. ASES I/th National Passive Solar Con-ference, Boulder, Colo., pp. 493-498.
Neeper, D. A., and Hedstrom, J.C., 1985, "A Self-Pumping Vapor System For Hybrid Space Heating," Proc. Congress !SES, Montreal, pp. 440- 444.
Neeper, D. A., 1987, "Efficiency of a Solar Collector With Internal Boiling,"
ASHRAE Trans., Vol. 92, pp. 295- 308.
Neeper, D. A., 1988, " Analytic Model of a Passive Vapor Transport Heating System," Solar Energy, Vol. 41 , pp. 91 - 99.
Walker, H. A., 1989, "Theoretical and Experimental Analysis of a Two-Phase Self-Pumping Solar Water Heating System," Master's Thesis, Colorado State University.