Evolving Mario levels
for dimensions of
quality
PAPER WITHIN Product development, specialization in machine learning. AUTHOR: Filip Mattsson
TUTOR:Tutor
JÖNKÖPING Month 2021
An evaluation of metrics for the subjective quality of
Super Mario levels
Postadress:
Besöksadress:
Telefon:
Box 1026
Gjuterigatan 5
036-10 10 00 (vx)
551 11 Jönköping
This exam work has been carried out at the School of Engineering in
Jönköping in the subject area of product development with a
specialization in machine learning
.
The work is part of the two-year AI
engineering programme.
The authors take full responsibility for opinions,
conclusions and findings presented.
Examiner: Maria Riveiro
Supervisor:
Vladimir Tarasov
Scope: 30 credits (second cycle)
Abstract
Procedural level generation has long since been prevalent in video games. A desire to make the methods used more generalised has recently sparked an interest in adapting machine learning for this purpose. However, this field is still relatively nascent and has several open questions. As such, this study investigated several metrics for the evaluation of machine learning assisted level generators for Super Mario Bros. This was done by using a generative adversarial network (GAN) together with evolutionary programming to generate levels that maximize the aforementioned metrics individually. Then, in order to establish correlative relationships, a user study was conducted. In this user study, participants were asked to play through the generated levels and rate them according to enjoyment, aesthetics, and difficulty. We show significant correlations between several metrics and the three dimensions of quality; some such correlations are also, seemingly, independent of prior gaming experience. We contribute to the field of machine learning assisted level generation by 1) reinforcing certain metrics’ validity for use in the evaluation of level generators, and 2) by demonstrating that this evolutionary approach can be used to control difficulty effectively.
Keywords
Machine learning, Level generation, GANs, Super Mario, Procedural Content Generation, Genetic Programming.
Contents
Contents
1
Introduction ... 5
1.1 PROBLEM DESCRIPTION ... 6
1.2 PURPOSE AND RESEARCH QUESTIONS ... 6
1.3 OUTLINE ... 7
2
Background ... 8
2.1 LEVEL GENERATION ... 8
Related work ... 8
2.2 GENERATIVE ADVERSARIAL NETWORKS ... 11
Wasserstein GANs ... 11
2.3 LATENT VARIABLE EVOLUTION ... 11
2.4 COVARIANCE MATRIX ADAPTATION EVOLUTIONARY STRATEGY ... 12
2.5 THE ΦK CORRELATION COEFFICIENT ... 12
2.6 THE GENERATOR ... 12
3
Method and implementation ... 15
3.1 GENERATOR ... 15
3.2 EXPERIMENT ... 15
Metrics ... 15
User study ... 16
Analysis ... Fel! Bokmärket är inte definierat. 3.3 VALIDITY ... 21
4
Results and analysis ... 23
4.1 BACKGROUND DATA COMPOSITION ... FEL!BOKMÄRKET ÄR INTE DEFINIERAT. 4.2 QUALITY CORRELATION ... 23
4.3 EFFECT OF BACKGROUND ... 24
5.1 BACKGROUND DATA COMPOSITION ... FEL!BOKMÄRKET ÄR INTE DEFINIERAT.
5.2 QUALITY CORRELATION ... 27
5.3 EFFECT OF BACKGROUND ... 28
5.4 ISSUES WITH METHOD ... 28
6
Conclusions ... 29
6.1 FURTHER WORK ... 29
Introduction
1
Introduction
This thesis investigates how to evaluate machine learning-assisted level generators for video games. Level generation is a prominent type of Procedural Content Generation (PCG) (Summerville et al., 2018) which refers to the algorithmic creation of new content for video games such as levels, items, characters, dialogue and story. It has seen use in the games industry for several decades, starting in the 1980s with Rogue1 (Summerville et al., 2016) and continuing
in the 1990s with Elite2 (Summerville et al., 2018). More contemporary examples include games
such as Minecraft3 (2011 – current), Binding of Isaac4 (2011), No Man’s Sky5 (2016 – current),
Deep Rock Galactic6 (2020), and Hades7 (2020). All these games use PCG to varying extents,
the one in which it is most prominent is likely No Man’s Sky, which uses it to generate an effectively endless amount of 3D galaxies with fully traversable planets as well as to generate the flora and fauna of said planets. Conversely, games like Hades and Binding of Isaac only generate finite 2D interconnected dungeon levels using several pre-built rooms. Note that all games mentioned above employ some form of level generation. In large part due to this prominence, this study focuses on level generation.
Although the scope of the PCG techniques employed in the games like the ones mentioned above is? varied, they all rely on hand-crafted rules to some extent. This means that these PCG algorithms require work and are highly specific to each game’s needs. Because of this, there is an increasing interest in developing algorithms that can potentially be generalisable, or at least require less game specific rules. Consequently, there is a growing field of research investigating how to apply machine learning algorithms to PCG, or in the case of this study, applying it to level generation.
The field of level generation using machine learning (LGML) is still relatively immature. It has only existed for around a decade, with one of the earliest notable events within it being the 2010 Mario AI competition, which had a level generation track (Shaker et al., 2011). Because of this immaturity, there are several significant open questions within the field. The question that this study seeks to partly address is that related to evaluation. How does one evaluate a level generator? 1https://archive.org/details/msdos_Rogue_1983 2https://playclassic.games/games/space-simulation-dos-games-online/play-elite-online/ 3https://www.minecraft.net 4https://store.steampowered.com/app/113200 5https://www.nomanssky.com 6https://www.deeprockgalactic.com 7https://www.supergiantgames.com/blog/hades-faq
1.1 Problem description
The issue is that there seems to be no agreed-upon way to evaluate levels and, by extension, level-generators. As such, there is an extensive range of different evaluation methods used within the field of LGML. They range from qualitative (Thakkar et al., 2019) analysis of singular levels to quantitative analysis using metrics (Snodgrass & Ontañón, 2015; Snodgrass & Sarkar, 2020; Snodgrass & Ontañón, 2017b; Summerville & Mateas, 2016). The issue with the former is that it is difficult to compare these evaluations between studies as well as to provide a holistic picture of the generator’s quality. The issue with the latter is that there is no agreement upon which metrics are suitable (Summerville et al., 2017), which, again, makes it difficult to compare studies. In addition, there is no good reason to believe that the different metrics that are used accurately capture the generators’ quality. It is, of course, difficult to approximate the quality of a generated level. This because the quality of a level and, by extension, a level generator is largely subjective. This means that some studies instead seek to measure how alike the generated and original levels are. However, this is still dependent on developing good metrics. Just because generated and original levels match perfectly in some arbitrary set of metrics does not mean that they match perfectly, or even well, when taken as a whole. Regardless, the goal of a generator is not necessarily to perfectly match original levels. Indeed, the goal of a generator is to generate somewhat novel levels that are perceived as “good” by people who play them.
A natural solution to this is to rely on user studies to rate generators, however, this takes time and resources that are not necessarily available to all researchers. They also grow increasingly infeasible at larger scales. As such, it is of vital importance to the field that metrics that can approximate subjective perception of quality from the average player as accurately as possible are developed. This study supports to achieve this goal. There have been previous attempts at developing just such metrics. This study builds on the work done by Summerville et al. (2017), and further investigates the correlation between the metrics proposed in it and perceived dimensions of quality. We did this by selecting a subset of metrics for each dimension of quality and using them individually to build fitness functions for an evolutionary algorithm. We thee asked people to rate levels generated with said fitness functions. For this, we employed a pre-built generator made by Volz et al. (2018) and modified the fitness function used in the LVE algorithm used by the selected generator.
Summerville et al. (2017) tested the correlation between the metrics they presented and dimensions of quality they considered: enjoyment, aesthetics, and difficulty, but did not investigate any causal relationships. So, in addition to further testing the correlations they found, the result of this study can also indicate whether there is a causal relationship between the metrics selected and the quality dimensions. The results can impact the field in two primary ways: 1) as discussed, they can further indicate the validity of using these metrics for pure evaluation and 2) they can indicate whether these metrics are useful for use in evolution processes to customize one of the quality dimensions.
1.2 Purpose and research questions
The purpose of this study is to further test how well some of the metrics for quality presented in Summerville et al. (2017) correlate to perceptions of difficulty, enjoyment, and aesthetics. The research question that is answered is formulated like this:
“How does the maximization of a subset of metrics from Summerville et al. (2017) through evolution correlate to players’ perceptions of enjoyment, difficulty, and aesthetics?”
Maximization above refers to the numeric maximization of selected metrics when measured in levels. For example, in the case of the “number of jumps” metric, the goal was to create a level that requires as many jumps as possible to complete. As stated, this maximization was done through evolution, or specifically, Latent vector evolution (LVE). More on this later in the paper.
Introduction
1.3 Outline
This report is organized as follows. First, we describe relevant background before elucidating the method used. We then present the analysis and results in chapter. Finally, a discussion of the results and the conclusions are provided.
2 Background
This section presents the background knowledge required for understanding the terminology and concepts used within the study as well as the context of the research field in which it is undertaken.
2.1 Level generation
As stated, the field of LGML is still relatively immature, only coming into existence approximately one decade ago. One of the earliest examples of activity within it being the level generation track in the 2010 Mario AI championships (Shaker et al., 2011). Consequently, there are many open questions and challenges related to it. To name a few: there is the issue of generalized level generators, i.e., a generator that can learn from one game’s levels and generate new levels for some other game or games (Snodgrass & Sarkar, 2020). Another issue is that of non-linear level generation (Summerville & Mateas, 2016). Most research in the field focuses on super Mario levels. Super Mario is a linear game most of the time. This means that games such as super Metroid that have large, connected, and non-linear levels present a new challenge that has not been investigated in depth yet. Finally, there is the issue which this study focuses on, that of evaluation. To help demonstrate these challenges, primarily the one concerning evaluation, a presentation of related work is given below.
Related work
Summerville & Mateas (2016) aimed to utilize a LSTM (Long Short-Term Memory) network for generating Super Mario levels. Mainly, they discuss the differences between eight different level representations. They generated these sequences by combining three properties in an alternating fashion: path information, column depth information, and snaking or top-to-bottom. Including path information is done by running an A* agent through training levels and replacing characters in the sequence string with a special character if the A* agent passes through the tile being represented. Column depth is represented by creating a special character in the sequence that is incremented every five columns. Snaking is an order which goes from top-to-bottom and then bottom-to-top in an alternating manner.
They evaluated their method by generating 4000 levels and comparing them with existing levels using several metrics:
• C – the percentage of levels that are completable by a simulated agent (A*). • e – The percentage of the levels taken up by empty spaces.
• n – The percentage of empty space that is reachable by the player.
• l – The leniency of the level, sum of enemies and number of gaps minus the number of rewards.
• R2 – The linearity of the level, how close the level can be fit to a line.
• j – The number of jumps on the optimal path in the level.
• ji – Number of meaningful jumps in the level; defined as being induced via the
presence of an enemy or the presence of a gap.
They conclude that the most important insight from their work is that the introduction of player path information dramatically improves the playability of generated levels.
Another study conducted by (Snodgrass & Ontañón, 2017b) developed and tested a way of representing levels. Here, a level is represented with three layers of information; one layer, called the “structural layer,” conveys the placement of objects in the level. A second layer, called the “path layer,” captures the path which a player takes through the level. The last level, the
Background
To evaluate this representation, they use a multi-layered Multi-dimensional Markov Chain (MdMC) by generating 250 levels using 4 different path layers, i.e., 1000 levels. Two of the path layers were generated from running an A* agent on two “Super Mario Bros” levels (1-1 and
2-1). The other two were hand-crafted. Afterwards they used a single-layer model using only the structural layer to generate another 1000 levels and compared the two sets of levels using four metrics:
• Linearity: Calculated by measuring the average distance between every platform and a line fitted to said platforms
• Leniency: Calculated by summing all the gaps (weighted by gap length) and enemies in the levels and then normalizing by the length of the level.
• Fréchet: Measures the distance between two paths. Used to approximate the ability of the level generators to adapt to the path layer.
• Springboards: They measure the fraction of tiles that are springboards as well as the fraction of springboards that are required to complete the level. This captures the models’ ability to generate more nuanced tile types in meaningful ways.
In addition to comparing the two generated level sets they also compared them to the used training levels.
They conclude that their multi-layer model can capture nuances like springboards better than the tested single-layer model. Additionally, they state that the multi-layer model can be guided using the path layer. Thus, lending more control to the designer.
Snodgrass and Ontañón have made similar attempts to use MCs and MdMCs ( Snodgrass & Ontañón, 2015, 2013) in the past. Of particular interest is a study where they tried to apply a variety of MC models to three different games: Kid Icarus8, Super Mario Bros9, and Lode
runner10 (Sam Snodgrass & Ontañón, 2017a). They conclude that the attempted application of
MC techniques to lode runner and Kid Icarus highlight the MC models’ trouble with long-term memory and larger structures. Summerville & Mateas (2016) stated this weakness as part of their motivation for investigating LSTMs.
Another study conducted by Thakkar et al. (2019) employs a combination of a VAE (variational autoencoder) and a multi-population evolutionary algorithm to generate levels for lode runner. They state that VAEs have only been cursorily investigated as a PCG approach. They point to one study that has investigated it, but only used a single-channel encoding. In contrast to this, Thakkar et al. made use of a five-channel encoding; each channel serves to let the autoencoder learn the patterns of different types of tiles in a lode-runner level. Namely, bricks, ladders, ropes, gold, and enemies.
They evaluate their method by qualitatively analysing and comparing levels made with their autoencoder before and after the evolutionary process. They conclude that their method can produce a large amount of significantly different playable levels.
8https://kidicarus.fandom.com/wiki/Kid_Icarus 9https://en.wikipedia.org/wiki/Super_Mario_Bros 10https://en.wikipedia.org/wiki/Lode_Runner
Summerville et al. (2017) conducted a study investigating a set of metrics that can be used to evaluate levels. The authors claim that the metrics that are currently used cannot accurately capture human perception of enjoyment, difficulty, and aesthetic quality. They present several metrics and investigate their correlation with human ratings of the perceived dimensions of quality discussed above. The correlations were calculated using Spearman coefficient, which is a correlation coefficient designed to compare ordinal variables (Baak et al., 2020). They also use a simple LASSO model to filter out insignificant metrics for each quality dimension and to predict human ratings based on their presented metrics. Lastly, they calculate the correlation of the evaluations of two independent human raters (inter-rater correlation) to get an idea of the upper bounds for their metrics’ predictive power. They achieve predictive performance (MAE) that outperforms an earlier attempt to predict human evaluations using a neural network and older metrics. They also determine that some of their metrics correlate strongly with one of the three quality dimensions some are close to the empirical upper bounds.
Additionally, Volz et al. (2018) used a generative adversarial network (GAN) (Goodfellow et al., 2014) together with a covariance matrix adaptation evolutionary strategy to generate new levels for the “Super Mario Bros” game. They split their approach into two steps. The first step consists of training a GAN using 173 training images (multi-dimensional number arrays). These levels are encoded as multi-dimensional arrays, with different tile types being represented as an assigned number. The training images were adapted from existing level string representations from an existing level corpus, the VGLC (Summerville et al., 2016). The second step consists of an evolutionary exploration of the latent space in the gaussian noise that is used as input to the generator. Normally, sample vectors would be drawn randomly from the latent space.
They configure the evolutionary algorithm with four different fitness functions split into two categories: Representation-based testing, which optimizes the evolution for a certain distribution of tiles or enemies. The other category, agent-based testing, seeks to optimize the evolution based on the performance of an A* star agent on the candidate levels.
To evaluate the representation-based evolution, they compare the targeted percentage of ground-tiles; they also present a level in which they have used agent-based evolution. To evaluate their agent-based evolution, they gave four generated example levels; one shows a level that maximizing jumps, the second a level minimizing jumps, the third a level that is unplayable, and the fourth, a level that contains “broken tiles”, e.g., a pipe that comprises faulty tile combinations. In conclusion, they remark that their approach can optimize levels for different tile distributions as well as agent-based criteria. They also say that, whereas the GAN is able to capture high-level structures, it struggles with more local structures. This is evidenced by the “broken tiles” that can be generated. Lastly, they claim that their approach is promising and could potentially be extended to other games and genres (not platformers) in the future.
In one very recent article, published in 2020 by Snodgrass & Sarkar , the authors attempt to use a combination of a VAE and a binary space partitioning (BSP) algorithm for generating levels across multiple domains, i.e., learn from levels of one or more game and generate levels for another. To do this, they first define two layers of abstraction for level representation, a Full
Resolution layer and a Sketch Resolution layer. The tile type encodings composing the
sketch resolution layer are shared across all domains, but the full resolution layer comprises different tile types for different domains. They represent three different tile types in the sketch resolution layer:
• #. An impassable element • -. A passable element
• ?. A wildcard that can be either passable or impassable
The basic pipeline of the BSP algorithm used is first, an input sketch resolution level representation is fed to the BSP algorithm. This input sketch can either be selected from a training dataset or generated from an existing level using the VAE. Second, the BSP splits the sketch into different regions. Finally, structural matches for those regions are found in the training data and are used to generate full resolution levels.
Background
They evaluate each of the stages of their pipeline and then the pipeline in its entirety. They conclude that the generation is heavily impacted by the choice of training domains, i.e., which games one includes in the training data. Thus, one can control the trade-off between different blending goals by shifting the training domains selected.
2.2 Generative adversarial networks
A GAN is a particular constellation of neural networks often used for generating new data based on a pre-existing distribution. It was first proposed by Goodfellow et al. (2014) and consists of two neural nets. One is called the Generator or G, the other, Discriminator or D. D works much like a classical classifier neural network. It is pre-trained on a training dataset until it reaches a satisfactory accuracy and serves to distinguish samples generated from G from the true distribution. G generates new samples from a latent space of noise. The goal of the GAN training process is for G to learn a mapping from said noise to the true distribution. It learns to do this by incorporating predictions of D into its error function. Back-propagation is then applied in both networks, ideally increasing G’s ability to create samples, and D’s ability to scrutinize said samples.
Wasserstein GANs
Wasserstein GANs (WGAN) (Arjovsky et al., 2017) are a type of GAN in which the training process is replaced by one that minimizes the so-called earth-mover (EM) distance. This distance measures the difference between two probabilistic distributions. In the case of a GAN, these two distributions being the underlying genotype distribution and the learned phenotype distribution. This training scheme has been shown to solve the mode collapse issue usually encountered when using a GAN. Additionally, it also mitigates the issue of vanishing gradient. Mode collapse refers to when a generator outpaces the discriminator and learns to produce an especially plausible output, and starts to produce only that output (Thanh-Tung & Tran, 2020). On the other hand, vanishing gradient refers to cases where gradient-based learning methods (propagation) fail to provide enough information. This happens when the back-propagated gradient becomes “vanishingly” small and thus does not update the weights in the earlier network layers to any meaningful extent. Effectively, this means that learning can slow to a crawl or effectively stop. (Hochreiter et al., 2001)
The generator used in this study incorporates a WGAN.
2.3 Latent variable evolution
Latent Variable Evolution (LVE) is a process first introduced by Bontrager et al. (2018). The idea of the process is to use an evolutionary algorithm to search through the space of latent vectors of a GAN in order to minimize or maximize some metric. The general procedure is 1) randomly select a set of latent vectors (the population). 2) feed each candidate into the GAN and evaluate the output using a fitness function. 3) create a new population-based on the best candidate from the previous evaluation. And (4) repeat the process from step 2 until some termination criteria are met. Then, the latent vector that resulted in the best fitness is acquired as output from the process. LVE can be used with any evolutionary algorithm.
The generator used in this study and proposed by (Volz et al., 2018) uses LVE to tailor the generated levels.
2.4 Covariance Matrix Adaptation Evolutionary Strategy
The Covariance Matrix Adaptation (CMA) is an evolutionary strategy in which new candidate solutions are sampled from a multivariate normal distribution. Recombination is done by selecting a new mean value from the distribution, and mutation is done by adding random vectors. A covariance-matrix represents the pairwise relations between the variables in the distribution. The adaptation of the matrix serves to update it and is done by learning a second-order model of the fitness function (objective function). This method makes notably fewer assumptions than classical optimization methods. Only the ranking between the candidates are used to learn the sample distribution; neither the derivatives nor even the values of the function themselves are required for the method to work. (Auger & Hansen, 2012)
The generator used by this study and proposed by Volz et al. (2018) uses CMA to perform LVE.
2.5 The
ϕk correlation coefficient
A correlation coefficient is a statistical measure of the (in)dependence of two or more variables. There are many coefficients with differing capabilities. For example, the de facto standard coefficient for comparing interval variables, i.e., variables that have well-defined intervals between values, is the Pearson correlation coefficient. A well-known weakness of this coefficient is that it does not capture linear relations well. (Baak et al., 2020)
A relatively new one, the ϕk correlation coefficient was proposed by Baak et al. (2020), and is derived from the Pearson χ2 contingency test, and uses a statistical significance test derived
from the G-test. It has several advantages compared to other statistical tests. Mainly, it applies equally well to all variable types (nominal, ordinal, ratio, and interval) and any mix thereof. In addition, the method includes a noise correction against statistical fluctuations. Unlike some other coefficients, it exists in a range between 0 and 1, with 0 meaning no correlation and 1 meaning perfect correlation.
The significance test is, as stated, based on the G-test. More specifically, Monte Carlo sampling techniques are used to generate 500 different synthetic data sets for which the G-test statistic is calculated. The average of the resulting g-test distribution is then used as an effective number of degrees of freedom. This nedof is then used together with a modified χ2 distribution
to get a p-value which is then converted to a standard Z-score.
𝑍 = 𝛷−1(1 − 𝑝) (1)
Where ϕ-1 is the quantile of the standard Normal distribution, for example, a p-value of 0.05
corresponds to Z=1.64.
This study utilizes the ϕk correlation coefficient to determine the dependence between the fitness functions used for levels (nominal) and the human ratings of those same levels (ordinal). More on this in section Fel! Hittar inte referenskälla..
2.6 The generator
The generator created by (Volz et al., 2018) was used to generate the levels for this study. As such, a more detailed description of said generator is presented in this section.
Generally, the generator can be seen as comprising two parts; a GAN and an evolutionary algorithm that performs LVE.
Background
The GAN is a deep convolutional one (DCGAN), using strided convolutions in the discriminator and fractional-strided convolutions in the generator. It uses ReLU activations for each layer in the generator (we made that choice since Volz et al. (2018) found it to perform better). The discriminator, on the other hand, uses LeakyReLU activation in all layers. The GAN is also a Wasserstein GAN (See section 2.2.1 for details on WGANs).
To train the GAN, Volz et al. (2018) clipped a text-based representation of level 1-1 from the original Super Mario Bros acquired from the VGLC (Summerville et al., 2016) into many 28-tile wide smaller levels by sliding a 28-28-tile wide 14-28-tile high (the original level is 14 28-tiles high) rectangle across the level tile-by-tile from left to right. The tiles in these text-based representations are represented by a certain character. Not all these characters were used in the GAN training and can thus not be generated by it. One notable example are springboards. The level was then encoded as strings of integers, each integer mapping to a character from the original text encoding. Lastly, these integer representations were one-hot encoded; they were then padded to be 32 tiles-wide and 32-tiles high. This is because the DCGAN implementation expects an input size to be a multiple of 16. The one-hot encoding and padding in conjunction resulted in an input size of 10x32x32. See Fel! Hittar inte referenskälla. for a visualization of each encoding.
Figure 1: Tile encodings used in the generator. At first, levels are encoded using the VGCL symbols, then they are converted into integer encodings that are one-hot encoded so that they can be used in the generator.
Once the training was concluded, the output of the generator was cropped back to 10x28x14, before an argmax operation was applied to it in order to convert the one-hot vectors into integers again. Afterwards, this output could be decoded by the Mario AI framework11 to
simulate levels.
As for the second part of the generator, the evolutionary algorithm. Volz et al. (2018) used CMA-ES to perform LVE. They used CMA-ES to optimize four different fitness functions, which they split into two categories: representation-based testing and agent-based testing. The former includes functions that optimize for a certain distribution of tiles. The latter uses an AI agent to optimize certain playthrough data. The two representation-based functions they used are:
𝐹𝑔𝑟𝑜𝑢𝑛𝑑= √(𝑔 − 𝑡)2 (2)
This function is based on the distance between the actual fraction of ground tiles in the level, g, and the targeted fraction, t. The second function is formulated as follows:
𝐹 = 𝐹𝑔𝑟𝑜𝑢𝑛𝑑+ 0.5(20.0 − 𝑛) (3)
11https://github.com/amidos2006/Mario-AI-Framework
Tile type Integer encoding VGLC symbol Visualization
Solid/ground 0 X
Breakable 1 S
Empty 2
-Full question block 3 ?
Empy question block 4 Q
Enemy (goomba) 5 E
Top-left pipe 6 <
Top-right pipe 7 >
Left pipe 8 [
As for the agent-based functions, they also used two of those. The first was formulated thusly:
𝐹 = { −𝑝 𝑓𝑜𝑟 𝑝 < 1
−𝑝 − j 𝑓𝑜𝑟 𝑝 = 1 (4)
Where 𝐹 is the fitness of the level, 𝑝 is the percentage of the level that has been traversed horizontally, 0 meaning no traversal, and 1 meaning the level was completed. Finally, j is the number of jumps the agent made to complete the level; Volz et al. (2018) argued that the amount of jumps could reasonably be seen as a proxy for difficulty. The metric was identified as somewhat correlative to difficulty by Summerville et al. (2017), although it is less so than many other metrics. Consequently, it was not one of the metrics selected for investigation in this study.
The agent used to calculate both 𝑝 and j was implemented before-hand in the mario AI framework12. It was originally developed by Robin Baumgarten and won the 2009 Mario AI
competition (Togelius et al., 2013). Note that all terms have a negative sign, this is because CMA-ES seeks to minimize the fitness function.
The second function used only differs slightly from the first, it was formulated as follows:
𝐹 = {−𝑝 + 60 𝑓𝑜𝑟 𝑝 < 1
−𝑝 + 𝑗 𝑓𝑜𝑟 𝑝 = 1 (5)
The offset of 60 served to discourage unbeatable levels where the agent gets stuck and jumps repeatedly, resulting in all passable levels scoring higher than impassable ones.
The only part of the generator that was modified for this study was the evolutionary fitness functions (more details regarding this are given in section 3.1).
Method and implementation
3 Method and implementation
This section describes the method used in the study in detail. It took the form of an experiment with a quantitative analysis. The description is split into two components: the first describes the level generator used, and the second describes the setup of the user-study.
3.1 Generator
This study uses the generator developed by Volz et al. (2018) with a pre-trained version of their GAN13. This generator was chosen for two primary reasons: 1) It was shown by Volz et al.,
(2018) to respond well to different fitness functions, and 2) LVE imposes implicit limits on the evolutionary process. LVE can only generate levels that already exist within the GAN’s latent space, thus preventing absurd levels that maximize metrics to a point of silliness. For example, filling every tile with enemies. We chose to use evolution in the first place because evolution is the only optimization method that allows for any fitness function. This was necessary because we needed to optimize using data from an agent that plays through the levels. The only part of the generator that was modified was the fitness functions used for evolution. One function was constructed for each metric selected for investigation. However, these functions are quite similar, making it possible to formulate them generically. The formulation is as follows:
𝐹 = { −𝑝 𝑓𝑜𝑟 𝑝 < 1
−𝑝 − 𝑚 𝑓𝑜𝑟 𝑝 = 1 (6)
Where 𝑝 is the fraction of the level which was completed, 𝑝 is calculated via the code provided by Volz et al. (2018) and, as such, it follows their definition. Finally, m is a generic term that stands in for any of the metrics selected for investigation. Note that CMA-ES (the evolutionary algorithm used for the LVE process) minimizes the fitness function. As such, the terms are within the function are all negated since the goal is to maximize the metrics in question. The modified generator can be found on GitHub14
3.2 Experiment
The experiment undertaken for this study was a user study in which participants were asked to play through levels generated by the generator described above and report their perception of three dimensions of quality for each level, namely: difficulty, enjoyment, and aesthetics. These levels were made to maximize a subset of different metrics from previous work by using LVE. These metrics have been shown to correlate strongly to the aforementioned dimensions of quality. The purpose of the experiment was to further test whether these correlations hold in a new context. It also sheds some light on whether the correlation is a result of causation. The rest of this section provides further information on the components of this experiment.
Metrics
Only a subset of metrics from Summerville et al. (2017) was used for the study. This was due to a time constraint, both for the participants in the user study and the study’s development. As the number of metrics selected for investigation increases, the number of levels that need to be generated does as well. Consequently, the number of levels that users need to play through also increases. With this limitation in mind, only the metrics which had at least the second highest correlation value for one or more dimensions of quality were selected. The following is a presentation of the selected metrics along with the correlation values for the dimension of quality they ranked highest with, as found by Summerville et al. (2017).
13 https://github.com/TheHedgeify/DagstuhlGAN 14 https://github.com/famattsson/MarioThesisGenerator
Enemy σx – This is the standard deviation of the x positions of the enemies in a level. It
serves to measure the horizontal distribution of the enemies and was shown to correlate the most with difficulty with a spearman coefficient of 0.50. It was calculated thusly:
𝐸𝜎𝑥(𝑀) = √
∑ (𝑒(𝑥)𝑖− 𝑒(𝑥)̅̅̅̅̅̅𝑖) 2 𝑒∈𝐸
[𝐸] (7)
Where 𝑒(𝑥)𝑖is the x position of the ith enemy, M is the level, and E is the set of enemies in
M.
Number of enemies – Simply measures the number of enemies in the level. It correlated
strongly with both difficulty and enjoyment, with a spearman coefficient of 0.72 and 0.42, respectively.
Enemy Sparsity – This was calculated similarly to the calculation of Enemy σx, the difference being the removal of the squaring in favour of an absolute operation. It was the second-most correlative metric for enjoyment with a spearman coefficient of 0.27. It was calculated thusly:
𝐸𝑆(𝑀) = √∑𝑒∈𝐸[𝑒(𝑥)𝑖− 𝑒(𝑥)̅̅̅̅̅̅𝑖]
[𝐸] (8)
Where 𝑒(𝑥)𝑖is the x position of the ith enemy, M is the level, and E is the set of enemies in
M.
Power Up μx – This was the mean value of the x positions of power-ups, i.e., full question blocks, in the level. It correlates most strongly with aesthetics, with a spearman coefficient of 0.23. It was calculated thusly:
𝑃𝑈𝜇𝑥=
∑𝑒∈𝑃𝑈𝑝𝑢(𝑥)𝑖
[𝑃𝑈] (9)
Where 𝑝𝑢(𝑥)𝑖is the x position of the ith power up block, and PU is the set of power up tiles
in M.
User study
3.2.2.1 ApparatusParticipants were given access to a playable Super Mario implementation playing in a web browser using JavaScript. In conjunction with this, a REST API hosted on a web server was used to collect ratings and background information from the participants. The REST API communicated with a database in which it stored all the data. Both the Mario game (with web server code) and the REST API can be found on GitHub1516. See Figure 2 for a visual overview
of these components and how they interact.
15 https://github.com/famattsson/MarioThesisFront 16 https://github.com/famattsson/MarioThesisAPI
Method and implementation
Figure 2: A visualisation of the components of the apparatus and how they interact.
Some design decisions had to be made when creating the JavaScript-based Mario-game. The first concerned the parsing of levels; the encoding used for generation does not specify which powerup a question block should contain, neither does the 𝑃𝑈𝜇𝑥metric. For this reason, a
decision had to be made as to what powerup to put in the blocks. Two options were considered: 1) randomize the type of powerup placed in each question block, and 2) pick one power-up and use it for every entire question block. The first one was discarded because it would introduce a lot of variability in the power experienced by every player. This would make it difficult to compare ratings from different players. The second option brought another question; which powerup? Original Super Mario only contained two power-ups: fire flowers and mushrooms. Using the same logic as was used to reject the first option, mushrooms were chosen. Fire flowers are a much more powerful power up and allow the player to completely trivialize enemies. This power-spike would also introduce large amounts of variance. The argument could be made, that this would inherently harm the power of the 𝑃𝑈𝜇𝑥 metric, since fire flowers are a large part of
how powerups affect the levels. However, we deemed this trade-off to be worth this caveat. The second decision was also in regards t0 level-parsing and was closer to a necessity. The issue was that, sometimes, the generator created levels where enemies were placed at, or too close, to the player’s starting position. This meant that players would get hit immediately and lose the level over and over endlessly. This clearly had to be fixed. To do so, we simply coded the level parser not to allow enemy placements too close to the player’s start position.
A mechanism was needed to relate the background information people provide at the start of the study with the ratings they left later. If not, the background information is next to useless. This was done rather simply; when a participant first loads into the game, a UUID is generated, stored within a cookie in the participant’s browser, and sent to the study’s database through the API. This cookie was then sent together with each rating. It is true that one could simply remove their cookies and re-join the study, because of this, we also stored the IP address of the player in the database. The reason why these IP addresses were not used a participant ID was that we did not want to store the IP addresses after the study concluded.
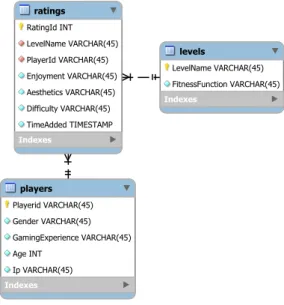
As for the more general functioning of the database, it contained three tables: ratings, players, and levels. The ratings table, as the name implies, contained all the ratings left by study participants. Importantly, the ratings table included two foreign keys, one for players (UUID), and one for levels (level name). Lastly, it also contained a unique constraint for level name and player UUID. The players' table contained background information, player UUIDs, and IP addresses. It also had a unique constraint on player UUID and IP address. Finally, the levels table contained the name of the levels (0-19) and the fitness functions used in their generation. See figure 3 for a graphical overview of the database.
Figure 3: ERD of the database used for the study. The red squares mean that the associated column is a foreign key
3.2.2.2 Procedure
Participants were asked to play through 20 generated levels which were pre-loaded into the web-based Mario game. 10 levels were generated for each fitness function (each metric), resulting in 40 levels in total. Every level was of identical height and width, i.e., 14 by 28 tiles. These levels were then combined pairwise, which resulted in 20 levels with a length of 56 tiles. See Figure 4 for images of some level snippets.
Figure 4: Images of parts of generated levels, one for each of the four fitness functions, from left to right, they are generated using: Enemy standard deviation x, Enemy sparsity, Number of enemies, and Power up mean x.
The number of levels per fitness function was selected based on the time it would take for participants to complete the levels. The first time a participant started the web-based Mario game, they were prompted to provide some background information, namely, age (integer), gender (Man, Woman, Other), and level of gaming experience (None, Some, Moderate, Much, very much). Additionally, when a player finished a level by reaching the goal, they were prompted by the game to give their ratings of difficulty, aesthetics, and enjoyment on a 5-point scale (Very low, low, moderate, high, very high). These ratings were automatically sent to the database through the REST API hosted on the web server.
There was an effort made to establish some baseline of skill. This effort was split into two measures: First, a text-based tutorial was included in the distributed Mario build. The tutorial was quite short and only explained the very basics of the game, i.e., the goal of the level, the way enemies work, and the controls.
Method and implementation
The second measure was implemented after a test was performed in which we closely observed two people, who had minimal experience playing games, completing the levels included in the study. From this, we learned that the tutorial was not sufficient to establish a good baseline of skill or knowledge. Therefore, we implemented so-called “intro levels,” which are levels that every participant played through in an identical order before starting the study. The hope was that this would let the participants grow familiar with the game before they started to rate the levels. The levels used for this were the three first levels from the original Super Mario Bros. These were chosen because they were designed by the original game designers to be introductory.
The reason that establishing a skill baseline before the study is important is that it counteracts maturity, which is a threat to internal validity. If a participant’s baseline of skill changes during the study (i.e., while rating the levels) then the data before and after said change are no longer compatible, therefore it can harm the internal validity of the results. For more discussion on validity, see section 3.3.
3.2.2.3 Participants
Although we had no explicit selection criteria, the selection of participants was not random. Mainly for two reasons, first is the introductory levels discussed above. It is likely that they acted as a filter, filtering out any participants who were not dedicated enough to finish them. Second, we only had access to two main communication channels through which to find participants. The first channel was given to us by Cybercom and would thus skew the available participants to tech-savvy employees of tech corporations. The second channel was given to us by Jönköping University, which skewed the participant pool toward students. With that said, there is no apparent reason that these slight biases should affect the validity of our results. In fact, the bias arising from the intro level likely helps validity by filtering out unserious participants.
In the end, the user study had 45 participants, 31 of whom played through all the levels. There were also 90 other people who started the game but did not give any ratings. This means that these people never got past the intro levels, which reinforces the idea that they acted as a filter. As for the compositions of age and gender among those who did give ratings. The vast majority of the participants were between 19 and 28 (ca 84%). As for gender, most were men (91.1%). See Figure 5 for details.
Figure 5: Pie charts showing player count per age (left) and gender (right). The age groups were automatically created by splitting the total age ranges into 5 equally wide ranges. The left ends of the age ranges are inclusive (denoted by “(“) and the right ends are exclusive (denoted by “]”).
The demographics are quite unbalanced. This could possibly be because of the communication channels used to recruit participants, as well as the possible imbalances that exist in gaming as a hobby.
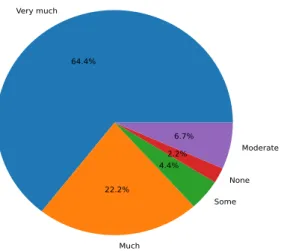
Lastly, the majority (29) of participants reported having “very much” experience. See Figure 6 for more details on the distribution of gaming experience.
Figure 6: Pie chart showing player count per level of gaming experience.
Statistical tests and analytical procedure
The goal of the user study was to determine the correlation between the fitness function used to generate a level and the perceptions of quality reported by the users. To this end, a statistical test was used. Specifically, the ϕk (Baak et al., 2020) correlation coefficient was used (see section 2.5 for an overview of it.) Which was chosen primarily because it is equally applicable to any combination of variable types. This was a necessary property for this study because the independent variable, i.e., which fitness function was used, is categorical and the dependent variables, i.e., ratings of difficulty, enjoyment, and aesthetics, are ordinal with four and five possible values, respectively. Other correlation coefficients can deal with mixed variable types. Still, none have the absolute flexibility that ϕk exhibits and most do not support the particular mix that this study deals with (Baak et al., 2020).
The test was used to determine correlations between the independent variable and each of the dependent variables individually (pairwise); this resulted in three correlation values, each between 0 and 1, for each fitness function. In addition, each correlation is accompanied by a significance level in the form of a Z-score. The results were considered at multiple confidence levels, but p = 0.05 was the primary threshold used in analysis. One might think that the significance level is made somewhat redundant by the correlation value, because higher correlation values can intuitively be interpreted as being more significant than lower ones. However, in fact, strong correlations can be very insignificant, weak correlations can be very significant, and vice versa (Baak et al., 2020). Consequently, the significance measure is vital to the analysis of correlation and one should not in any way conflate correlation and significance.
Importantly, an indication of correlation in this experiment would also indicate causation. In a controlled experiment such as this, if a change in the independent variable (fitness function) coincides with a statistically significant change in one of the dependent variables (perceptions of quality) it is reasonable to infer a causal relationship between said variables. See section 3.3 for discussion on the threats to the validity of this inference (internal validity). With this being said, proving causation requires a very high standard of evidence, and is even more difficult in science that relates to human psychology.
Method and implementation
The Φk metric can also be used together with so-called “outlier significances” to help interpret the “direction” (in this case) of the correlations. Practically, outlier significances report where the abnormal distributions that resulted in the correlation were found. Due to this, one can inspect outlier significances to see the way in which a given correlation affects the data. In our case, they were used to inspect the correlations between fitness functions and the three dimensions of quality. As well as the interactions of various background information.
In addition to the quality assessments, several types of background information were also gathered from the user study participants. These were: Age, Gender, and prior gaming experience. The effect of experience was analysed by repeating the main correlation analysis twice more, once while only including participants who reported having “very much” experience, and once while excluding said participants. This particular split was chosen because there were many more participants who reported having “very much” experience than any other category. Consequently, this was the only split where there was enough data for both groups.
The reason the analysis focused on the effects of experience is that age and gender were found to correlate strongly to gaming experience (with Φk coefficients of 0.63 and 0.76, respectively). This made it likely that gaming experience masked (made redundant) age and gender to a significant extent and can thus serve as an aggregate of both for this study’s purposes. In addition, there is no reason to assume that gender or age have any intrinsic effect on the ratings that participants give.
3.3 Validity
Validity can be generally considered in two aspects, internal and external. Internal validity refers to whether the study is measuring what it aims to measure, or in other words, can you reasonably draw causal links between your treatment and the response in an experiment. A common example of a threat to internal validity is that of history, where external factors (other than the treatment variables) change the response by virtue of the passage of time. This is similar to the idea of confounding variables in general, where a third, unseen variable changes the dependent variable without the knowledge of the researchers.
Before discussing threats to internal validity present for this study it is helpful to define what the dependent and control (independent) variables are. We consider the fitness function used and by extension, the metric used in that function to be the control variable of the experiment. Whereas the players’ ratings of the three dimensions of quality are considered to be dependent variables. With this in mind, one might argue that maturity may be an issue, as when people play more levels, they become more skilled and therefore rate the difficulty of the levels differently to what they did at the start of the study. One counterargument is that the amount of skill growth possible in the short time period over which the study spanned is likely very limited. It takes much practice to rise above the skill floor in a Mario game. With that said the test discussed in section 3.2.2 indicated that maturity may still be a problem when it comes participants that have minimal experience in gaming. The reason for this may be that these players start underneath the skill floor at the start of the study, and then rise above it as they play. This causes a distortion in ratings for the early levels. because of this, three measures were taken to mitigate this maturity distortion; 1) the order in which players played the levels was randomized, so that these distortions become more evenly distributed. 2) the text-based tutorial that was included in the distributed Mario game, which helps to bring players above the skill floor. Lastly, 3) the introductory levels discussed in section 3.2.2 serves to mitigate maturity by further allowing most of the participants to rise above the skill floor before the real study starts.
Additionally, the idea of participants not answering seriously needs to be acknowledged. This is an issue in general with decentralized user studies. When a participant is anonymous there is less pressure on them to participate in good faith. On the other hand, it is easier to gather large amounts of data in this type of setting. This issue is also counteracted by the intro levels by filtering out participants who are not dedicated (or serious) enough to complete them. This does not mitigate the problem entirely and it still needs to be considered when evaluating the results of this study.
As for external validity, it refers to whether the results from a study can be generalizable to the population in question. Which in our case would be players of Super Mario Bros. The only real threats to this relevant here are sample size and selection bias. Selection bias has already been discussed and has been mitigated to the best of our ability. It can be difficult however, to draw a definitive line in the sand regarding sample size. However, it is our belief that 45 is sufficient to be generalisable to the population. The correlation metric used also provides a measure of statistical significance which gives a further indication of our ability to generalize our results.
Results and analysis
4 Results and analysis
4.1 Quality correlation
This analysis seeks to answer the core question of the study. It was done by using Φk to calculate correlations between the fitness function used and the three dimensions of quality: enjoyment, difficulty and aesthetics. The analysis shows that fitness function correlates moderately with difficulty, weakly with enjoyment, and not at all with aesthetics, having Φk coefficients of 0.40, 0.16, and 0.00, respectively. They had varying statistical significances (z-score) of 13.96, 4.38, and -0.01, respectively. This means that the aesthetics correlation is not statistically significant.
As mentioned, analysis will be performed using outlier significances, which are a measure of how unexpected the concentrations found for certain variable pairs are, each cell in an outlier significance matrix contain z-scores. This study uses 1.64 as its significance threshold, which equals a p-score of 0.05. A look at the outlier significances between fitness function and difficulty shown in Figure 7 reveals that levels that were evolved using the “number of enemies” function tended to be rated higher in difficulty. With the categories “moderate”, “high”, and “very high” being more prominent within this category. Additionally, levels evolved using the enemy sparsity and enemy σx functions tended to be rated as “very low” difficulty. The power
up mean x function shows no significant tendency for difficulty.
Figure 7: Outlier significances for correlation between fitness function and difficulty. The cells contain z-scores for that combination. The cells show a z-score for a certain variable pair. The z-score can indicate how unexpected the concentration of data points that have certain value combinations are. I.e. the high z-score between number of enemies and High difficulty means that there is definitely an unexpected number of ratings matching those values. Meaning that number of enemies levels are more likely to receive high difficulty ratings.
As for the outlier significances between fitness function and enjoyment, there are only two tendencies. The levels evolved with the number of enemies function showed a tendency towards “high enjoyment”, whereas levels evolved with the enemy σx functiontended toward “Low”
ratings. Bear in mind that these tendencies are quite weak, only having a correlation coefficient of 0.16. See Fel! Hittar inte referenskälla. for more details.
Figure 8: Outlier significances for correlation between enjoyment and fitness function. The cells contain z-scores for that combination. The cells show a z-score for a certain variable pair. The z-score can indicate how unexpected the concentration of data points that have certain value combinations are.
Finally, the outlier significances between fitness function and aesthetics showed no tendencies, as would be expected given the correlation value being 0. See Figure 9.
Figure 9: Outlier significances for correlation between aesthetics and fitness function. The cells contain z-scores for that combination. The cells show a z-score for a certain variable pair. The z-score can indicate how unexpected the concentration of data points that have certain value combinations are.
4.2 Effect of background
This section covers the results of the analysis of the effect of gaming experience on the quality correlation reported above. This analysis was done by splitting the data into two groups. One contained answers from everyone who reported having “Very much” experience, the other contained answers from the ones who did not. This split was then used to run two correlation analyses like the one done for the core question. The question is whether the main analysis changes significantly based on which group is used.
Results and analysis
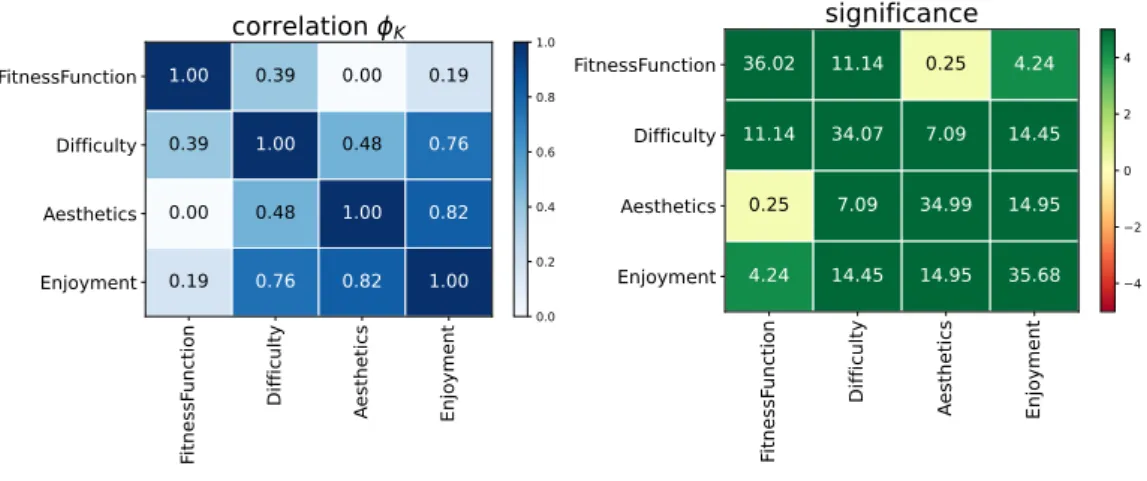
Starting with the first group (experienced participants), nothing changes much from the main analysis. See Figure 10 for the significance and correlation matrices for this group.
Figure 10: Correlation and significance matrices for experienced group.
As for the outlier significances for this group, they did not change much from the main analysis either. See Figure 11Fel! Hittar inte referenskälla. for the matrices containing all
the outlier significances.
Figure 11: High experience group’s outlier significances for correlations between fitness function, difficulty, aesthetics, and enjoyment. The cells show a z-score for a certain variable pair. The z-score can
As for the group with the lower experience, Figure 12 shows that some correlations change significantly. The difficulty correlation grows slightly stronger, whereas the enjoyment correlation disappears. The significances also change. The only noteworthy significance change being the enjoyment to fitness significance diminishing to a point of being statistically insignificant. This means that the correlation between enjoyment and fitness function is no longer statistically significant.
The outlier significances, as shown in Figure 13, changed somewhat as well. The tendency for difficulty to be rated “very high” when using the number of enemies function disappeared. In addition, the tendency for “very low” difficulty ratings when using the enemy σx fitness
function shifted to “low” difficulty ratings. Finally, as one would expect from the correlation and significance values, the tendencies for enjoyment ratings all disappeared.
Results and analysis
Figure 13: Lower experience group's outlier significances for correlations between fitness function, difficulty, aesthetics, and enjoyment. The cells show a z-score for a certain variable pair. The z-score can indicate how unexpected the concentration of data points that have certain value combinations are.
5 Discussion
5.1 Experience imbalance
This section tries to discuss where the imbalance in the reported amount of gaming experience could come from. These considerations could help future researchers to crate more balanced data in the future.
The experience imbalance is likely, in part, due to the other imbalances, as correlations with gender and age sh0w. However, there are some other possible reasons for this phenomenon. Firstly, it is possible that the Kruger effect influenced peoples’ answers. The Dunning-Kruger effect (Dunning-Kruger & Dunning, 1999) is a cognitive bias present in many people where they tend to overestimate their own competence in a subject if they are incompetent and underestimate it if they are not. However, it is impossible to determine what the net-effect on distribution this bias would have. Consequently, it is hard to cite it with certainty as a reason for the current imbalance. It is a definite possibility, though. Secondly, the argument for the prevalence of men also applies here, i.e., that people who are more experienced with gaming, thus likely having a greater interest in it, are more likely to participate in a study concerning it.
5.2 Quality correlation
The results were not unexpected; in particular, the tendencies found between the number of enemies function and difficulty ratings can be intuitively understood quite easily. It also aligns well with the findings reported in Summerville et al. (2017), which also showed a correlation between the number of enemies and difficulty, also in a positive direction. Admittedly, the correlation we found is weaker. However, since we use a different correlation metric, it is difficult to compare the values exactly.
However, what is more difficult to understand is the tendencies toward low difficulty ratings found for levels evolved with the enemy σx and enemy sparsity functions. This does concur with
Summerville et al. (2017), who found that their LASSO model weighted those metrics negatively. Nevertheless, they also found that when the metrics were analysed individually, they had a positive correlation with difficulty. They argued that this discrepancy arose because the metrics acted as a proxy for the number of enemies metric. From our results, it is relatively straightforward that they did not do so in our experiment. We believe this is because of the evolution process. Summerville et al. (2017) only measured their metrics on pre-existing levels, whereas we specifically evolved our levels to maximize metrics. Because there is nothing about enemy sparsity or enemy σx that explicitly requires a high number of enemies, the evolution
process has no reason to produce levels with more than two enemies (one enemy will result in a 0 in both metrics). It seems then that our experiment indicates that the reasoning Summerville et al. (2017) provided for the sign (negative vs positive) discrepancy is correct. Understanding this, it is quite easy to see how players would perceive levels with a low number of enemies that are maximally spread out as easier.
The power up mean x function does not affect perceived difficulty in any way, according to our results. This is not unexpected, as Summerville et al. (2017) did not find any effects either. Similarly to the enemy spread functions, nothing about this function explicitly encourages a high number of power ups. With this in mind, there is no reason to expect that this would affect difficulty.
Discussion
The correlation found for enjoyment and fitness function was rather weak and came from two tendencies. Both of which were not unexpected. First, there was a tendency for the levels evolved with the enemy σx function to be rated lower on enjoyment. This likely comes from the
fact that these levels also tended to be rated very low on difficulty and the fact that if a game is too easy, it is generally not fun. Second, there was a tendency for levels evolved with the number of enemies function to be rated higher on enjoyment. This is likely because these levels tended to be rated higher on difficulty and the fact that levels with some amounts of difficulty are generally more fun (although too much difficulty can reduce fun and instead be frustrating). This tendency concurs with Summerville et al. (2017), who found a positive correlation between enjoyment and number of enemies.
The non-existent aesthetics correlation was not entirely unexpected, although its magnitude (or lack thereof) was somewhat unexpected. The findings do not concur with Summerville et al. (2017), who found some correlations with the metrics we selected. With that said, the correlations they found were relatively weak. In addition, it is not clear what graphics they used or how exactly they defined some of their metrics graphically speaking. Therefore, it may be not possible to compare their results to ours. Our results were not entirely unexpected because the levels did not change much graphically due to the fitness functions. The backgrounds and the textures never changed, for example. Therefore, we did not expect to see much of a dependence here.
5.3 Effect of background
Interestingly, it seems that the correlation between difficulty is significant and moderately strong regardless of the group used for analysis. Since this correlation was also the strongest in the main analysis, this was not unexpected. As for the other dimensions of quality, aesthetics remained non-correlative, and the enjoyment correlation disappeared when the group with lower gaming experience was used for analysis. This indicates that the only correlation that holds regardless of background is the difficulty correlation. The correlation also comes from roughly the same tendencies (according to the outlier significances) regardless of group.
5.4 Some methodological concerns
It is worth mentioning that the infrastructure used for the study was not completely secure. Although, some security measures were implemented, such as storing IP addresses and placing unique constraints on them, and storing timestamps. It would still be perfectly possible to inject false data into the database. It would require repeatedly spoofing your IP address and timing your injections of data well, so that it looks as they were added naturally. However, it was deemed that both the factors of non-provocation (there is no reasonable motivation for attacking this study) and effort required would make it exceedingly unlikely that any hostile action was taken. In the end, it seems as if no such attack was performed because of the extent to which our data concurs with the results reported by Summerville et al. (2017). We did not make the infrastructure more secure because such security necessarily comes at the cost of reduced accessibility.
The online nature of the study also bears discussing. The fundamental trade-off that we are forced to engage in when deciding on the degree of centralization in the study is that of accessibility versus reliability. We decided on a very decentralized design, and as such, we have less of a guarantee as to the seriousness of the participants’ answers. In a more centralized design, such as in-situ designs, the researchers could supervise participants more closely. With that said, it is likely that the three introduction levels that were used to mitigate the effects of maturity bias also helped filter out unserious participants. It does seem unlikely that participants who are not dedicated to helping the study would bother with playing through said levels, both because they are not easy, and because they are longer than the generated levels. In the end, it is difficult to say whether the decentralization of the study was a bad or good idea. It does mean that any claims of causality would be dubious though.