Master Thesis
Spring 2020
International Marketing
Business Administration
Factors Affecting Consumers’ Purchase Intention
towards Smartphone of The Chinese Brands
Authors Yi Wei Jiaying Zhu
Supervisor Ulf R Andersson
Abstract
Date: 2020/06/09
Level: Master Thesis in Business Administration, 15 credits.
Institution: School of Business, Society and Engineering, Mälardalen University.
Authors: Yi Wei (85/01/01) & Jiaying Zhu (95/10/27)
Title: Factors Affecting Consumers’ Purchase Intention towards The Smartphone of The Chinese Brands
Tutor: Professor Ulf R Andersson
Keywords: Country-of-Origin, Perceived Brand Quality, Chinese Brands, Subjective Knowledge, Price Sensitivity
Research
Question: How do the factors of perceived brand quality on COO cues, pricesensitivity, and subjective knowledge of product influence consumers’ purchase intention towards the smartphones of the Chinese brands?
Purpose: This study aims to investigate factors related to the purchase intention towards smartphone of the Chinese brands in the developed market and provide managerial suggestions for Chinese smartphone firms.
Method: This empirical study is conducted by the quantitative research method with an online survey for data gathering.
Conclusion: It concludes that the purchase intention of western consumers towards Chinese smartphones is positively influenced by two factors: perceived brand quality on COO cues and subjective knowledge of product. The price sensitivity has no impact on purchase intention. Therefore, the lower price strategy of smartphone should not be adopted by Chinese firms. The Focus should be on brand management to convey the superior quality performance of smartphone of Chinese brands.
Acknowledgement
This paper is the Master thesis written at the end of the study in International Marketing, Master of Science program in Business Administration, Mälardalen University.
We would like to express gratitude to our supervisor Professor Ulf R Andersson, your guidance and rigorous academic attitude consistently allow us heading to the right path.
We also would like to thank all the members in the seminar group for providing insightful comments and thought. Besides, we would like to thank Professor Cecilia Lindh with the help of statistical analysis problems. Madi, thanks for your proofreading of the survey questions. To all the respondents, we cannot finish the study without your
participation.
Last but not least, we would extend our special thanks to friends and families who have been encouraging and supporting us.
Contents
Chapter 1 Introduction...1 1.1 Background...1 1.2 Research Area...3 1.3 Research Gap... 4 1.4 Research Purpose...5 1.5 Research Question... 6Chapter 2 Theoretical Background and Framework...7
2.1 Literature Review and Hypotheses Development... 7
2.1.1 Purchase Intention...7
2.1.2 Perceived Brand Quality on COO Cues and Purchase Intention...10
2.1.3 Price Sensitivity and Purchase Intention... 12
2.1.4 Subjective Knowledge of Product and Purchase Intention...14
2.2 Conceptual model... 17 Chapter 3 Method... 20 3.1 Research Approach...20 3.2 Survey Design...20 3.3 Operationalization...21 3.4 Data Collection... 22 3.5 Data Analysis...23
3.6 Validity & Reliability... 24
3.6.1 Validity... 24
3.6.2 Reliability...24
3.7 Method Limitation... 25
Chapter 4 Result Analysis...26
4.1 Demographic Analysis...26
4.2 Correlation Analysis... 28
4.3 Regression Test...29
4.3.1 Results with Control Variables...24
4.3.2 Age Groups...241
4.3.3 Gender Groups...242
4.3.4 Educational Level Groups... 24
Chapter 5 Discussion... 35
Chapter 6 Conclusion...38
6.2 Limitation...39 References...40 Appendix A- The operationalization of survey... 50
List of Figures
Figure 1: Structure of framework... 18
Figure 2: Conceptual model...18
Figure 3: Nations’ perception towards hypotheses variables... 28
List of Tables
Table 1: Operationalization... 22Table 2: Cronbach’s alpha test of presumed factors...25
Table 3: Mean of demographic variables towards hypotheses variables...26
Table 4: Correlations between independent and dependent variables...28
Table 5: Correlation matrix between presumed factors...29
Table 6: Regression results of hypotheses...30
Table 7: Age groups...31
Table 8: Gender groups...32
Chapter 1 Introduction
1.1 Background
Globalization proliferates international trading than ever before. When consumers constantly face the increasing alternatives of products and brands from all over the world, the Country-of-Origin (COO) can be used as an influential cue in product evaluation (Duong, 2016). The Country-of-Origin has traditionally been referred to consumers’ general perceptions of the products manufactured in a specific foreign country (Leonidou, Palihawadana, & Talias, 2007). The COO affects consumers’ product evaluation when they are either unwilling (low involvement) or unable (lacking the expertise to analyze information) to evaluate a product on its true performance. Instead, the COO acts as the informational shortcut or “cue” in their evaluation of the product (Kumar & Steenkamp, 2013; Leonidou et al., 2007).
The informational shortcut of COO comprises two meanings in product evaluation for consumers: 1) The evaluation towards the product quality can be based on the consumers’ general perception of the overall manufacturing competence of the country; 2) when a certain country has accumulated the manufacturing capability in a certain product category, it will eventually turn the capability into the dominant advantage. Consequently, consumers subconsciously associate the product category to the certain country (Barney & Zhang, 2008; Kumar & Steenkamp, 2013). For example, Japanese electronics were perceived initially as low quality in the international market, now it has established a favorable brand association in this product category (Barney & Zhang, 2008). When consumers face various alternatives of electronics, the belief of “Japanese brand of electronics equals good quality” may simplify information processing then adopted directly for the purchase decision. This kind of general perception is a pivotal reference for consumers if they lack sufficient product knowledge to assess the detailed product attributes (Walters & Long, 2012).
However, multinational production and global branding blur the COO issue as it only refers to the "Made-In" effect (Usunier, 2011). Scholars decompose the construct of COO into the country of design (COD), country of manufacture (COM), country of assembly
(COA) to empirically investigate the impacts on consumers ’ evaluation of product quality (Insch & McBride, 2004; Ha‐Brookshire & Yoon, 2012). In real life, it is less likely that consumers trace the detailed information of COD, COM, or COA as references for the purchase decision (Magnusson, Westjohn, & Zadravkovic, 2011). Additionally, the manufacture of high-tech products involves intensive global cooperation which makes it is impossible to infer the original image of a hybrid product by using a single one or several decomposed COO cues. There is the need to find the authentic surrogate of COO in the product evaluation for consumers (Magnusson et al., 2011; Usunier, 2011).
Meanwhile, according to Statista (2018), the smartphone of Chinese brands account for 32.4 % share in the European market (excluding the East European market). Huawei is the first company to offer fifth-generation (5G) wireless networks and products to global customers (Ma, Barton, & Lee, 2017). It seems that Chinese firms have already proven their capability to compete with global rivals in smartphones. However, some scholars argue the competitive advantage of Chinese firms in the international market is partly attributed to the "price leadership strategy" which secures the products at a low price to get sell volume (Brouthers & Xu 2002). The long-entrenched impression of cheap price and quality concerns is the general perception of the products coming from China (Duong, 2016). For consumers in the developed market, the prejudices against Chinese products are still driven by stereotypes and skepticism rather than by usage experiences (Bell, 2008).
It seems the prevalent perception of products "Made-in-China" cannot explain the excellent performance of the Chinese brand of smartphones in the developed market. So, it is urgent to understand consumers’ actual perception towards the Chinese brand of smartphones due to the increasing Chinese brand presence in the international market (Duong, 2016). Apart from that, the reasons why it is important to scrutinize the perceptual and non-perceptual factors that affects consumers' purchase intention towards Chinese brand of smartphones in the developed market as following: 1) Consumers' perception is a useful indicator for measuring the effectiveness of brand management (Duong, 2016); 2) The perceptual factor and non-perceptual factors contribute together in explaining consumers’ purchase intention and the purchase intention is a strong
indication to the real purchase (Walters & Long, 2012); 3) As Beebe, Hew, Feng and Shi (2006) suggest the developed market is essential for Chinese firms because it is not only for new growth but the recognition of the global brand names.
The next section presents the discussion of the fundamental theory and model which can be used to explain how consumers process the perceptual and non-perceptual information in a phycological way. And based on the theory and model, introducing the factors that affect consumers' purchase intention towards the smartphone of Chinese brands.
1.2 Research Area
It is generally regarded that consumers’ purchase intentions can be influenced by marketing efforts (Yoo, Donthu, & Lee, 2000). There are studies about how consumers respond to the marketing mix explained by the phycological model, namely, the Elaboration Likelihood Model of Persuasion (ELM) (Lee & Lee, 2009; Walters & Long, 2012; Yoo et al., 2000). It indicates how the consumers utilize the information from the marketing mix is determined by their knowledge level. The more product knowledge they possess, the less likely they will evaluate a product based on the non-product attributes such as price, perceptual impressions such as COO (Walters & Long, 2012). The cue utilization theory further explains the difference between product attributes and non-product attributes (Veale & Quester, 2009). The non-product attributes can be interpreted as intrinsic cues which require the cognitive effects of consumers to understand it (Walters & Long, 2012). The non-product attributes can be interpreted as extrinsic cues referring to price, COO, and package, etc. which can be managed or manipulated by marketers (Walters & Long, 2012; Zeithaml, 1988). It is also easier to be understood and utilized by consumers in a real purchase.
As aforementioned, the traditional COO of “Made-In” cannot acutely describe the authentic identity of smartphone of Chinese brands. Usunier (2011) suggests "brand work better than manufacturing origins " in investigating the origin effect on consumers' purchase intention. Therefore, the discussion expands to brand equity which can be seen as the outcome of marketing mix effects (Yoo et al., 2000). Firstly, a brand name is a salient cue which linguistically implies the origin of the product (Usunier, 2011);
secondly, the brand name is an asset that can be manipulated by marketers to activate favorable origin association (Magnusson et al., 2011; Usunier, 2011). For example, in 1992 the Chinese brand of refrigerator Qingdao Refrigerator Company chose to switch its’ name into Haier which is a German-sounding name to utilize the high-tech sophisticated country image of Germany to gain consumers favorable brand recognition (Zhuang, Wang, Zhou, & Zhou, 2008). The perceived brand quality is considered as the primary or core in the mutual enhanced or detracted beneficial relationship between brand equity and the COO effect, (Netemeyer et al., 2004; Pappu & Quester, 2010). Because the perceived brand quality directly contributes to consumers satisfaction which leads to the purchase intention (Kim & Chao, 2018).
Another prominent COO image of Chinese products is cheap (Bell, 2008; Duong, 2016; Kumar & Steenkamp, 2013). This price image on COO cues can easily be adopted by consumers as the internal reference to evaluate whether the actual price of a Chinese brand smartphone is worthy. The price sensitivity indicates the level of consumers’ concern about the ratio between the cost and return (Glynn & Woodside, 2009). If the consumers are highly price-sensitive, the more likely they will choose the cheaper product. The price sensitivity directly determines their willingness of purchasing.
Apart from the extrinsic COO cues, the intrinsic cue of a smartphone are product attributes. Because the smartphone is characterized as a high-tech product that requires consumers possess more complicated knowledge to understand and evaluate the product attributes such as processor, camera, display panel, battery, and memory/storage capacity (Yeh, Wang & Yieh, 2016). This requirement highly related to consumer’ product knowledge level, in other words, the familiarity and expertise of the product contributes to consumers’ knowledge and further helps them to assess the true performance of the product (Phillip, Asperin & Wolfe, 2013). At the same time, subjective knowledge is regarded as the self-assessment of whether consumers are competent to evaluate the product (Park & Lessig, 1981). Subjective knowledge is involved in this study as the intrinsic cue to investigate the cognitive evaluation of the product, demonstrating the different information process route.
There are great numbers of studies about the COO effect and purchase intention in the international market research community (Pharr, 2005). As aforementioned, most of the studies agree that COO is viewed as extrinsic information to facilitate product evaluation. Another most referred extrinsic cue is the price. There are studies about consumers’ willingness to pay the price premium for the positive COO (Anselmsson, Bondesson, & Johansson, 2014; Koschate-Fischer, Diamantopoulos, & Oldenkotte, 2012) and the study about negative COO image of the product results in the lower perceived price (Ha‐Brookshire & Yoon, 2012). However, there is a research gap about how consumers respond to the price of the Chinese brand, especially for the product as a smartphone. The extant study (Kim & Chao, 2018) about consumers’ perceived brand quality of Chinese and South Korean smartphone only focuses on the one facet of brand equity and the respondents are from developing market of Columbian. Haba, Hassan and Dastane (2017) investigate the economic value as one indirect variable impacts consumers’ purchase intention towards the smartphone in Malaysia. It involves one Chinese brand Huawei but does not describe how the economic value of different brands affects purchase intention. Moreover, the studies about the interplay of intrinsic cue of knowledge, COO cues, and purchase intention show the different conclusions (Bruwer & Buller, 2012; Cilingir & Basfirinci, 2014; Lee & Lee, 2009; Phau & Suntornnond, 2006).Some researchers find the knowledge acts as medicating role between COO and purchase intention (Bruwer & Buller, 2012; Cilingir & Basfirinci, 2014). Simultaneously, some researchers report the knowledge has direct effect on purchase intention (Lin & Chen, 2006; Phillips et al., 2013; Xin & Seo, 2019). The contradiction needs to be further investigated.
The present study comprises three implications: first, providing a supplement to the limited empirical study of the Chinese brand under the context of COO and brand equity research; second, responding as scholars suggested (Leonidou et al., 2007; Magnusson et al., 2011; Usunier,2011) COO research should consider more than one variables to explain consumers purchase behavior; third, enriching the study of ELM model and cue utilization theory.
Consumers’ purchase intention is the primary inputs which used by marketing managers to forecast future sales and to determine the marketing strategy (Morwitz,2012). Companies’ efforts of improving the product attributes such as function or manipulating the non-product attributes such as brand name, price, country of origin (Kim & Chao, 2018; Veale & Quester, 2009) should ultimately increase the value of the brand which leads to the brand loyalty and sells growth (Keller, 2013). At the end of the study, it answers the common concerns from Chinese companies in the journey of internationalization. Should they increase the product attribute communication or continue the price and quality ration pricing strategy or more effective marketing approach of emphasizing the brand quality?
1.5 Research Question
Based on the discussion above, this study aims to answer the question:
“How do the factors of perceived brand quality on COO cues, price sensitivity, and subjective knowledge of product influence consumers’ purchase intention towards the smartphone of the Chinese brands?”
Chapter 2 Theoretical Background and Framework
2.1 Literature Review and Hypotheses Development
2.1.1 Purchase Intention
Purchase intention can be described as “the attitude of the consumer that shows an aim to acquire a product” (Roozy, Arastoo, & Vazifehdust, 2014). It has been widely acknowledged that purchase intention predicts the actual purchase (Grewal, Monroe, & Krishnan, 1998). The interaction of customers’ needs, attitudes, and perceptions towards the product or brand indicate the purchase intention (O'Cass & Lim, 2002). Engel, Blackwell and Miniard (1995) study the stages of consumers' purchase behavior, pointing out the evaluation of alternatives is the antecedence of the purchase decision. Similarly, Consumer Decision Process Model describes the consumer decision involves five key steps as recognition, search, evaluation, purchase, and post-purchase evaluation (Blackwell et al., 2001). It is also regarded that evaluation is the precursor of the real purchase. To some extent, the evaluation and purchase intention towards a product interchangeably happens before the real purchase (Hansen, 2005).
2.1.1.1 Perspectives about Purchase Intention
Because of the complicity of purchase decision making, researchers have provided various perspectives to explain how the evaluation forms. Hansen (2005) reviews the past studies about the factors driving the purchase intention, classifying them into three mainstreams. The first perspective is ‘value-driven’(Levy, 1999; Zeithaml, 1988) which refers to consumer’s perceived value which can be seen as an expression of ‘an overall assessment of the utility of a product (or service) based on perceptions of what is received and what is given’. The value is generated when consumers perceive the receiving over giving then leads to purchase intention. This ‘value-driven’ perspective has been questioned because the asymmetrical information cannot lead to a right judgment (Hansen, 2005), in other words, consumers lack enough information as a reference to assess whether this “trade-off” is worthy which turns into high uncertainty and risk.
To cope with uncertainty, the second perspective which refers to the “cognitive information process” is developed. It implies how consumers process information to engage in extensive evaluations of attributes and products (Hansen, 2005). In this perspective, it posits that consumers are either in low or high involvement when they are in purchase evaluation. Low-involved consumers who lack the competence or willingness to process complicated information using simple decision rules to arrive at attitudinal judgments. In contrast, high-involved consumers could utilize more complicated information (Hansen ,2005). This discussion frequently cites the ‘cue utilization theory’ (Richardson, Dick, & Jain, 1994) which emphasis that consumers may use one or more indicators (i.e., price, country of origin, brand name and so on) to infer the quality or the overall performance of a product.
The third perspective is that consumers’ emotional responses to the product or the brand should be included in the explanation of consumer decision making (Hansen, 2005). 2.1.1.2 Elaboration Likelihood Model of Persuasion (ELM)
The discussion above explains the driving force of purchase evaluation. The evaluation process is explained by the Elaboration Likelihood Model of Persuasion (ELM) (Petty & Cacioppo, 1986). According to ELM, individuals react differently to the persuasive information and the processing occurs through either a central or a peripheral route. For consumers who lack experience and knowledge to assess the information, peripheral route processing occurs. Under this route, they much rely on simple inferences such as perceptional cognition or other conspicuous information to evaluate the product. (Walters & Long, 2012). Under the central route, consumers tend to utilize their own experience and knowledge to scrutinize the information (Walters & Long, 2012). In other words, when consumers are confident with their knowledge of the product, they rely on their intrinsic belief to make the decision. There is no strict boundary between the central route and the peripheral route utilization for a consumer because of the contextual and individual factors (Petty & Cacioppo, 1986).
2.1.1.3 The Cue Utilization Theory
A cue is defined as a characteristic or signal that can be encoded and interpreted by an individual and used as a stimulus of an object (Richardson et al., 1994). A product or a
brand consists of many cues that serve as a surrogate indicator of quality (Richardson et al., 1994). These cues can be classified into extrinsic cues and intrinsic cues. Extrinsic information cues are product-related but not the part of the physical product. It includes the attributes such as brand name, price, country of origin (Veale & Quester, 2009). Intrinsic cues are the physical composition of the product, which are often referred to product-attribute cues (Veale & Quester, 2009). For example, intrinsic information cues for a smartphone may include screen size, thickness, weight and exterior design (Chen, Liu, & Ann, 2018; Okazaki & Mendez, 2013).
Cue processing is affected by consumer knowledge and product/purchase involvement (Veale & Quester, 2009; Walters & Long, 2012). Consumer knowledge is an important factor in processing information (cues). For a high-tech product, it requires consumers to spend a longer time and extra efforts to process the product attributes information to get the right evaluation (Souiden, Pons, & Mayrand, 2011). The uncertainty of high-tech products is explained by Higgins and Shanklin (1992) using the term “technological fear”. The level of knowledge indicates the competence of understanding the technology and cope with the “fear”.
It is generally regarded that extrinsic cues can be manipulated, which represents the outcome of a company’s marketing efforts. For example, the price of a product can be decided; the name can be changed; the country of origin information can be highlighted or concealed (Veale & Quester, 2009; Walters & Long, 2012).
When consumers exposure to the alternatives of foreign brands, consumers’ knowledge of products indicates the level of their objective understanding and usage experience about a product without perceptional judgment (Lee & Lee, 2009). The COO acts as a signal of product quality perceived by consumers, which affects the likelihood of purchase (Kim & Chao, 2018). The more knowledge of the product they have, the more they respond differently to a foreign brand comparing with consumers with less product knowledge.
2.1.1.4 COO Cues
Country-of-origin is a multi-dimensional concept, although the pertinent constructs of country image, product country image are interchangeably used to scrutinize the COO
effect, there is no agreed accurate definition of Country-of-Origin (Leonidou et al., 2007; Usunier, 2011). Consumers’ perception of a country can be partially formed through prior experience with a product from that country (Pappu, Quester, & Cooksey, 2005). The similar concepts emerge as Product-country-image (PCI), Product Category Image (PCATI) capturing the image of that country’s products in a particular category (Diamantopoulos, Schlegelmilch, & Palihawadana, 2011). In this study does not differentiate those constructs rigorously, adopting the Roth and Romeo (1992) define COO perception as “Overall perception consumers form of products from a particular country, based on their prior perceptions of the country’s the production and marketing strengths and weaknesses”.
2.1.2 Perceived Brand Quality on COO Cues and Purchase Intention 2.1.2.1 The Perceived Quality
The perceived quality is the overall evaluation and satisfaction about the quality of products or services compared with the competitors (Keller, 2013). The perceived quality is consumers’ perceptual assessment of a product; therefore, it is regarded that it is hard to be fairly measured (Zeithaml, 1988). Zeithaml (1988) suggests perceived quality is not about the specific product attributes but a high level of abstraction or resemble attitude. Gotlieb, Grewal and Brown (1994) imply the consumers’ satisfaction increases the potential purchase intention while perceived quality is the precursor of satisfaction. The perceived quality is an appraisal of product which leads to consumers' emotional responds and further leads to the purchase intention (Gotlieb et al., 1994; Tsiotsou, 2006).
2.1.2.2 The Perceived Brand Quality
The earlier study (Gotlieb et al., 1994; Zeithaml, 1988) did not rigorously differentiate the perceived quality of product and the perceived quality of brand. According to Keller (2013), the difference between the product and the brand is that the latter presenting the symbolic, emotional, and intangible of “added value” to consumers. Brand equity “denotes the added value endowed by the brand to the product” (Christodoulides & Chernatony, 2010). Consumer-based brand equity (CBBE) provides a perspective to cognitive psychology in investigating consumers’ respond to the “added value” cultivated
by marketing mix effects (Christodoulides & Chernatony, 2010). Hence, the perceived quality has been explicitly delimited as perceived brand quality as one dimension of CBBE to discuss the interaction with other dimensions of brand awareness (Pappu et al., 2005; Yoo & Donthu, 2000), brand image (Diamantopoulos et al., 2011), brand loyalty (Pool, Asian, Abareshi, & Mahyari, 2018; Yoo & Donthu, 2000), perceived value for the cost (Netemeyer et al., 2004). Roth et al. (2008) point out the CCBE focus on consumers' perception of a brand, the perceived quality can be understood as the antecedent while the consequence of perception is actual consumer behavior such as the brand loyalty, willingness to pay a price premium.
Although there are consistent arguments about the dimensions of consumer-based equity, the perceived brand quality is regarded as the primary or core of this construct. (Aaker, 1996; Netemeyer et al., 2004). Additionally, perceived brand quality may act as the surrogate for other elements of CBBE (i.e., perceived value for the cost) and it is applicable across product classes (Keller, 2013; Netemeyer et al., 2004). Yoo et al. (2000) suggest the brand value is facilitated by the positive perceived quality which leads to the consumers’ preference and purchase intention. Perceived brand quality has been associated with the willingness to pay a price premium, brand purchase intention, and brand choice (Netemeyer et al., 2004).
2.1.2.3 Perceived Brand Quality on COO Cues
According to Kotler and Amstrong (2010), a brand can be defined as a name to identify the goods and service from those competitors. Thakor and Lavack (2003) argue the brand name as the sole signal of brand origin perception could not reflect the actual effect of brand origin association. The perceived location of corporate ownership should be considered when assessing the brand origin effect. In their study (2003), it confirms that the perception of the “nationality” of a brand significantly impacts the perception of the brand quality, which positively effects the purchase intention.
The reasons which lead to the different perception of the quality of a brand from certain countries has been discussed from the perspective of the country of origin, more specifically, country image effect (Pappu & Quester, 2010), country product image effect (Kim & Chao, 2018; Wu & Fu, 2007), and country equity (Roth et al., 2008; Queiroz &
Giraldi, 2015). Pappu and Quester (2010) imply that the perceived brand quality has been linked with county equity to highlight the significance of the mutual impact. Wu and Fu (2007) find that country of origin has significant impacts on brand quality evaluation and this evaluation influences purchase intention more prominently. Kim and Chao (2018) compare the country image effect to the perceived brand quality of two smartphone brands Samsung and Huawei which come from South Korea and China respectively, reporting that the perceived brand quality has a great influence on consumers’ brand loyalty.
There are different arguments about the drivers of purchase intention of a foreign brand product such as the perceived value (Hui & Zhou, 2002), the brand loyalty (Kim & Chao, 2018; Roth et al., 2008). However, globalization mitigates brand loyalty towards the brand from a specific country, and as aforementioned, the perceived brand quality can act as a surrogate of perceived value. When consumers exposure to the alternatives of smartphone brands from different countries, the image of the perceived brand quality is activated then adopted by consumers as reference for the purchase. The higher they perceive brand quality, the higher possibility they will consider the smartphone of Chinese brands as purchase alternatives. Based on the discussion above, the first hypothesis is phased as:
H1: Perceived brand quality on COO cues has a positive effect on consumers’ purchase intention towards smartphone of the Chinese brands
2.1.3 Price Sensitivity and Purchase Intention
Price is the amount of money that customers exchange for products or services (Kotler & Armstrong, 2010). It plays two roles in consumers’ assessment of a product. The one acts as the measurement of sacrifice referring the cost of money that consumers need to spend; the another one acts as extrinsic informational cue adopted by consumers to infer the quality or value of the product (Völckner, 2008). The evaluation occurs by comparing the actual price and the internal reference price.
Internal price refers to consumers’ internal standard of the price which gains from experience or knowledge (Kalyanaram & Winer, 1995). It is stored in the memory as a stimulus to compare with the new stimuli-the actual price (Kumar, Hurley, Karande, & Reinartz, 1998). The perceived price used by consumers as the internal price reference to assess whether the actual price of the product is “fair”, “right” or “deserved” (Bolton & Lemon, 1999).
Various informational cues composed the internal price reference for consumers. COO is one of the references. (Hui & Zhou, 2002; Veale & Quester, 2009). There are empirical studies that have confirmed consumers’ willingness to pay a higher price of the product because of the favorable country image (Anselmsson et al., 2014; Koschate-Fischer et al., 2012). Ha-Brookshire and Yoon (2012) extend the concept of Country of Origin into more specific items: country of parts (COP), country of manufacturing (COM) to investigate U.S. consumers’ perceived price of the cotton T-shirt in the different combinations of COP and COM. The results show that the perceived price of the product produced in America (COM) with American cotton (COP) is the highest. Reversely, the perceived price of the product with COP and COM label of China is the lowest. These studies have proven both the single COO cue such as country image and multi-level COO cues have an impact on consumers’ perceived price of a product.
The brand is another reference to the internal price. Brand is a concept that abstracts meaning as “high status” originated from a particular configuration of product features (i.e., high price, expensive-looking design, limited offer, etc.) (Park, Milberg, & Lawson, 1991). The position of global brand impacts consumers’ internal price preferences. Steenkamp, Batra and Alden (2003) define a global brand is a brand with the same name being sold and marketed worldwide by centrally coordinated marketing activity. The global brands are associated with global recognition, higher perceived quality and premium price (Steenkamp et al., 2003).
2.1.3.2 Price Sensitivity
Because the essence of the price exchanges, namely, consumers have to sacrifice economic interest to get the products or services, they are consequently conscious about the price. The purchase behavior varies with the change in the price of the products or
services, and the extent of the reaction to the change displays consumers’ price sensitivity (Glynn & Woodside, 2009). According to Glynn and Woodside (2009), price consciousness is one dimension of price sensitivity which denotes buyers’ sensitivity to the differential between buyers’ internal reference price and actual price. It means a high price-conscious consumer is less likely to accept the actual price if is higher than internal reference.
Sharma (2011) points that the price-conscious consumers in both emerging markets and developed markets are more concerned about the ratio between costs and benefits. Even as Usunier (1994) indicates that price-conscious consumers in developed markets do not mind buy products from the less developed markets despite their lower perceived quality. Price-consciousness is more like an enduring personal attitude which varies in intensity across individuals (Sinha & Batra, 1999). Like in the study of Ha-Brookshire and Yoon (2012), demographical variable as the income demonstrates the distinctions of the perceived price of the same product.
2.1.2.3 The COO Cues and Price Sensitivity
As Kumar and Steenkamp (2013) point “One key challenge for ambitious Chinese brands looking to grow in Western markets is that the idea of brands from China still conjures up a one-dimensional image: Low Price.” The Chinese product image has been long perceived by consumers in developed countries as average quality and the lower price (Bell, 2008). The leading smartphone of Chinese brand Huawei position most of its’ products as medium price level, aiming to demonstrate the favorable cost-benefit ratios in the international market (Duong, 2016). With the discussion above, it infers that the consumers with higher price sensitivity will prefer the Chinese brand of Smartphone. The second hypothesis is formulated as:
H2: Price sensitivity has a positive effect on the purchase intention towards the smartphones of the Chinese brands
2.1.4 Subjective Knowledge of Product and Purchase Intention 2.1.4.1 Subjective Knowledge
Alba and Hutchinson (1987) suggest that consumer knowledge has two components: familiarity and expertise. Familiarity is defined as the number of product-related experiences accumulated by a consumer, and expertise is the ability to' perform product-related tasks successfully. The familiarity is product-related to the experience or memory of prior usage or consumption with a particular product (Barber, 2008).
Park and Lessig (1981) suggest that prior product knowledge (or familiarity with the product) influences the extent to which consumers search for, recall, and evaluation of product quality and product choice. The familiarity evolves to be better-developed knowledge structures or internal evaluation mechanism. The evaluation mechanism may be triggered when comes to the product assessment. With the familiarity increases, the internal evaluation mechanism updated which leads to the next level of enhanced knowledge of product attributes.
Brucks (1985) offers another perspective to divide knowledge into three dimensions, past product experience, objective knowledge, subjective knowledge. Objective knowledge and subjective knowledge are different measurements of the past product experience (Barber, 2008). Subjective knowledge is the personal assessment of the self-knowledge level and is difficult to be measured objectively. Brucks (1985) discusses that subjective knowledge is self-appraisal about how much consumers know, so it directly contributes to individuals' confidence. Increasing consumer confidence may reduce anxiety, which leads to the acceptance and trial of new products (Olsen, Thompson, & Clarke, 2003). When consumers feel very confident about their knowledge (high subjective knowledge), they rely more on themselves to make the purchase decision (Barber, 2008)
According to Park and Lessig (1981) levels of perceived (subjective) product knowledge has a different impact on information processing. Consumers with low knowledge select extrinsic information such as brand name or COO to assess product. Conversely, consumers with a high level of knowledge can generate a complex mechanism to understand the product attributes.
2.1.4.2 Products Attributes
The product attributes refer to the tangible (physical components of product) and intangible attributes (non-physical part of the product) (Aaker & Shansby, 1982). The
tangible attributes can be distinguished as the characteristic of products such as the appearance of size, color, or function of composition (Chen, Liu, & Ann, 2018). The smartphone is the combination of art and high technology which does not only reflect the aesthetic but also represents technological achievement. Smartphone is not only limited to the conversation or sending text message and it is an indispensable part of daily life (Yeh et al., 2016). The increased high multi-functional requirements to smartphone pressures the updating of every component of processor, camera, display panel, battery, and memory/storage capacity (Yeh et al., 2016). Chen et al. (2018) describe the product attributes of the smartphone as “Screen size, cameral pixel, exterior design, thickness and weight, durability, ease of operation”. The mobile economy offers another insight into emphasizing the product attributes of the smartphone as portability, interface design (Yeh et al., 2016). The tangible attributes are considered to be the intrinsic attributes of a product (Okazaki & Mendez, 2013).
2.1.4.3 Subjective Knowledge in COO Research
The impact of the subjective knowledge of product towards purchase intention has been widely discussed under the context of COO (Phillips et al., 2013; Cilingir & Basfirinci, 2014; Xin & Seo, 2019). Xin and Seo (2019) examine the Korean functional food purchase intention among Chinese consumers. They (2019) confirm country image and subjective knowledge of Korean functional foods positively affect purchase intention to Korean functional foods. Phillips et al. (2013) investigate United States Midwesterners' intention to consume Korean Food and visit South Korea. In their study, consumers' perceived country image and subjective knowledge of Korea positively enhance purchase intention. Subjective knowledge acts as a positive predictor of consuming. As Xin & Seo (2020) point out: When consumers know little about a country’s product, they strongly rely on the COO cue to infer product quality. Reversely, the more knowledge of the product consumer has, they are less likely to be influenced by the COO cues. Lee and Lee (2009) examine how product knowledge affects consumers’ product evaluation and purchase intention when COO cues are involved. They (2009) find that consumers’ tendency to use COO information is different and it depends on the level of their overall product knowledge. Cilingir and Basfirinci’s (2014) study, they explore how and to what extent COO information affect the product-evaluation process of Turkish consumers. The
role of product knowledge acts as the moderator, showing that product knowledge does not have a significant effect alone on the product-evaluation process but negatively moderates the relationship between COO cues and product evaluation.
Based on the discussion above, if consumers with high subjective knowledge, which means they are confident about their existing knowledge because it comes from the direct experience. Therefore, they are less likely to be motivated to adopt external cues (Barber, 2008). The external cues refer to the perceived brand quality and price on COO cues in this study. According to ELM, consumers will choose the central route to trigger the appraisal mechanism to assess the product. In other word, regardless of the brand origin and price image, the consumers with high subjective knowledge of product offer a more objective evaluation of the product. Consumers with more usage experience of smartphone of Chinese brand are less rely on COO cues to perceive the quality of the product. Therefore, the last hypothesis is formulated as:
H3: Subjective knowledge of the product has a positive effect on consumers’ purchase intention towards the smartphone of the Chinese brands
2.2 Conceptual model
Figure 1 explains the structure of the present study about consumers’ purchase intention towards smartphone of Chinese brands. The contents in the light grey dotted frames are related model and theories. Based on discussion of the model and theories, it deduces the independent and dependent variables presented in the dark solid frames.
It posits that according to ELM model, when consumers in evaluation of a foreign brand they may follow two persuasive information routes, one is peripheral route, and another one is central route. Consumers choose peripheral route are those who lack enough knowledge to assess the actual product performance, therefore, they tend to adopt extrinsic cues to implement evaluation. The extrinsic cue in this study refers to COO and it provides two kinds of references to consumers. One is the perceptual brand quality impression and another one is internal price reference. Based on those two references, consumers determine whether they will purchase a smartphone of the Chinese brand. The perceptual brand quality impression is phrased as the independent variable of perceived
brand quality on COO cue. Because the Chinese products is general regarded with lower price image, so it postulates that consumers with higher price sensitivity will be interested in smartphone of Chinese brands. The adoption of COO price image as internal price reference is summarized as the independent variable of price sensitivity. Meanwhile, consumers choose central route is because they have enough knowledge to evaluate the complicated product attributes of a smartphone. The independent variable of subjective knowledge of product used as a self-assessment to investigate the impact of the non-perceptual factor towards purchase intention.
Figure 1: Structure of framework
Figure 2: Conceptual model
In figure 2, it keeps the part of dark solid frames in figure 1 to display the interplay of independent variables and dependent variable. The dependent variable is Purchase intention towards smartphone of Chinese brand. The independent variables are perceived brand quality on COO cues, price sensitivity and subjective knowledge of product. As aforementioned, the independent variables of perceived brand quality and price sensitivity are perceptual information, and the subjective knowledge of product are non-perceptual information. There is no limitation for a consumer in choosing which information to facilitate their purchasing. So, they are presented in one model to indicate that all the factors may act together in the actual evaluation. These independent variables have positive effects towards the purchase intention towards smartphone of Chinese
brands. The demographical variables such as age, gender and educational level are taken into the investigation as well.
Chapter 3 Method
This chapter aims to investigate the problems with systematic and empirical techniques for presumed variables (Ghauri, Gronhaug, & Strange, 2020). In order to explain the factors of perceived brand quality on COO cue, subjective knowledge of product, and price sensitivity affecting consumer purchase intention towards the smartphone of Chinese brands, it is necessary to introduce the methods that can be used to measure these variables.
3.1 Research Approach
The purpose of this study is to investigate the presumed factors that affect consumers purchase intention towards Chinese smartphones. Three factors are selected as independent variables provided to measure whether they support the effectiveness or reject the influence on purchase intention. The deductive technique is an approach of generalize the amount of data in hypotheses and analyze the relationships of presumed factors with dependent variable (Ghauri et al., 2020). Quantitative research is the process of deductive technique for numerical analysis (Ghauri et al., 2020), which is the preferred method for this study.
The quantitative research method is utilized on account of it can generalize the results that gathered from the survey and use mathematical models or formula test if the data support the hypotheses or not (Walliman, 2018). Since consumers hold different views due to multiple reasons when purchasing smartphones, the quantitative method conducted with survey act as suitable tool to help with collecting potential answers to investigate the influencing factors. Ghauri et al. (2020) addressed that quantitative method tends to analyze massive data and present the deductive results through statistical tests. The results can be dedicated to the findings, which as the same expectations with the proposed research pitch and then provide solid conclusions.
3.2 Survey Design
Survey aims to generalize the collection of samples to gain a large number of data for a systematical analysis (Walliman, 2018). By reason of the research question and purpose
of this study demands sizable samples for examination, it is clear that the primary strategy option nominated to survey. Considering the survey questions should be structured expressly to read and answer, the questionnaire formed in English and contained the relevant questions with hypotheses concepts. The survey is designed to be answered anonymously and posted online in the period from April 2nd to May 2nd in 2020. Anonymous responses refer to the survey maintain objectively and reduces possible biases. In order to collect the responses in standard form and convenient to measure, the answers are designed in ranking agreements with the scale ranging from 1 (= Totally disagree) to 7 (= Totally agree), along with the choice of “I don’t know” in 0. This likert scale provided more agreements expression for respondents and easy for further analyze. It would gain accurate answers that will reflect the perceptions of respondents based on their background and experiences (Matthews & Ross, 2010). The demographic questions are included, together with the questions for hypotheses test, all the questions related to statistical analysis of the research are designed from the empirical literature. In Appendix A, the construct of questions with relevant independent variables and sources are attached.
3.3 Operationalization
The operationalization is based on the literature review to screen the validated survey questions for the research purpose. The survey questions are all developed from prior research in order to ensure the validity. The survey questions about demographical variables such as age, gender and educational level are also included. The survey questions about independent variable of price sensitivity and the dependent variable of purchase intention keep the consistency from the prior studies without adjustment.
The survey questions about the independent variable of perceived brand quality were adapted from the study of Netemeyer et al. (2004) and Roth et al. (2008). In the study of Netemeyer et al. (2004), the survey questions are about the perceived brand quality without the COO cues, so the survey questions from the study of Roth et al. (2008) were used as reference because the survey questions are used to investigate the impact of perceived brand quality (Spanish brands) on brand loyalty.
The survey questions about the independent variable of subjective knowledge were developed from the study of Xin & Seo (2019). But in their study, the survey questions are general assessment of subjective knowledge, considering the understanding the product attributes of smartphone is important to the operationalization of this construct, the survey question of 3.1 “I have sufficient knowledge about the components of smartphones (i.e. processor, storage capacity)” was adapted from the study of Yeh et al. (2016). The survey question of 3.2 “I have sufficient knowledge about the design of smartphones (i.e. Screen size, thickness and weight)” was adapted from the study of Chen et al. (2018)
Here is an overview of the type of variables, constructs, related questions, and the references. The full version of the questionnaire can be found in the appendix A.
Variable Construct Surveyquestion Reference Independent
variable Perceived brandquality 1.1-1.4 (Netemeyer et al., 2004); (Roth et al.,2008) Independent
variable Price sensitivity 2.1-2.4 (Sinha & Batra, 1999) Independent
variable Subjective knowledgeof product 3.1-3.5 (Xin & Seo, 2019); (Yeh et al.,2016) ;(Chen et al., 2018) Dependent
variable Purchase intention 4.1-4.4 (Xin & Seo, 2019)
Table 1: Operationalization
3.4 Data Collection
In the introduction of Denis (2020) discusses that the subsets collected from questionnaires are named as samples, which is the data of populations to investigate research intention. Saunders, Lewis and Thornhill (2016) state that this section should explore the data collection specified with which area needs to be focused, which are the most relevant segments and the targeted respondents of this survey. On account of the main purpose of this study is to discuss if consumers’ purchase intentions about Chinese smartphones are influenced by different factors. As mentioned in the first chapter, the
investigation perception target group are consumers in developed countries. Hence the participants of the survey excluded the answers from developing countries in order to provide solid results.
On account of non-probability sampling presents the generalized information from a subset represents the whole population and the samples are aimed for certain purpose (Saunders et al., 2016). Non-probability sampling is utilized in this study due to the responses are targeted to western smartphone consumers. Primary data is collected in this study, it is from the online survey where participants are kindly asked to spread to other possible respondents. In order to gather as much data for this study, the survey was passed through WhatsApp, Facebook with survey exchange groups, Messenger, or via email. The acknowledgement about the purpose of collecting questionnaire data was provided while sending out the survey. At the date of the survey closed, there are 147 out of 152 practicable answers for the hypotheses tests.
3.5 Data Analysis
While survey samples are collected, the SPSS system is used to analyze and test the data for hypotheses. Bonett and Wright (2015) conclude that the Cronbach’s alpha test is commonly and widely applied as to estimate the “internal consistency” and describes data reliability. Cronbach’s alpha test accurately measures the reliable samples and tests the relevance of data groups (Cronbach, 1951; Vaske, Beaman, & Sponarski, 2017). Considering the independent variables and dependent variable contains multiple questions for deeply investigating the cognition of consumers about Chinese smartphones, a set of data can be analyzed reliably in using Cronbach’s alpha test. The study approved that the presumed factors are accepted for further regression test while the reliability analysis value needs to be over 0.5 (Hinton, Brownlow, & McMurray, 2014).
Since Pearson correlation coefficient is conducive to measure and reduce the redundancy of different factors in order to get optimal data (Benesty, Chen, Huang, & Cohen, 2009), it can help to analyze the connection between independent and dependent variables in this study. When verifying the hypotheses, the multiple linear regression test is utilized due to this model aims to analyze the relationships between independent and dependent variables (Yan & Su, 2009). The multiple linear regression is practical to adopted in this
study to discuss to what extent the presumed factors influence the dependent variable. In the regression test, the result of the t-value should be greater than 2, and the p-value less than 0.05 to present the hypotheses are accepted (Chartterjee & Hadi, 2012). In order to ensure the results in regression tests are reduced the variances, as well as analyze the relationships between independent variables and dependent variable without changes, the control variables are introduced while testing hypotheses (Carlson & Wu, 2012). The control variables in this case are age, gender and education level.
3.6 Validity & Reliability
While testing the effectiveness of three independent variables separately, the validity and reliability need to be considered in the data collection process and in the hypotheses test. It will help to ensure the credible results are provided in the consistent procedure (Saunders et al., 2016).
3.6.1 Validity
It is important that when considering validity, the answers from survey accurately matches with the conceptual variables, and the samples can be analyzed objectively from different respondents’ aspects (Saunders et al., 2016). Since the construct validity is used generally in the measurement of the concepts are consonant with expectations, the data and research purpose should be consistent (Carmines & Zeller, 1979). To make sure the data is valid in proving the hypotheses and further discussion, the relations of question construct contents with the conceptual variables are relevant and excluding the unusable cases. Every question units present in Appendix A are measured accurately that conduct with previous studies not to be deviated from the research purpose and conceptual variables. In the study of Tavakol and Dennick (2011) discuss that validity and accuracy are the pivot point while interpreting the hypotheses results and findings.
3.6.2 Reliability
The reliability is to avoid random errors and keep the consistent sample collection instrument with the results (Saunders et al., 2016). In the collected answers from survey, the presumed factors are tested in reliability analysis to reveal the consistency among the values. As previously mentioned, when testing Cronbach’s alpha, the value of alpha
needs to be above the reliability acceptance level 0.5 for further hypotheses regression test (Hinton et al., 2004).
Presumed factors Cronbach’s Alpha Perceived brand quality 0.827
Price sensitivity 0.627
Subjective knowledge 0.789
Table 2: Cronbach’s alpha test of presumed factors
The results of reliability analysis about these factors demonstrate in Table 2, it is acceptable that perceived brand quality, price sensitivity and subjective knowledge are all above 0.5. Hence, the relationship between the presumed factors and the dependent variable are considered credible and the variables can be further calculated to verify the hypotheses.
3.7 Method Limitation
This study postulates the respondents are already familiar with smartphone of Chinese brands, ignoring that respondents might lack brand awareness of Chinese brands. It is might be a misunderstanding with brands from other countries. Consumers' knowledge of country-of-origin might lead to the inaccuracy of this study. Moreover, the time period of online survey only takes one month, the responses can be more comprehensive if extend the time limits. Due to the research topic is about the purchase intention of western consumers towards smartphone of Chinese brands, the snowballing is not applicable for this study, which limit the response scale (Saunders et al., 2016).
Chapter 4 Result Analysis
4.1 Demographic Analysis
In excluding the incomplete answers to indicate the credible result, there are 147 participants counted as useful out of total 152 answers. The main respondents are at age range from 21 to 30 years old (72.85%), and 68.92% are female compared to 31.08% male. In terms of educational level, 58.22% of participants claim they have a bachelor’s degree. Besides, the responses from non-western countries are not involved, it contains the respondents from 32 western countries and the highest response rate is Swedish (21.62%), following by British (10.14%) and Dutch (6.76%).
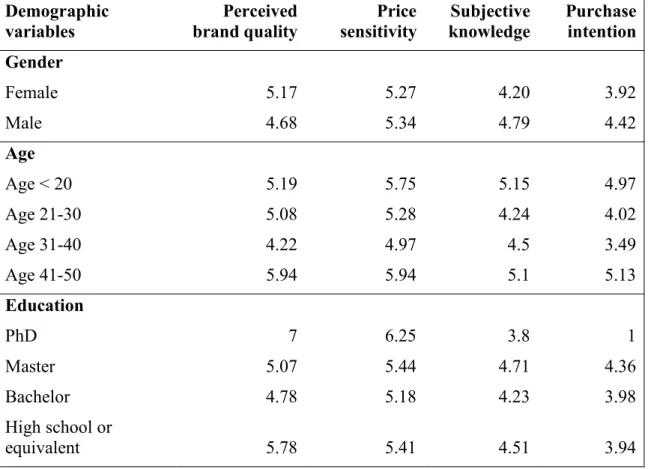
Regarding the agreement scale in the survey is from 1 to 7, the higher the ranking, the more agreement on the questions. In this case, Table 3 states the response mean in demographic variables towards the hypotheses variables and the median of the agreement is 3.5. Following the table, the representative data will be analyzed.
Demographic
variables brand qualityPerceived sensitivityPrice knowledgeSubjective Purchaseintention Gender Female 5.17 5.27 4.20 3.92 Male 4.68 5.34 4.79 4.42 Age Age < 20 5.19 5.75 5.15 4.97 Age 21-30 5.08 5.28 4.24 4.02 Age 31-40 4.22 4.97 4.5 3.49 Age 41-50 5.94 5.94 5.1 5.13 Education PhD 7 6.25 3.8 1 Master 5.07 5.44 4.71 4.36 Bachelor 4.78 5.18 4.23 3.98 High school or equivalent 5.78 5.41 4.51 3.94
Despite that the female respondents are twice as many compared to the males, their agreements on hypotheses variables are similar and above the average line. Whereas males contain slightly higher agreement towards price sensitivity, subjective knowledge and purchase intention, females possess a higher agreement towards perceived brand quality. Which brought up a thought that female consumers are more influenced by the perceived brand quality and males are not considering this variable as important as others.
In the largest age range from 21 to 30, all the agreements towards the variables are above the median line. The opinions on perceived brand quality and price sensitivity in this age group are higher than subjective knowledge and purchase intention. Considering people in this age range are more open to absorbing the information about the quality and the price of different digital products, these gained knowledge can influence more on purchase intention.
In the educational level, the agreements to all hypothesis’s variables in bachelor’s degree and master’s degree are similar to the age group between 21 to 30. Which showed that the respondents in these education and age demographic groups are probably coincident. However, the purchase intention of respondents in master’s degree is slightly higher than those in bachelor’s degree and it leads to the influenced factors can be all three presumed variables.
As the main target group of this study are westerners, the agreements in this respondent group of all variables are over the average level. Whereas the price sensitivity is generally lower than other variables. Between the most responded nations and other nations, the perceived brand quality and subjective knowledge are high, but the price sensitivity is slightly above the average line. Interestingly, these two nation groups have a similar value of all three presumed factors, yet other nations are more willing to purchase Chinese smartphones than most responded nations. While comparing the agreements in general, respondents hold the most cognition on subjective knowledge and the minimum opinions on price sensitivity.
Figure 3: Nations’ perception towards hypotheses variables
4.2 Correlation Analysis
While analyzing the strength and connection between presumed factors and dependent variable, this study adopts the Pearson correlation coefficient analysis in SPSS. Pearson correlation coefficient is widely utilized for investigating whether the relationship is strong enough for further calculation and the interval of the correlation coefficient is r<0.90 (Benesty et al., 2009; Hair, Black, Babin, Anderson, & Tatham, 2006). Therefore, the correlations among the independent and dependent variables are analyzed, the results are listed below in excluding the unusable answers.
Dependent variable: Purchase intention
Independent variable Correlation coefficient Sig. Perceived brand quality 0.405** 0.000
Price sensitivity 0.235** 0.004
Subjective knowledge 0.310** 0.000 ‘**’ stands for correlation is significant at the 0.01 level (2-tailed).
In Table 4, on account of the results are being valid at a significant level p<0.05, the correlation results of independent variables towards dependent variable are all credible and usable in the following regression test (Chartterjee & Hadi, 2012). The correlations between independent variables and dependent variable can be described as: perceived brand quality (PBQ) and purchase intention shows 0.405**, price sensitivity (PS) and purchase intention is analyzed as 0.235**, with the result of subjective knowledge (SK) and purchase intention is 0.310**. The relationships of PBQ, PS and SK towards purchase intention have strong significance since the results are all at the 0.01 level for further calculation.
Independent Variables PBQ PS SK
PBQ 1.000
PS 0.086 1.000
SK 0.284** 0.158 1.000
‘**’ stands for correlation is significant at the 0.01 level (2-tailed).
Table 5: Correlation matrix between presumed factors
The independent variables are connected to each other, but the relationship is not strong in Table 5. In the circumstances that among the three presumed factors are in the interval of the r-value<0.90, in Pearson’s correlations, there are no multicollinearity between the independent factors (Hair et al., 2006). Consequently, the three presumed factors are available in the next regression test.
4.3 Regression Test
4.3.1 Results with Control Variables
Since the multiple linear regression is testing quantitative dependency of multiple independent variables towards one dependent variable (Freedman, 2009). The multiple linear regression analysis is chosen to test the hypotheses under the consideration of the conceptual model in this study and the result should be approved while t-value >2 and p-value<0.05 (Chartterjee & Hadi, 2012). In order to ensure the practical regression analysis results, control variables are introduced in the hypotheses test. The control
variables are constant to avoid changes; thus age, gender and education level are introduced in the test (Carlson & Wu, 2012).
Model 1 Model 2
Std. Beta t Sig. Std. Beta t Sig.
Control variables Age Gender Education 0.010 0.114 -0.028 0.108 1.307 -0.326 0.914 0.193 0.745 -0.012 0.127 -0.022 -0.153 1.589 -0.296 0.878 0.114 0.767 Independent variables
Perceived brand quality Price sensitivity Subjective knowledge 0.380 0.190 0.219 4.988 1.760 2.365 0.000 0.081 0.019 Model summary F-Value R2 R2adj. 0.700 0.015 -0.006 7.698 0.260 0.227
Table 6: Regression results of hypotheses
Model 1 demonstrates when the regression test only included control variables influencing purchase intention. The R2only explains 0.015 and the adjusted R2shows as
-0.006 in this model, it reveals that the control variables are invalid in this test. In the interval of t-value and p-value, the results of the control variables are unacceptable to affect the dependent variable and barely significant in this model.
In model 2, the independent variables are tested with control variables and the result of control variables present the same situation as in model 1. Whereas the R2 and adjusted
R2 are increased in the introduction of independent variables. The significance level of
perceived brand quality is 0.000 and the t-value is calculated as 4.988, it accepts this independent variable influence purchase intention towards Chinese smartphones positively. The second independent variable is tested the t-value as 1.760 with the p-value of 0.081, both of the results are outside the range of acceptance level. Accordingly, price sensitivity shows no positive influences on consumers’ purchase intentions. The subjective knowledge is at the acceptance line of t-value at 2.365 and p-value at 0.019. On account of the results of subjective knowledge being approved in the interval, this independent variable has a positive effect on purchase intention.
Hence, the regression test shows that hypothesis 1 and 3 are approved, hypothesis 2 is rejected.
4.3.2 Age Groups
In order to analyze different control variables affecting the results of independent variables, this study divides age, gender and education in groups. The age is divided as respondents less than 30 years old, age from 31 to 40 years old and age above 41 years old.
Age less than 30 Age 31 to 40 Age above 41 Independent variables PBQ PS SK PBQ PS SK PBQ PS SK R2 0.175 0.588 0.851 R2adj. 0.153 0.488 0.702 Std. Beta 0.209 0.084 0.293 0.695 0.249 -0.005 0.912 0.187 -0.029 t-value 2.402 0.934 3.214 4.478 1.622 -0.034 4.058 0.699 -0.107 Sig. 0.018 0.352 0.002 0.000 0.121 0.973 0.027 0.535 0.921
Table 7: Age groups
Participants from 31 and above are taking perceived brand quality into consideration more than other two independent variables. Conversely, responses less than 30 years old
are concerned about perceived brand quality while they purchase, the subjective knowledge weights the most in this age group. Comparing the t-value and p-value in these variables, the influence of perceived brand quality is accepted by all age groups and subjective knowledge is only accepted by participants who are less than 30 years old. Which explains the results in model 2 (see in Table 6) that perceived brand quality is highly accepted and followed by subjective knowledge. Besides that, it is clear the results of price sensitivity in every age range do not support the hypothesis, which explains the reason that hypothesis 2 is certainly rejected.
4.3.3 Gender Groups
In gender groups, the respondents identify themselves as either female or male, thus this study discusses the results presented in the female group and male group.
Female (68.92%) Male (31.08%) Independent variables PBQ PS SK PBQ PS SK R2 0.222 0.397 R2adj. 0.198 0.393 Std. Beta 0.312 0.057 0.302 0.565 0.195 -0.091 t-value 3.437 0.588 3.105 3.954 1.493 -0.679 Sig. 0.001 0.558 0.003 0.000 0.143 0.501
Table 8: Gender groups
The regression result of perceived brand quality is both accepted in the two gender groups while males concerning this concept slightly higher than females. Moreover, in the result of subjective knowledge, females value this concept is more important in purchasing intention than males and the result is higher compared with model 2 (see in Table 6). In the male group, the result of subjective knowledge is rejected and it demonstrates the perception of males brought down the regression result of this independent variable in model 2 (see in Table 6). As in the price sensitivity, although
males considered more important than females, this independent variable is not in the acceptance interval and rejected.
4.3.4 Educational Level Groups
In the educational level groups, since over half of the participants are in the bachelor’s degree, the samples in this range are formed as one group. The other two groups in education levels are those from master to PhD and from high school (or equivalent) to primary school.
Master to PhD Bachelor High school to
primary school Independent variables PBQ PS SK PBQ PS SK PBQ PS SK R2 0.648 0.202 0.137 R2adj. 0.423 0.172 0.072 Std. Beta 0.553 0.049 0.283 0.251 0.165 0.266 0.233 0.215 0.093 t-value 4.446 0.380 2.169 2.499 1.632 2.608 1.575 1.343 0.587 Sig. 0.000 0.706 0.037 0.012 0.107 0.011 0.123 0.187 0.560
Table 9: Educational level groups
The results from group of high school (or equivalent) to primary school are distributed all out of acceptance range and there are only 15.07% responses in this group. However, among the independent variables, the influence of perceived brand quality towards purchase intention is considered the most in this group. In the educational level group of bachelors, the results of perceived brand quality and subjective knowledge are similar and supported. Between these two independent variables, this group values subjective knowledge more than perceived brand quality while purchasing. Furthermore, the results of the Master to PhD group shows that they regard perceived brand quality as important, and subjective knowledge is near the acceptance line. While comparing the performance of the three independent variables, only bachelor group concerned subjective knowledge
is the most important. It can be considered that respondents in this group are more focusing on the product based on empirical thoughts apart from other factors. Despite the price sensitivity is not accepted, the bachelor group considered this variable the most important compared to the other two groups. On account of the majority of participants in this group are fresh in economic independence, the other two groups either have family members to support or stable income. It is not so surprising to see bachelor group concerns these factors while purchasing Chinese smartphones.
Chapter 5 Discussion
Although there are amounts of studies that have chosen products of “made-in-China” as a research objective to investigate the country-of-origin effect, the traditional label of “made-in-China” can not accurately describe the perception of the smartphone of the Chinese brands and the purchase intention.
This study based on the ELM model and cue utilization theory to deduce the factors of perceived brand quality on COO cues, price sensitivity and subjective knowledge of the product to examine factors that affect consumers’ purchase intention of the smartphone of the Chinese brands. This study is a supplement to the ELM model and cue utilization theory under the context of COO research.
The study adopted an online survey to get answers of the respondents from Western countries. Chinese respondents were excluded as well because the ethnocentrism might lead to bias (Xin & Seo, 2019).
The analysis of the conceptual model shows that hypothesis 1 and hypothesis 3 were supported. The perceived brand quality and subjective knowledge have a positive effect on the purchase intention of the smartphone of the Chinese brands. The perceived brand quality has a greater impact on purchase intention than subjective knowledge of the product. Hypothesis 2 was rejected because the price sensitivity loses significance in the conceptual model.
The positive relationship between the perceived brand quality and purchase intention of the smartphone of the Chinese brand is found in this study. This finding is partly consistent with the study of Kim and Chao (2018), which reports the perceived brand quality of Chinese brand Huawei is the strongest indicator of brand loyalty while brand loyalty is the indicator of re-purchase behavior. In their study, the respondents are consumers from the developing market of Columbia, the present study finds that the consumers from Europe are also focus on the quality of Chinese brand when comes to purchasing. There is no significant difference between consumers from the developing and developed market in terms of the perceived brand quality to purchase intention. Roth et al. (2008) confirm the COO cues positively effect on perceived brand quality. It