School of Health Sciences, Jönköping University Swedish Dental Journal, Supplement 207, 2010
Immigrant background and
orthodontic treatment need
Quantitative and qualitative studies in
Swedish adolescents
EVA JOSEFSSON
DISSERTATION SERIES NO. 10, 2010 JÖNKÖPING 2010
The Institute for Postgraduate Dental Education, Jönköping
© Eva Josefsson
, 2010Publisher: School of Health Sciences Print: Intellecta Infolog
ISSN 1654-3602, 0348-6672 ISBN 978-91-85835-09-6
To all the young people who took part in these studies
“May God grant me
- the serenity to accept the things that cannot be changed, - the courage to change the things that can
and
- the wisdom to know the difference.”
Contents
Abstract ... 5
Preface ... 7
Introduction and review of the literature ... 8
Aims ... 19 Subjects ... 21 Methods ... 25 Results ... 33 Discussion ... 49 Key findings ... 64 Conclusions ... 66 Summary in Swedish ... 67 Svensk sammanfattning……… . 67 Acknowledgements ... 69 References ... 71 Appendix ... 84 Paper I-V
Abstract
During the last three decades there has been an increased influx of refugees and immigrants into Scandinavia. The overall aim of this thesis was primarily to improve our knowledge of malocclusion and orthodontic treatment need, both normative and self-perceived, in adolescents of varying geographic origin. A further aim was to determine whether any differences with respect to perception of general appearance and psychosocial well-being were related to geographic origin.
Papers I and II concerned self perceived and normative orthodontic treatment need. About 500 12-13 year-old subjects, stratified into different groups: A-Sweden, B-Eastern/Southeastern Europe, C-Asia and D-other countries, answered a questionnaire and underwent clinical examination by the author. In paper III the association between the two variables in papers I and II was investigated. Paper IV was a follow up study, at 18-19 years of age, of the relationship between geographic origin and prevalence of malocclusion, self-perceived treatment need, temporomandibular symptoms and psychosocial wellbeing. In Paper V a qualitative study of 19-20 year old subjects was conducted, to identify the strategies they had adopted to handle the issue of persisting poor dental aesthetics.
The main findings were that at 12-13 years of age, immigrant subjects had a lower perceived orthodontic treatment need than subjects of Swedish background. Girls of Swedish background had the highest self-perceived treatment need, whilst girls of non-Swedish background were most concerned that fixed appliance therapy would be painful. In a few of the clinical variables measured at 12-13 years of age, the Swedish group exhibited the greatest space deficiency and irregularity in both the maxillary and mandibular anterior segments and greater overjet, compared to the Eastern/Southeastern European and Asian groups. The clinical implications were negligible. The orthodontic treatment need according to “Index of Orthodontic Treatment Need - Dental Health Component” (IOTN-DHC) grades 4 and 5, ranged from 30 to 40 per cent, without any inter-group differences. There were strong associations between subjects perceiving a need for orthodontic treatment and
IOTN-DHC grades 4 and 5, anterior crossbite and avoiding smiling because they were self-conscious about their teeth. At the age of 18-19 years, the frequency of malocclusion was similar in all groups. Subjects of Asian origin had a higher self-perceived orthodontic treatment need than their Swedish counterparts and a higher frequency of headache than those of Eastern/Southeastern European origin. Psychological wellbeing was reduced in nearly one quarter of the sample, more frequently in girls than boys. No association was found between self-perceived orthodontic treatment need and psychological wellbeing.
The theory “Being under the pressure of social norms” was generated in Paper V, and it can be applied to improve our understanding of young adults who have adjusted to living with poor dental aesthetics and also aid to identify those who are not as well-adjusted and would probably benefit from treatment. Undisclosed dental fear is an important barrier to acceptance of orthodontic treatment in early adolescence.
Despite demographic changes due to immigration, no major change in the prevalence of malocclusion and normative orthodontic treatment need has been disclosed. This does not apply to adolescents and adults who immigrated at an older age.
Preface
This thesis is based on the following papers, which will be referred to in the text by their Roman numerals.
I. Josefsson E, Bjerklin K, Halling A. Self-perceived orthodontic treatment need and culturally related differences among adolescents in Sweden. European Journal of Orthodontics 2005; 27: 140-147.
II. Josefsson E, Bjerklin K, Lindsten R. Malocclusion frequency in Swedish and immigrant adolescents-influence of origin on orthodontic treatment need. European Journal of Orthodontics 2007; 29: 79-87.
III. Josefsson E, Bjerklin K, Lindsten R. Factors determining perceived orthodontic treatment need in adolescents of Swedish and immigrant background. European Journal of Orthodontics 2009; 31: 95-102.
IV. Josefsson E, Bjerklin K, Lindsten R. Self-perceived orthodontic treatment need and prevalence of malocclusion in 18- and 19-year-olds in Sweden with different geographic origin. Swed Dent J 2010; 34: 95-106.
V. Josefsson E, Lindsten R, Hallberg L R-M. A qualitative study of the influence of poor dental aesthetics on the lives of young adults. Acta Odont Scand 2010; 68:19-26.
The articles have been reprinted with the kind permission of the publishers of the respective journals.
Introduction and review of the literature
Immigration
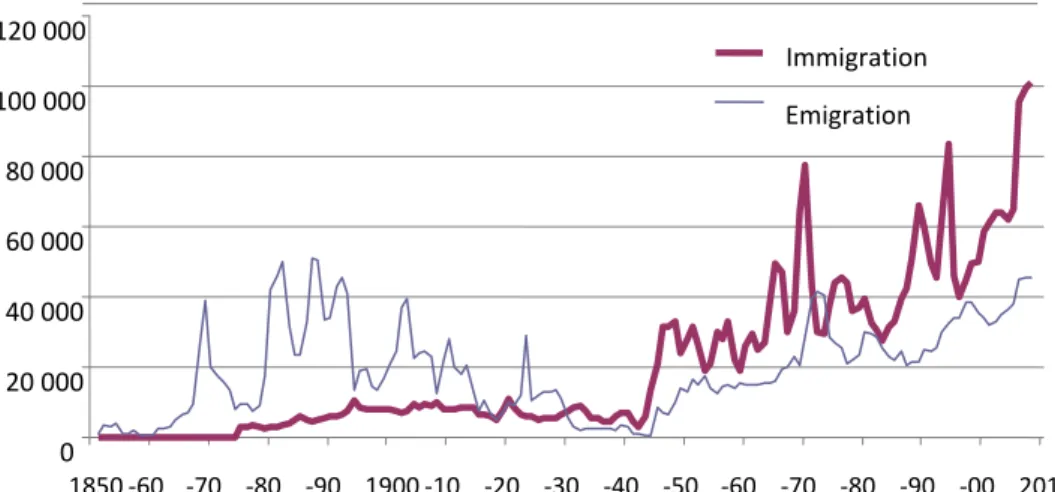
Immigration to Sweden is a post-war phenomenon. In recent years immigration to Sweden has been immense (Figure 1) and continues to be high. In 2008, Sweden accepted 101,171 immigrants, the greatest annual number ever.
Figure 1. Immigration and emigration in Sweden during the years 1850 to 2008.
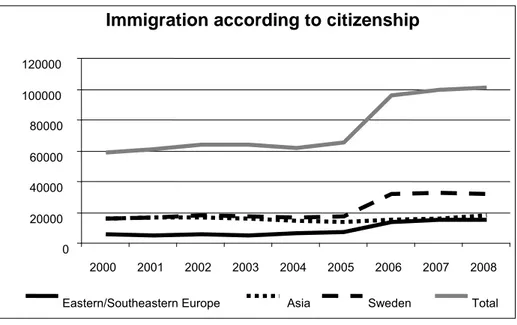
The most recent immigrants comprise mainly young people: in 2008 the mean age was 27.8 years for men and 27.2 for women. The citizenship of 169 different countries was represented, but most were people with Swedish citizenship, who had previously lived in Sweden (Figure 2). The second largest group of immigrants was of Iraqi origin.
From World War II to 2008, 2.4 million people have moved to Sweden and 1.4 million have left the country. Thus, in just over 50 years, the number of foreign-born people in Sweden has increased by around 1 million. From having been almost unnoticeable in the overall
0 20 000 40 000 60 000 80 000 100 000 120 000 1850 ‐60 ‐70 ‐80 ‐90 1900 ‐10 ‐20 ‐30 ‐40 ‐50 ‐60 ‐70 ‐80 ‐90 ‐00 2010 Immigration Emigration
population, immigrants have become an inherent part of Swedish society.
Migration from The Middle East has dominated immigration in recent decades, together with the influx of refugees from the Balkans in the 1990’s. Since the beginning of the 1970s, immigration has taken on a somewhat different character: refugees and the associated immigration of their close relatives have becoming increasingly predominant. At the same time, labour immigration has been minimal. The number of asylum seekers depends partly on unrest in different parts of the world and partly on Swedish immigration policies. One example of this is the war in former Yugoslavia, which resulted in a substantial flow of asylum seekers to Sweden in 1992 and 1993.1
Figure 2. Distribution of immigrants to Sweden of Eastern/Southeastern European, Asian and Swedish origin in relation to total number of immigrants.
Immigration according to citizenship
0 20000 40000 60000 80000 100000 120000 2000 2001 2002 2003 2004 2005 2006 2007 2008 Eastern/Southeastern Europe Asia Sweden Total
Definitions
An immigrant is a person who moves from one country to another and intends to be a resident of the new country for a period of at least one year.1 Statistical yearbook of Sweden2 has introduced the term “person of foreign background” as a synonym for the term “immigrant”, to define a person’s relationship to the country in which he or she lives. Today, the Swedish authorities define people of foreign background as follows: ”People of foreign background are those born outside Sweden, or born in Sweden, with two foreign-born parents”. In December 2003, the definition of this term was adopted by the Swedish authorities to replace the earlier description of people of ”immigrant background” which had included those with at least one foreign-born parent.
Immigrants’ children who are born in Sweden are not by definition immigrants, but are often referred to as ”second generation immigrants”.
Immigrant background – earlier description of people born outside
Sweden or born in Sweden with at least one foreign-born parent.
Foreign background – foreign-born people, or people born in Sweden
with both parents born outside Sweden.
Ethnicity – is a description for a number of attributes such as genetic
inheritance and ancestry, religion and culture (including diet, language, dress and lifestyle). “Ethnicity” is defined in the UK as “a group with a long-shared history and a distinct culture”.3
An ethnic group is a group of humans whose members identify with each other, through a common heritage that may be real or presumed.
Culture – refers to shared patterns, meanings and behaviors of a social
group. It generally refers to patterns of human activity and the symbolic structures that give such activity significance.3 Cultures can differ in a number of ways. These differences are based on combinations of values and norms. Cultures are often based on some sort of religion or faith. Cultural changes may occur, in response to the environment (including education and socioeconomic status), to inventions and to contact with other cultures.
Immigrants in Sweden
Data on the number of immigrants in Sweden vary, depending on how the term "immigrant" is defined. At the end of 2008, there were 1,281,581 foreign-born persons in Sweden. The majority, about 176,000, were born in Finland, 109,000 in Iraq and 72,000 in Former Yugoslavia. It is estimated that there are around 380,000 Swedish-born people, both of whose parents were foreign-born. Around one seventh, or 16 per cent, of Sweden's population comprises people of foreign background, such as foreign-born people, or people born in Sweden, but both of whose parents are foreign-born. Moreover, almost 624,000, i.e. about 7 per cent of the population are Swedish-born but with one foreign-born and one Swedish-born parent.
In the year 2000, approximately 24 per cent of children and adolescents (0-17 years) were of non-Swedish origin, i.e. he or she, or at least one of their parents was born outside Sweden.4
Only eight years later, in 2008, the corresponding frequency was 27.9 per cent.2
This demographic change has raised many issues related to integration of refugees and immigrants from different cultural backgrounds into Swedish society. One important issue is the provision of appropriate education and healthcare for children with parents of foreign background. A change towards a society of greater ethnic heterogeneity
per se does not necessarily imply an increase in health-related problems
among adolescents, but because of the rapid change which has occurred in Sweden there may well be a change in the spectrum and a shift in the relative frequency of such issues. The diversity of background among adolescents needs to be recognized, not only by health professionals, but also by policy-makers.
Two factors with important implications for planning of orthodontic services are the frequency of malocclusion and orthodontic treatment need. Whether the major demographic change described above is influencing the frequency and type of malocclusion and orthodontic treatment need in Swedish adolescents has not been determined.
Malocclusion frequency, orthodontic treatment need and
demand in Sweden
The prevalence of malocclusion in a population is a fundamental determinant of appropriate levels of orthodontic services. From a planning perspective, the importance of epidemiological studies to provide current data on the prevalence of different types of malocclusions and orthodontic treatment need in a population cannot be overestimated.5
Thirty-five years ago, the frequency of malocclusion in the Swedish population, i.e. deviations from normal dental arrangement (ideal occlusion), was estimated to be about 75 per cent.6,7
Twenty years ago, studies in Norway and Denmark reported that about 30-40 per cent of children and adolescents underwent orthodontic treatment8-10
A recent study stated that the frequency of treated children and adolescents in Nordic countries varied between 11 and 35 per cent and in Swedish children and adolescents, about 20 to 40 per cent, with a mean value of 27 per cent.11
However, there are no epidemiological studies describing the current frequency of malocclusion in Sweden: early orthodontic treatment has eliminated some types of malocclusion and thus it is no longer possible to determine the exact prevalence.
Demand for orthodontic treatment is increasing in many countries, but not all malocclusions need to be treated. In Sweden, orthodontic treatment is provided under the auspices of the public dental services, as part of the comprehensive provision of dental care for children, adolescents and young adults up to the age of 20 years. Priority is based on greatest need, i.e. highest priority is given to a malocclusion associated with risk of tissue damage, functional disturbances or psychological problems.12
In countries where orthodontic treatment is subsidized to some extent by public funding, different indices are used to determine eligibility for such treatment.13-16
These indices are based on professional assessment of severity of malocclusion. Some indices also include assessment of aesthetics. Indices may be classified according to their different purpose: Diagnostic, Epidemiological, Treatment need, Treatment success and Treatment complexity.17
Indices for estimation of treatment need are used to select patients for treatment, but also to exclude patients with minor orthodontic conditions from being eligible for treatment. Whether these indices select the same patients or not, is an important question. A comparison of three indices when a group of orthodontists set the gold standard resulted in good agreement after adjusting the cut-off points for the different indices.18
A recently published study from Stockholm, Sweden, reported no agreement at all,19 when an index that has been debated, was used.20
The cut-off point for eligibility for subsidized treatment is a political rather than a clinical issue.
Over the years, numerous indices for estimating treatment need have been introduced: Grainger introduced the Treatment Priority Index, TPI,21
in 1967 the index from the Swedish National Board of Health, Swe NBH was introduced,22,23 Indication Index, developed by Lundström,24
the Orthodontic Indication Index according to Bergström25
and OMFI, Occlusal Morphology and Function Index.26
The Index of Orthodontic Treatment Need (IOTN) has facilitated more objective assessment of treatment need, incorporating both a dental health component (DHC)27
and an aesthetic component (AC).28
Details of the DHC and representative photographs of the AC have been published.27
The validity and reliability of the IOTN have been established 29,30 but not without discussion and debate.31-33 Mohlin et al.33 has shown that IOTN-DHC is not adjustable for all ages and offers very limited help when selecting patients in the middle of the range of severity of malocclusion. Some authors have reported a more favourable patient rating of the aesthetic component than the professional rating.34
Objective and subjective orthodontic treatment need was studied in 8 to 16-year-olds in different parts in the Stockholm area.35 The results showed that objective treatment need ranged from 24 to 29 per cent and subjective treatment need from 22 to 30 percent. The authors concluded that neither the objective, nor the subjective need for orthodontic treatment exhibited any tendency to decline.
When 19-year-olds leave the free Public Dental Service in Sweden, some have persisting functional malocclusions or poor dental aesthetics.36,37 One reason may be that in early adolescence, their malocclusion traits had been assessed as mild deviations from the normal, for which no
treatment was offered. Another reason may be that at the time treatment was offered, in early adolescence, the individual was not concerned about the appearance and function of the dentition and declined the offer of orthodontic treatment. A third reason may be relapse of earlier treatment.
An earlier study of orthodontic care in three different counties in Sweden showed that 28 to 42 per cent of all inhabitants up to 20 years of age had undergone orthodontic treatment.38 Residual treatment need and demand in these young people when they leave the Public Dental Service have also been investigated. In several studies of Swedish 19-year-olds, residual definite orthodontic treatment need is estimated at twenty per cent 37,39 and subjective demand for treatment at about 8 per cent.37,40
Frequency of malocclusion, orthodontic treatment need
and demand in relation to geographic origin
Earlier studies have shown that occlusal characteristics and the prevalence of occlusal anomalies vary in different populations and ethnic groups. Thus orthodontic treatment need varies among children of different foreign origin.41-46 Orthodontic treatment uptake is also influenced by socioeconomic, ethnic and cultural factors.43
The prevalence of malocclusion and treatment need in different populations have been investigated in numerous studies (Table A).5,6,35,41,42,44-61
The reported frequencies of malocclusion vary from 39 to 93 per cent.50,62 This wide range may be attributable to differences in registration methods63,64
and/or differences in the ages of the populations examined, but may also have a genetic basis.
In most countries, there is increasing demand for orthodontic treatment. In this context, the importance of self-perceived orthodontic treatment need should not be underestimated. The major factors determining a patient’s perceived need for treatment may broadly be described as aesthetic, functional, financial or social.65 While the orthodontist is obliged to prioritize function and occlusion in objective assessment of treatment need5,14,16,48,66,67 the patient might perceive other factors to be just as important. A questionnaire study by Fox et al.68
aesthetics were of greater concern to children seeking orthodontic treatment than to other children.
Cultural or geographic origin can also influence self-perceived treatment need and demand.35,69,70 Although family, cultural background and ethnic origin are acknowledged as highly influential in shaping children’s attitudes, the perspectives of refugee and immigrant children and adolescents may be further modified as they adapt to life in a new country and are exposed to the cultural values of their Swedish peers: sometimes the influence of foreign origin may be only minor.69
The extent to which the perspectives of refugee children and adolescents are modified by this exposure is not known.
The relationship of gender to frequency of malocclusion has been addressed in several investigations, with conflicting results. The majority opinion seems to be that there are no major gender differences in objective orthodontic treatment need,71 but some studies have reported higher frequency and more severe malocclusion in males.7,72,73
A higher normative treatment need in girls has also been shown.69 Sex differences have been reported for some specific malocclusion traits: higher frequency of anterior crossbite,5,74 maxillary overjet and spacing in males and crowding in girls.5
O’Brien showed a strong association between gender and uptake of orthodontic treatment:75 being female increases the odds of receiving orthodontic treatment.49
In a study of Chinese schoolchildren, Wang et al.52 found a very high orthodontic treatment need (Grades 4 and 5) in 37 per cent: about 27 per cent were keen to receive treatment. A definite relationship was found between negative self-appraisal of dental appearance and demand for orthodontic treatment.
Objective and subjective orthodontic treatment needs have been studied in children and teenagers living in the Stockholm area. The highest prevalence was found in areas with a large immigrant population. In all the investigated areas, the subjective demand for treatment was 1-1.5 per cent less than the objective need.35
An American study reported a higher objective treatment need in white children than in black, but the latter were less satisfied with their smile. No gender differences emerged with respect to either objective or
subjective treatment need.76
Mandall et al.69
found no differences in self-perceived treatment need between Caucasian and Asians.
In this context, little is known about the attitudes of Swedish adolescents. Are perceived need and attitudes to dental appearance and orthodontic care among adolescents of foreign background different from those of their Swedish-born cohorts? Are any differences in attitudes among adolescents of immigrant background related to their specific family backgrounds, e.g. do the attitudes of those of Middle Eastern origin differ from those of eastern European origin?
Given that nearly 30 per cent of the Swedish population under 20 years of age has at least one foreign-born parent and in nearly 20 per cent of cases both parents are foreign-born, the answers to these questions may have important implications with respect to policies for provision of appropriate orthodontic services in Sweden. To date there are few such studies which take these issues into account.
Malocclusion and psychological well-being
It has long been recognized that people seek and undergo orthodontic treatment, not because of the anatomic irregularities per se or to prevent the destruction of tissue within the oral cavity, but because of the aesthetic impact of the malocclusion.77 During the past two decades, this topic has been investigated intensively and specially with reference to the association between malocclusion and oral health-related quality of life.78-82
The relevant question in relation to aesthetics is whether malocclusion contributes to psychological problems or dissatisfaction with appearance. It appears that much orthodontic treatment was being justified on psychological grounds for which there was little direct evidence. Without objective evidence of a long-term positive effect of orthodontic outcomes on psychological well-being, the issue cannot be fully investigated and will not be resolved.83
In Sweden, psychological factors were highlighted as an indication for orthodontic treatment in 199112
but internationally had warranted attention even earlier.84,85 Orthodontic treatment should not be motivated solely by reduced function.
In an evaluation of the short-term effects of orthodontic treatment, Kenealy et al.86 concluded that there was little support for the hypothesis that poor dentition has a negative effect on children’s psychological well-being. If this is so, then why is there such a high demand for orthodontic treatment? This question raises issues to do with physical appearance and attractiveness. The notion of perfect teeth is strongly related to a concept of beauty that embodies the ideas of goodness, wealth and happiness. Social expectations contribute to cultural definitions of beauty and the literature on physical attractiveness suggests that appearance may be a potent source of social stereotyping.
Opinions differ about the influence of orthodontics on psychological well-being. In a study of children with Class II malocclusion, O’Brien87 found an increase in self-esteem in children who received early treatment, compared to controls, at least in the short term. A review article by Liu et al.88
drew the conclusion that there is an association between malocclusion/orthodontic treatment need and poor health-related quality of life and that they coexist in the same population.
In a follow-up study on 31-year-olds, Shaw et al.89 did not find any differences concerning satisfaction with own dentition, between treated and untreated, when pre-treatment self-esteem in 1981 was factored in. Furthermore, Kenealy et al.83
found that when the current level of self-esteem was controlled for, it emerged that in patients with a prior need for treatment, orthodontic treatment had had a significant effect on dental status and dental attractiveness, as would be expected, but no significant effect on psychological health, life satisfaction, quality of life or health status. These findings are consistent with those of Albino90, that dental-specific evaluations appear to be influenced by treatment, while more general psychosocial responses are not. Visible malocclusion has no discernible negative effect on social and psychological well-being, and orthodontic treatment has no discernible positive effect.
Orthodontics cannot be justified on psychological grounds alone, although there are minor psychological effects that contribute to an individual’s perception of self-esteem. From a phenomenological perspective, the dentition is important to the individual’s perception of self during adolescence. However, by adulthood, other psychological and
social factors are of greater importance to general health and psychological well-being.83
Aims
The present thesis is based on a six-year longitudinal study, from 2001 to 2007, of malocclusion and orthodontic treatment need and uptake in a representative sample of Swedish subjects, initially aged 12-13 years. The overall aim was to investigate the potential influence of specific immigrant background on such issues as frequency of malocclusion, treatment need and barriers to orthodontic treatment uptake in early adolescence; and to identify, in late adolescence, differences between native born and immigrants with respect to frequency of malocclusion and self-perceived treatment need and to highlight the main concerns of young adults with poor dental aesthetics.
Paper I
To compare 12- and 13-year-old boys and girls of Swedish and immigrant backgrounds, with special reference to the following:
self-perceived need for and attitude to orthodontic treatment attitude to own teeth and general appearance
behavioral pattern and psychosocial functioning
self-perceived need for orthodontic treatment in relation to psychosocial functioning.
Paper II
To compare the frequency of malocclusion and orthodontic treatment need in 12- and 13-year olds of Swedish and immigrant background.
Paper III
To investigate the association between self-perceived orthodontic treatment need and malocclusion in 12-13 year-olds of Swedish and immigrant background.
Paper IV
To record current orthodontic treatment need in a follow up study of 18-19 year-olds and to analyze any differences related to geographic origin, with special reference to the following: frequency of malocclusion, self-perceived treatment need, previous orthodontic treatment, current interest in treatment, body esteem and psychological wellbeing and prevalence of symptoms of temporomandibular disorders.
Paper V
To apply a grounded theory approach to generate a theory highlighting the main concerns of young adults, 19-20 years of age, with poor dental aesthetics and the measures they adopt to manage this condition in everyday life.
Subjects
In this thesis the following nomenclature has been used:
Early adolescence – subjects 12-13 years of age Late adolescence – subjects 18-19 years of age Young adult – subjects 19-20 years of age
During the years in which the studies were conducted, the criteria applied in Sweden to describe “a person of immigrant background” were officially changed. To allow comparison of the results of early and later studies, the earlier definition was retained throughout the studies, i.e. a person of immigrant background is defined as someone with at least one parent born abroad.
The initial population sample in papers I-III comprised 553 subjects: all the 12-13 year olds (born 1988 and 1989), in six schools in Jönköping and Motala. Jönköping, with 125,000 inhabitants, is one of the largest ten cities in Sweden; Motala is smaller, with 42,000 inhabitants. The uptake areas for these schools had a mixed socio-economic structure and the immigrant frequency was higher than the Swedish national average. In the present studies the term “immigrant” denotes a subject with at least one parent born outside Sweden. On the days on which the examinations were conducted, 37 subjects were absent from school due to illness and some declined to participate: 8 in Paper I and 23 in Paper II, respectively.
The remaining students were stratified into four groups according to family origins,
A – Subject and both parents born in Sweden
Subject or at least one parent born in: B – Eastern/Southeastern Europe (Albania, Bosnia-Herzegovina, Kosovo, Croatia, Hungary, Former Yugoslav Republic of Macedonia, Poland, Romania, Serbia, mainly former Yugoslavia), C – Asia (Cambodia, China, Lebanon, India, Iran, Iraq, Pakistan, Syria, Turkey, Vietnam, mainly Middle East) and D – other countries (Africa, America, Western Europe except Scandinavian countries).
Two children were adopted and were included in group A in Paper I, and stratified according to parents’ origin in papers II and III. In the case of eight subjects, both parents were foreign-born, but were not from the same geographic area (B,C,D): these subjects were grouped according to the mother’s origin.
For 97 per cent of the subjects from Eastern/Southeastern Europe, 92 per cent from Asia and 44 per cent from other countries, both parents were born outside Sweden. Of the 97 per cent of subjects in the Eastern/Southeastern European group with both parents born outside Sweden, the parents of 94 per cent had both been born in Eastern/Southeastern Europe. In groups C and D, the parents of 86 per cent in each group had both been born in the same region. In the Eastern/Southeastern European group (B), no mothers and two fathers were born in Sweden. In the Asian group (C), seven mothers and no fathers were born in Sweden and in the other countries group (D), 16 mothers and 12 fathers were born in Sweden.
The sample in Paper III was selected from that in papers I and II, but was restricted to subjects with both parents born in the same area. Three groups were selected according to family origin:, A - Sweden, B - Eastern/Southeastern Europe (Former Yugoslavia) and C - Middle East (Lebanon, Iraq and Syria). The group “other countries” was excluded in this paper because of its diversity.
Six years after the initial examination, a follow-up study, including re-examination, was conducted on the same sample. The subjects were now aged 18-19 years (Paper IV). Of the initial study sample, 482 were still living in one of the two town areas. There were 186 non-responders, but 53 of them were interviewed by telephone. The subjects were stratified as in papers I and II. Group D, (other countries), was excluded as it was inhomogeneous and the results from the questionnaire and clinical examination did not differ substantially from the other groups.
In Paper V, 13 subjects, six males and seven females, aged 19 to 20 years, were strategically selected from the sample in Paper IV. The selection was based on gender, family origin (native born or immigrant) and persisting poor dental aesthetics. With respect to origin, both the parents of seven subjects were Swedish born and the parents of the remaining six had both been born in either Asia or Former Yugoslavia. The following
inclusion criteria were applied: persisting poor dental aesthetics, defined as overjet ≥6mm, overjet <-1 mm or contact point displacement >4mm or contact point displacement 2-4 mm in combination with strained lip closure.
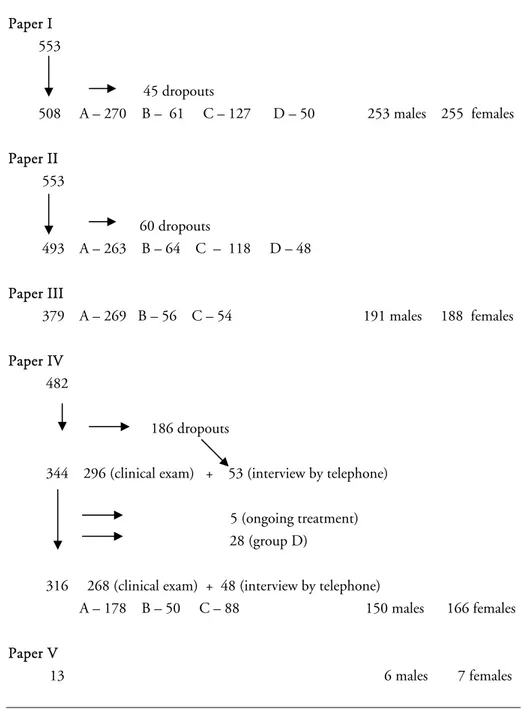
Thus in the different studies (I-V), the number of subjects varied from 13 to 508. The distribution of subjects according to geographic origin, gender and attrition is presented in Figure 3.
Ethical considerations and informed consent
The research design of all five studies was approved by the Research Ethics Committee, Faculty of Health Sciences, Linköping University, Sweden (Dnr 01-020, M5-07, T118-07). The requirements with respect to informed consent and confidentiality were fulfilled.
For subjects aged 12 or 13 (papers I-III), an informed consent form was sent to parents, to be signed before the initial examination. Before the second examination (Paper IV), an informed consent form was sent to students, to be signed before the examination. In Paper V, an informed consent form was signed by the young adult before the interview started.
Paper I 553 45 dropouts 508 A – 270 B – 61 C – 127 D – 50 253 males 255 females Paper II 553 60 dropouts 493 A – 263 B – 64 C – 118 D – 48 Paper III 379 A – 269 B – 56 C – 54 191 males 188 females Paper IV 482 186 dropouts
344 296 (clinical exam) + 53 (interview by telephone) 5 (ongoing treatment) 28 (group D)
316 268 (clinical exam) + 48 (interview by telephone)
A – 178 B – 50 C – 88 150 males 166 females Paper V
13 6 males 7 females
Figure 3. Distribution of number of subjects according to gender and geographic origin in the separate studies.
Methods
Paper I
A questionnaire study was conducted. The questionnaires were answered in the classroom by the subjects attending school that day.
The responses to the questions were designed as a mix of fixed statements, multiple choice, free answers and five-point scales, (Appendix, Table B). The questionnaire comprised seven domains:
Demographic data: This domain contained 4 questions (1-4), about sex, place of birth and parents’ geographic background. The responses were designed as fixed statements and free answers.
Experience of orthodontic treatment: The responses to these two questions (5-6) were fixed statements, giving information about any previous orthodontic treatment.
Satisfaction with own teeth: The response to Question 7 was on a 5-point ordinal scale, and to Question 8 on a 5-5-point scale which has previously been used in modified form.69,85
Self perceived treatment need and attitude to orthodontic treatment: This domain contained 3 questions (9-11): one question with a 5-point ordinal scale and two questions with multiple choice responses. Questions 9 and 10 have previously been used in modified form.85
Body esteem and general appearance: This domain contained six questions. The responses were all 5-point ordinal scales, 12 a-e91 and 14. Behavioural pattern: These two questions, 13 a-b, were constructed with 5-point scale responses and have been used previously.85
Psychosocial functioning: The responses to questions about psychosocial functioning (15 a-i) were pooled to an amalgamated index. Summary score 9-45. A low value indicates good psychosocial functioning.92
Reliability
Reliability tests were conducted on 50 randomly selected 12- and 13 year old subjects. They were presented with the same questionnaire after an interval of four weeks. Their initial answers were included in the study.
Only questions with good and very good reliability were retained for inclusion in the final questionnaire.
Paper II
The registrations in this paper included clinical examination, examination of radiographs (panoramic and intraoral) and patient records.
The clinical examination comprised extraoral inspection, including the soft tissues and intraoral inspection of the teeth and classification of occlusion. An assessment was also made according to the dental health (DHC) and aesthetic components (AC) of the Index of Orthodontic Treatment Need (IOTN)27
(Appendix, Table C, D, E). To determine the normative treatment need, several variables were registered (Appendix, Table E). The IOTN-DHC classification was made on completion of all registrations.
The AC was estimated both by the examiner and the subject.
For subjects undergoing treatment with fixed or functional appliances, (n=25 and n=14 respectively), registrations were made on pre-treatment study models. No IOTN-AC classification was made for these subjects. For the 30 subjects who had previously undergone treatment with functional appliances, assessment was based on post-treatment status. With respect to orthodontic treatment with other types of appliances, mainly space-maintainers, lingual arch appliances and expansion-plates, 42 had previously undergone treatment and 22 were currently undergoing treatment. The existing conditions were registered in these subjects, but the soft tissue registrations were excluded in those with ongoing treatment.
Reliability
To test reliability, 25 12-year-olds and 25 13-year-olds, selected at random, were re-examined after an interval of four weeks under the same conditions. Variables with good and very good reliability were retained for inclusion in the final study, and also two variables with moderate reliability (“Rotation” and “IOTN-AC subject”). The variables excluded
were “Short upper lip” and “Midline deviation”. The initial registrations were used in the study.
Paper III
This study was based on parts of the questionnaire and registrations previously used in papers I and II. The questionnaire was an abbreviated, modified version of that used in Paper I (Appendix, Table F). Some clinical variables were recorded to determine the presence of any malocclusion with a potentially detrimental impact on aesthetics (Appendix, Table G).
Radiographs (panoramic and intraoral) and patient records were examined. The subjects were classified according to the Dental Health Component of the Index of Orthodontic Treatment Need
(DHC-IOTN). 27
For subjects currently undergoing orthodontic treatment with fixed or functional appliances, registrations were made on pre-treatment study models and soft tissue registrations were excluded. In subjects who had earlier undergone treatment with functional appliances, assessment was based on post-treatment status. With respect to other appliance therapy, mainly with space maintainers, lingual arch appliances and expansion plates, existing conditions were registered in these subjects.
From the questionnaire, the answer to the question “Do you think that you need a brace today?” was selected as representing individual, self-perceived orthodontic treatment need. The characteristics of the group of subjects with a positive response to this question were compared with those with a negative response, and then tested in relation to the clinical variables, the demographic data, and to the other items in the questionnaire.
The subjects currently undergoing orthodontic treatment with functional or fixed appliances (n=27) were statistically tested in relation to self-perceived treatment need and their opinion of their own teeth in relation to those of their peers, compared with the other subjects (questions 5 and 3, Table F).
Paper IV
This was a follow-up study, comprising a questionnaire and a clinical examination.
Questionnaire study
The questionnaire was in many respects identical with that in Paper I. The responses were designed as a mix of visual analogue scales (VAS), multiple choice, five-point ordinal scales and fixed statements (Appendix, Table H). It comprised the following seven domains:
Demographic data: This domain contained 3 questions (1-3), about sex, place of birth and parents’ geographic origin. The responses were in the form of fixed statements and free answers.
Experience of orthodontic treatment: This question (4), designed with responses in the form of fixed statements, gave information about any earlier treatment with appliances or extractions.
Self-perceived treatment need, attitude to orthodontic treatment: The responses to these questions (10, 5) were multiple choice with 3 fixed statements.85
Satisfaction with, and importance of dental appearance: This domain contained 2 questions (6, 9) designed as a 5-point ordinal scale.85
Question 7 was answered by “yes” or “no”: a “yes” response was further analyzed on a VAS, with the end phrases “disappointed” and “much disappointed”. Question 8 was assessed on a VAS, with the end phrases “unlikely” and “likely”.
Temporomandibular symptoms: These 4 questions (11a-d) were answered “yes” or ”no”.
Body esteem and general appearance: Responses to Questions 12-14 were on a 5-point ordinal scale. Question 1291
has previously been validated and found useful for patients referred for orthognathic surgery.93
Psychological wellbeing: This domain contained 12 questions (15-26) with 4-point scales, which are used by the Swedish National Institute of Public Health (general health questionnaire) and have been validated and described previously.94
The measure of wellbeing is calculated by a summary index of the twelve questions. The first two choices of response
to each question are given a score of zero, and the third and fourth choices are given a score of 1. The summary variable ranges between 0 and 12. A dichotomous variable is constructed. If the summary is lower than 3, the index value is 0. If the summary is 3 or more, the index value is 1. Subjects with an index value of 1 are denoted as having reduced psychological wellbeing.
Clinical examination
The clinical examination was conducted in an orthodontic department. The examination comprised intraoral inspection of the teeth and occlusion and palpation of the temporomandibular joint (TMJ) and muscles (Appendix, Table I).
Reliability and validity
Thirteen subjects, selected at random, answered the questionnaire a second time, after an interval of four weeks. The association between the first and second rounds of responses was calculated. Questions and answers with a correlation of 0.6 to 1.0 were included in the study. Question 9, with moderate reliability, was also included.
The reliability of the clinical examination of occlusion had been tested in an earlier study, Paper II. Variables with good and very good reliability were retained for inclusion in this study. The examiner (EJ) was calibrated with an experienced specialist in stomatognathic physiology with respect to muscle and TMJ palpation and tooth wear.
The validity of the questionnaire was verified by asking the participants if they considered the questions and items to be relevant for describing their perception of their teeth and their general appearance. The domain “Psychological well-being” had been validated previously.94
Paper V
Grounded theory
This investigation had a qualitative approach and was based on classic grounded theory methods.95 Thus, we did not set out with a hypothesis or a theory. Instead, we started with an area of interest: data were
collected and analysed. Sequential analysis and stratification eventually disclosed a number of related problems which could be conceptualized. From this concept, a theory could be developed.
Data collection
An interview in conversational style was conducted with each participant. An interview guide was used. The interviews covered different topics such as family situation, geographic origin, history of any earlier orthodontic consultation and treatment, factors influencing the decision to undergo or not to undergo treatment, consequences of the decision, dental appearance, body image, interpersonal relationships and future aspirations. The interviews were tape-recorded and transcribed by the interviewer. Thus collection and analysis of data were a continuous process (i.e. each interview was analyzed as soon as it had been transcribed), closely related to process of theory-generation.
Data analysis
Each interview was analyzed line-by-line as soon as collected. Initial codes, capturing the meaning of the data, were identified. Codes with similar meaning were clustered to form more comprehensive categories. The categories were then compared and further analyzed by identifying their properties or dimensions, that is, subcategories were formed.
Thus by constantly comparing codes with each other and clustering those of similar meaning into categories, which were also constantly compared for similarities and differences, the data were conceptualized,
i.e. organized into a simplified form. In the analysis, the subjects’
descriptions were gradually raised to a more abstract level, in order to highlight the basic pattern underlying the participants’ collective words. During this process, we also asked questions about the data: What is this all about? How can we define it? What is the main concern? How do the informants manage this concern? The analytical process disclosed a core category, which was central to the data and highlighted the participants’ main concern. The core could be related to all other categories and subcategories. Then theoretical sampling was performed, with the purpose of “saturating” each category with additional information from new or existing data. Saturation implies that new data do not contribute
new information or that new data fit into existing categories. Memos were made during the analytical process. These included pictures, short reflections and assumptions based on the data.
Reliability and validity
The reliability of a qualitative study denotes the quality of the measuring instruments. In this study the reliability was dependent on the quality of the researcher: i.e. the ability to conduct interviews of high quality and objectivity, the ability to follow the information and to be flexible. Reliability is also described as good when the same information repeatedly emerges from the data.
In a qualitative study, validity is often described in terms of credibility and trustworthiness ensured by checking, questioning and theorizing.96 In the present study, the validity was tested during the process of data collection and analysis, that the work was performed in a reliable way. Good validity was declared when quotes from the interviews corresponded well with the categories. Questions were asked continually: what is being investigated and why?
Statistical analysis
Reliability (test- retest correlation)
Reliability (test-retest correlation) for each question in papers I and III was tested by using the weighted Kappa statistic (Cohen’s Kappa, •).97
A Kappa-value of 0.00-0.20 was denoted as slight agreement, 0.21-0.40 fair, 0.41-0.60 moderate, 0.61-0.80 substantial and 0.81-1.00 as almost perfect agreement.98 Inclusion in the study was restricted to questions and variables with Kappa values of 0.61-1.00, with the exception of one variable of moderate reliability in Paper III (the question “Do you avoid smiling because of your teeth?”), with a Kappa value of 0.53).
In Paper IV, the test-retest correlation for questions with both ordinal/nominal scales and questions with continuous scales was calculated by Spearman’s ranking correlation test (correlation coefficient
r).97
Questions and answers with a correlation r > 0.6 were included in the study.
In the clinical examinations in papers II-IV, Kappa statistics were used for intra-observer agreement, and also for the subject and orthodontist AC-scores in Paper II. Variables with continuous scales were transformed to ordinal scales. Variables with Kappa values of 0.61-1.00 were retained for inclusion in the final studies.
Three variables of moderate reliability (Paper II: “Rotation” and “IOTN-AC subject” with Kappa values of 0.55 and 0.54, respectively and Question 9 in Paper IV) were also included. The reason for this was that the information from these variables were assessed as important for the studies. All Kappa scores were supplemented with percentage of agreement.
Descriptive statistics
Descriptive statistics such as median value, mean value, standard deviation and range were used (paper II-IV).
Intergroup differences
The non-parametric method Chi-square test was used to assess differences in distribution between the groups, when categorical variables were tested. When this method showed a difference in distribution or if the method did not fulfill the requirements, the Mann-Whitney-U test or the Kruskal-Wallis method was used (papers I, II, IV). Intergroup differences in responses to question 15 in Paper I were tested by analysis of variance (ANOVA).
In Paper II, the analysis of variance was followed by a post hoc test to disclose details in the differences. For analysis of median and mean values in the different groups the Kruskal-Wallis test was used in Paper II and ANOVA in Paper IV.
In Paper III, the association between “self-perceived treatment need” and the variables was analyzed by logistic regression using the odds ratio and p-value. When more than one dependent variable was tested, multiple regression analyses were used.
The Kruskal-Wallis test was used to compare the median values on VAS scales for the three groups and between sexes (paper IV).
Results
Reliability and validity
In Paper I, tests of the reliability of the answers disclosed variations in Kappa values between 0.63-0.95 and a percentage agreement between 71-95%. When the reliability of the clinical examination and the estimation of IOTN was tested in Paper II, variations in Kappa values between 0.1.0 was disclosed and a percentage agreement between 50-100%. In Paper III, the Kappa values for both the questionnaire and the clinical variables varied between 0.53-1.0. The reliability for the questionnaire in Paper IV, varied with a correlation rs 0.54 – 1.0. The
validity of the questionnaire in Paper IV was tested with two questions. “Do you think that the questions you have answered allow you to express your perception of your teeth?” This question was constructed as a VAS (0-100) and the result showed an overall mean value of 76.3 and a median value of 80. The median value was 77 for boys and 83 for girls, p=0.050 for differences between sexes.
“Do you think the questions you have answered allow you to express your perception of your general appearance”? This question was constructed as a VAS and the result shows an overall mean value of 78.3 and a median value of 80. There was a significant difference between the sexes: the median was 77 for boys and 84 for girls, (p=0.021).
Frequency of malocclusion
There were no significant inter-group differences with respect to frequency of sagittal occlusion, crossbite, scissors bite, RP-IP difference, deep bite with gingival contact, or proclination or retroclination of the maxillary and mandibular incisors at 12-13 years of age (Paper II). With respect to distribution of Class II and Class III malocclusions at 18-19 years of age, there were significant differences between subjects of Swedish and Asian origin: Class II malocclusions were recorded in 21.6 per cent of subjects of Swedish origin and 32.3 per cent of those of Asian
origin (p=0.042). The corresponding values for Class III malocclusions were 3.7 per cent and 10.8 per cent respectively (p=0.016), (Paper IV). No significant differences were disclosed for the variables deep bite with gingival contact, or posterior or anterior crossbite (Paper IV).
At 12 and 13 years of age, the mean value for overjet in groups A and D was 4.3 mm and 3.9 and 3.6 mm in groups B and C, respectively, with a significant difference between subjects of Swedish and Asian origin, p=0.003 (Paper II). In the follow up study (Paper IV), the mean overjet ranged from 3.0 to 3.6 millimeters, with no significant intergroup differences. The mean value for overbite did not differ among the groups (papers II, IV)
Alignment anomalies
Subjects of Swedish origin exhibited a higher number of rotated maxillary incisors than those of Eastern/Southeastern European origin, at the age of 12-13 years. Overall, rotation was more frequent for lateral than for central incisors. Tipping of maxillary central incisors was similar in the four groups, but tipping of maxillary lateral incisors was more frequent in group A than in group B or C (Paper II).
Anterior available space and contact point displacement
In the initial study (Paper II), all groups showed a space deficiency in the anterior segments of both jaws. In group A, lack of space in the maxillary anterior segment was 2.1 mm, which was significantly different from groups B and C (1.2 mm). The difference in anterior available space in the mandible was less pronounced among the groups, but the difference between groups A and B was significant (p=0.046).
At 12-13 years of age, the mean value for contact point displacement in the maxilla was greater in subjects of Swedish origin (2.1 mm) than in those of Eastern European (1.4 mm) and Asian origin (1.6 mm). The contact point displacement in the mandible did not differ significantly among the groups.
At 18-19 years of age, the mean anterior available space varied between -0.1 to 0.1mm in the maxilla and -1.4 to -0.1 mm in the mandible. The differences in contact point displacements were also minor. The mean value for contact point displacement in the maxilla was 1.9 mm in the
subjects of Swedish origin, and 1.7 and 2.1 mm for those of Eastern/Southeastern European and Asian origin, respectively. The mean value for contact point displacement in the mandible varied between 1.8 and 2.0 mm. There were no significant inter-group differences with respect to any of these variables (Paper IV).
Teeth and eruption anomalies
Tooth retention was found in 8.6 per cent in group A, 16.4 per cent in group B, 9.4 per cent in group C and 2.1 per cent in group D, with a significant difference between groups B and D (p<0.05). In the subjects of Eastern/Southeastern European origin, (group B) the frequency of hypodontia was 9.8 per cent. The corresponding values in groups A, C and D were 5.5, 6.0 and 8.5 per cent respectively. The frequency of ectopic eruption was 5.9 per cent for the subjects of Swedish origin, (group A) and 3.3, 3.4 and 2.1 per cent respectively in groups B, C and D (Paper II).
Orthodontic treatment
At the initial examination, when the subjects were 12-13 years of age (Paper II), 46 per cent of all subjects had, at some time during their childhood, had an orthodontic consultation: 15 per cent were currently undergoing orthodontic treatment and 13 per cent had previously undergone treatment, with no significant differences among groups A, B, C and D. There were no inter-group differences with respect to the number of subjects referred to an orthodontist, n= 57, or those currently undergoing treatment, n=61.
At the second examination, (18-19 years of age), 44.4 per cent of all subjects had undergone orthodontic treatment with fixed or removable appliances or orthodontic extraction: 50.6 per cent of Group A, 38.0 per cent of Group B and 35.6 per cent of Group C. The difference between groups A and C was significant (p=0.047). There was no significant difference between the sexes (Paper IV).
Extractions
At the age of 12-13 years, subjects of Swedish origin (A), had the lowest frequency of extracted primary molars before 7.5 years of age, and also the total number of extractions during childhood and adolescence, significantly fewer than for subjects of Eastern/Southeastern European (B) and Asian (C) origin. Compared with groups B and D, the subjects of Asian origin (Group C) had undergone significantly more extractions of primary molars before 7.5 years of age. With respect to extraction of primary canines, there were no inter-group differences.
Although the overall number of extracted permanent molars was very low, the frequency of extraction of first permanent molars was higher in subjects of immigrant background than those of Swedish background, p=0.040.
A positive correlation was found between extraction of any primary molar before 7.5 years of age and retention of the permanent successor (p=0.016). The correlation was even stronger for early extraction of two or more primary molars (p=0.002).
Index of Orthodontic Treatment Need
According to the Dental Health Component of the Index of Orthodontic Treatment Need (IOTN-DHC), in 37.0 per cent of all subjects, a “real treatment need”, (grades 4 and 5) was registered; 35.5 per cent had “little or no treatment need” (grades 1 and 2), while “borderline need” (grade 3) was registered in 27.5 per cent. There were no significant inter-group differences.
The orthodontist’s assessment of the Aesthetic Component of the Index of Orthodontic Treatment Need (IOTN-AC) showed no significant inter-group differences (p=0.084). However, the mean value of the orthodontist’s assessment was significantly higher than the subject’s self-assessment (p=0.000) in all four groups. The self-assessed treatment need (IOTN-AC) was highest in group A and differed significantly from groups B (p=0.027) and C (p=0.000) (Paper II).
Self-perceived orthodontic treatment need and attitude to
orthodontic treatment
At the age of 12-13 years, twenty per cent of the subjects considered that they needed orthodontic treatment, more girls than boys (p=0.012), but in groups C and D, self-perceived treatment need was greater among boys than girls. The inter-group differences were statistically significant (p=0.001) (Table 1).
girls boys p girls + boys
A+B+C+D 23 17 * 20
A 31 17 24
B 15 9 ** 12
C 15 22 18
D 9 19 14
A - Sweden, B – Eastern/Southeastern Europe, C- Asia, D - other * - p<0.05, ** - p<0.01
Table 1. Self-perceived orthodontic treatment need in groups A-D (12-13 years old) according to gender (%).
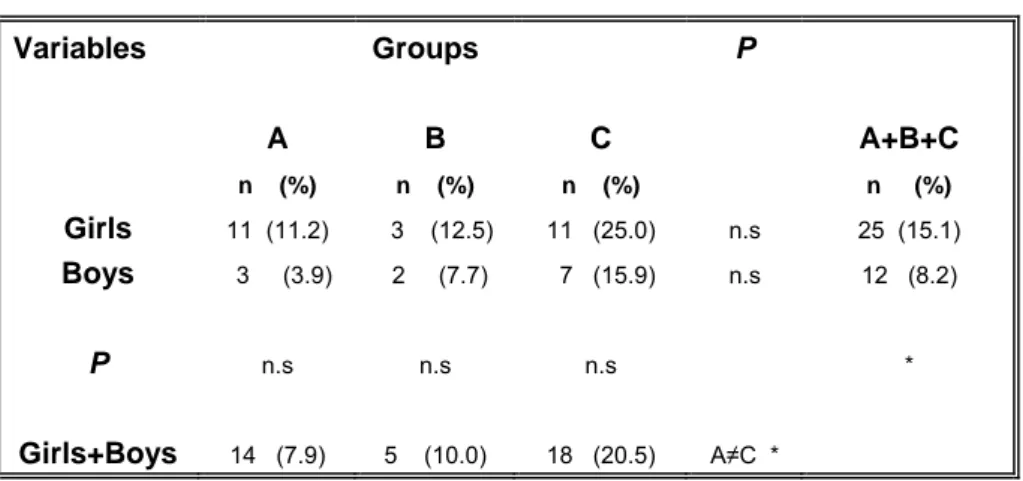
At the age of 18-19 years, the self-perceived need for treatment was 11.8 per cent for all subjects: 7.9 per cent in group A, 10.0 per cent in group B and 20.5 per cent in group C, with a significant difference between groups A and C (p= 0.016) and between girls and boys (p=0.050) (Table 2).
Variables Groups P A B C A+B+C n (%) n (%) n (%) n (%) Girls 11 (11.2) 3 (12.5) 11 (25.0) n.s 25 (15.1) Boys 3 (3.9) 2 (7.7) 7 (15.9) n.s 12 (8.2) P n.s n.s n.s * Girls+Boys 14 (7.9) 5 (10.0) 18 (20.5) A≠C *
A – Sweden B – Eastern/Southeastern Europe C – Asia. n.s non significant * p<0.05
Table 2. Self-perceived orthodontic treatment need in groups A-C (18-19 years old), related to origin group and gender (%).
Approximately 66 per cent of the 12-13 year old participants subjects answered that they would be prepared to undergo two years of fixed appliance therapy if it was recommended by the dentist: 72 per cent in group A, 63 per cent in group B, 54 per cent in group C and 61 per cent in group D. There was no significant gender difference with respect to willingness to undergo treatment.
To the question “Do you believe that orthodontic treatment with fixed appliances is painful?”, half the subjects answered “Yes, somewhat” or “Yes, very”. More girls than boys were concerned about treatment-related pain (p=0.003). The highest percentage was found among the Eastern/Southeastern European girls, 68 per cent, in comparison with the other groups, (p=0.008).
At the age of 18-19 years, 37.9 per cent of the girls and 24.1 per cent of the boys who had not previously received treatment with fixed appliances would have accepted such treatment if offered today: 23.2 per cent in Group A, 35.7 per cent in Group B and 46.5 per cent in Group C. The difference between groups A and C was significant (p=0.022) (Paper IV).
Satisfaction with own teeth
At the initial examination, nineteen per cent of the 12-13 year olds perceived their teeth to be worse than those of their peers. The subjects of Swedish background were least satisfied with their teeth and subjects of Eastern/Southeastern European background were the most satisfied. With respect to gender and origin, girls of Swedish origin were the most dissatisfied (Paper I).
At 18-19 years of age, eighteen per cent (17.9) of all subjects thought that the appearance of their teeth was worse or much worse than that of their peers. There were no significant differences among the groups or between girls and boys (Paper IV).
In total 1 per cent of the 12-13 years olds reported being teased every week or every day and 10 per cent reported that at some time they had been teased about their teeth (Paper I).
The self-perceived attitudes to the four variables “tooth colour”, “irregular teeth”, “increased overjet” and “spaced teeth” were examined at the age of 18-19 years. “Tooth colour” was the variable that caused most dissatisfaction (38.5%), significantly more in girls than boys (p=0.020). However, there were no significant intergroup differences.
Thirty-four per cent (34.4) were dissatisfied with their irregular teeth, 25.0 per cent with their large overjet and 18.1 per cent with their spaced teeth. There were no significant differences between the sexes or among groups A, B and C in the responses to any of these questions (Paper IV). In a VAS analysis, more boys of Eastern/Southeastern European origin believed that straightened teeth would improve career prospects: median value 50, compared to 22 for the boys of Swedish origin and 45 for the boys of Asian origin. The difference between boys of Swedish and Eastern/Southeastern European origin was significant (p=0.030). No difference was found between boys and girls.
Sixty-three per cent (200) of the subjects considered their teeth to be important or very important for self-esteem. The difference between girls and boys (72.5 and 53.0 per cent respectively) was significant (p=0.002). However, there were no significant intergroup differences (Paper IV).
General appearance
At the age of 12-13 years, more subjects from groups A and D considered their own appearance to be generally less attractive than that of their peers, 9 per cent and 12 per cent respectively. The subjects of Asian origin were least dissatisfied, 6 per cent (p=0.012). None of the girls of Eastern/Southeastern European origin (group B), was dissatisfied (Paper I).
The corresponding values at the age of 18-19 years were: 11.9 per cent in Group A, 8.0 per cent in Group B and 5.7 per cent in Group C. The subjects in group A were significantly more dissatisfied with their general appearance than the subjects of Asian origin, Group C (p=0.010).
In the 12-13 year olds, dissatisfaction with facial appearance was significantly higher in girls than in boys, (p=0.002). At the age of 18-19 years, 7.4 per cent of the subjects of Swedish origin were dissatisfied, compared with 0.0 and 1.6 per cent respectively among those of Eastern/Southeastern European and Asian origin (p=0.05). There was no difference between the sexes. Satisfaction with overall facial features compared to overall physical appearance was higher: 80.0 per cent were satisfied or very satisfied with their facial appearance, while only 68.7 per cent expressed satisfaction with their overall physical appearance.
With respect to satisfaction with the appearance of hair, ears, eyes, nose, cheeks, lips and mouth, there were no inter-group differences or sex differences (Paper IV).
At the age of 12-13 years old, girls were significantly more dissatisfied with their body height (p=0.009) and weight (p=0.005) than boys. The subjects of Asian background (group C), were the most dissatisfied with their height and weight.
In the follow up study (Paper IV), girls were significantly more dissatisfied with their height than boys, 14.5 % compared to 4.1 % (p=0.003). There was significantly greater dissatisfaction among boys of Asian origin (12.5 per cent) than those of Eastern/Southeastern European
(0.0 per cent) and Swedish origin (1.4 per cent), p=0.015. More girls than boys were dissatisfied with their weight: 30.8 and 13.1 per cent respectively, p<0.000.
The girls were more dissatisfied with their chin compared to the boys, (11.6 and 2.5 per cent respectively), p=0.040. There were no inter-group differences.
The girls in group A (16.1 per cent) were, with respect to overall physical appearance, significantly more dissatisfied than the boys in group A (2.9 per cent), p=0.004. There were no significant sex differences in groups B and C, but the overall sex difference (girls 15.8 and boys 5.7 per cent) was significant, p=0.004.
Eighty-five per cent of the girls and 77.1 per cent of the boys considered the general physical appearance to be important or very important for the self-esteem. The gender difference was not significant, nor were the inter-group differences significant (Paper IV).
Association between self-perceived orthodontic treatment
need and malocclusion (Paper III)
Of 373 subjects, 22.3% (26.5% females, 18.1% males) answered “Yes” to the question “Do you think that you need a brace today” and 55.5% (48.6% females, 62.2% males) answered “No”. Twenty-two per cent were uncertain.
There was a significant association between the response to the above question and the presence of overjet, with positive responses from 49 per cent of subjects with an overjet > 6 mm and 16 per cent with an overjet of 1-6 mm.
Subjects with an anterior crossbite of one or more teeth answered “yes” significantly more often to the question, (60 per cent), compared with those without an anterior crossbite (17 per cent) (P=0.000 OR=7.0). Maxillary contact point displacement > 4 mm and strained lip closure were strongly associated with a self-perceived need for orthodontic treatment (P=0.000 and P=0.005, respectively).
Subjects with IOTN-DHC grades 4 and 5 differed significantly from those with grades 1 and 2: 44 and 7 per cent, respectively (P=0.000, OR=13.0).
Among subjects of Middle Eastern origin, none of the occlusal anomalies influenced the perceived “need for braces”. In the Eastern/Southeastern European subjects, a positive response to the specific question was
significantly correlated with an overjet > 6 mm, maxillary contact point displacement > 2-4 mm and IOTN-DHC grades 4 and 5. In the Swedish group (Group A), a significantly higher proportion of positive responses to the specific question was recorded in girls than in boys, (P=0.002), in students with an overbite <5 mm (P=0.010), anterior crossbite (P =0.000), maxillary contact point displacement >4 mm (P=0.000) and >2 mm in the mandible (P= 0.015), strained lip closure (P=0.012) and IOTN-DHC grades 4 and 5 (P=0.000).
Subjects in groups A and C who thought that they needed an orthodontic appliance also thought that the appearance of their teeth was somewhat worse or much worse than that of their peers (P= 0.000 and
P=0.005, respectively). There was also a positive association between
subjects of Swedish origin who thought they needed an orthodontic appliance and avoided smiling because of their teeth (P=0.000). No association was found in any of the groups between general appearance and the need for braces.
The most important factors explaining a positive response to the question “Do you think that you need a brace today” were the morphological variables IOTN-DHC grades 4 and 5 and anterior crossbite, (P=0.000 and P=0.021) (OR=7.7 and OR=3.5). Of the subjective variables, the one most closely associated with a perceived need for an orthodontic appliance was “My teeth look somewhat worse or much worse than those of my peers”, P=0.000 (OR=26.8).
A positive response to the question “Do you avoid smiling because of your teeth ?” was recorded in 34 per cent in group A, 9 per cent in group B, and 31 per cent in group C. The most important factors explaining a positive response to this question were the morphological variables contact point displacement 2-4 mm in both the maxilla (P =0.013, OR=2.3) and the mandible, (P=0.027, OR=2.1), and for the subjective variable “My teeth look worse or much worse than those of my peers” (P=0.000, OR=8.8).
Of all subjects with IOTN-DHC grades 4 and 5, 74.5 per cent (n=104) were allocated to these grades on the basis of the occlusal variables overjet >6 mm (n=55), maxillary contact point displacement >4 mm (n=43) or anterior crossbite (n=34). Of all subjects with a positive response to the
question “Do you think that you need braces today?”, 73.4 per cent showed IOTN-DHC grades 4 and 5 (Paper III).
Temporomandibular symptoms and signs (Paper IV)
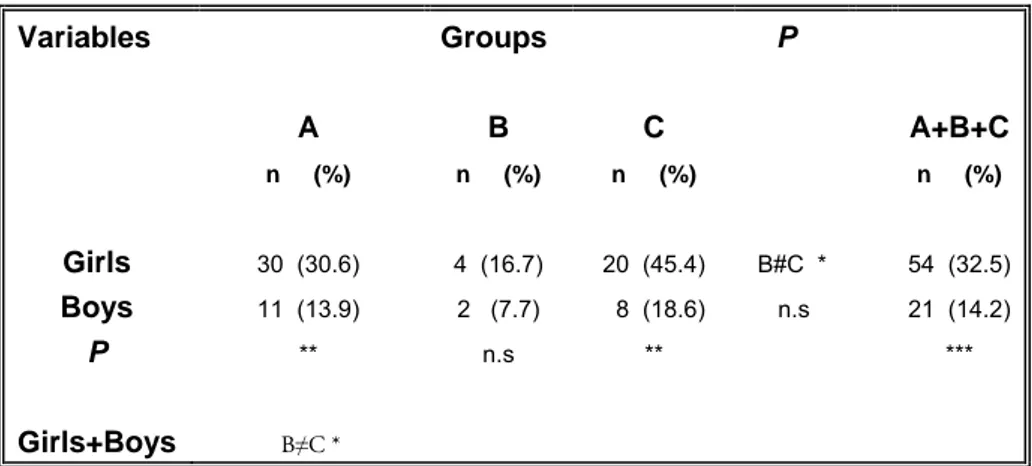
Twenty-five per cent of all subjects, at 18-19 years of age, 32.5 per cent of the girls and 14.2 per cent of the boys, suffered from headaches at least once a week (p=0.000) (Table 3).
The distribution of weekly headaches in relation to geographic origin and gender is shown in Table 3. The highest frequency was noted in the girls of Asian origin. The difference between groups B and C was statistically significant (p=0.019). Variables Groups P A B C A+B+C n (%) n (%) n (%) n (%) Girls 30 (30.6) 4 (16.7) 20 (45.4) B#C * 54 (32.5) Boys 11 (13.9) 2 (7.7) 8 (18.6) n.s 21 (14.2) P ** n.s ** *** Girls+Boys B≠C *
A- Sweden, B – Eastern/Southeastern Europe, C – Asia. n.s – non significant, * - p<0.05, ** - p<0.01, *** - <0.001
Table 3. Distribution of positive responses to the question “Do you suffer from headaches at least once a week?”, in relation to origin group and gender in 18-19 year old subjects.