J
Ö N K Ö P I N GI
N T E R N A T I O N A LB
U S I N E S SS
C H O O L Jönköping UniversityT h e o p e n s o u r c e s o ft w a r e
a l t e r n a t i v e
Factors and their impact on the decision-making process at Swedish
munici-palities
Master’s thesis within Informatics
Author: Andersson, Henrik
Karlsson, Tobias
Tutor: Johansson, Britt-Marie Jönköping June 2005
Master’s Thesis within Informatics
Title: The open source software alternative – Factors and their impact on the decision-making process at Swedish municipalities
Author: Henrik Andersson and Tobias Karlsson
Tutor: Britt-Marie Johansson
Date: 2005-06-01
Subject terms: Open source software, OSS, proprietary software, municipality, decision-making process, IT manager, GNU/GPL, software license
Abstract
Arguably, the Schumpeterian ideology of “creative destruction” saying that eventually even the most secure monopoly will be destroyed by a new technology, a new idea, or a shift in tastes could be applied to open source software. Currently, the proprie-tary software holds a strong position in the software market. Nevertheless, one could see a surge in articles and acceptance among organisations concerning open source software.
Proprietary software companies like Microsoft are still gaining ground within the Swedish municipalities. Although one get the impression that municipalities generally are positive toward open source software, the decision-making process often results in choosing a proprietary software alternative. However, one could question which are the underlying factors and to what extent are these factors affecting the decision-making process of municipalities integrating or migrating into open source software? In order to study this phenomenon, we chose a quantitative approach using a ques-tionnaire as the tool for data gathering. The sample consisted of 100 randomly se-lected municipalities. A pre study was made through an interview in order to strengthen the accuracy of the questionnaire which later on was sent out to the IT manager at each municipality in the sample.
The organisational-, environmental-, user- and system level are four main factors af-fecting the decision-making process concerning open source software. Among these, the organisational factor was the only one which had a significant negative impact on the decision-making process concerning open source software. The importance of being able to integrate different software increases the need for compatibility which, according to the IT managers, is facilitated using a standardized software environ-ment offered by for example Microsoft.
Table of Contents
1
Introduction... 1
1.1 Background ... 1 1.2 Problem... 2 1.3 Purpose... 4 1.4 Perspective ... 4 1.5 Definitions ... 4 1.6 Interested parties... 52
Frame of references ... 6
2.1 Pinpointing the concept of open source ... 6
2.2 Proprietary Software vs. Open Source Software ... 7
2.2.1 Microsoft End User License Agreement ... 7
2.2.2 General Public License... 7
2.2.3 Berkeley Software Distribution... 8
2.3 Classification of open source software factors ... 8
2.3.1 Organisational Level ... 9
2.3.2 Environmental Level ... 9
2.3.3 User level... 11
2.3.4 System level ... 12
2.4 Discussion of the frame of reference... 14
2.5 Proposal for aspects to measure... 15
3
Methodology ... 17
3.1 Research design ... 17
3.2 Choice of research approach ... 17
3.2.1 Survey ... 18
3.2.2 Sampling... 19
3.2.3 Qualitative supporting quantitative... 20
3.3 Data gathering procedure... 21
3.4 Trustworthiness ... 22
4
Pre study ... 24
4.1 Interview... 24
5
Collected data and statistical analysis ... 27
5.1 Results from the survey... 27
5.1.1 Organisational level ... 28 5.1.2 Environmental level ... 29 5.1.3 User level... 30 5.1.4 System level ... 31 5.2 Comments... 32
6
Analysis ... 33
6.1 Organisational level... 33 6.2 Environmental level ... 34 6.3 User level ... 35 6.4 System level ... 367
Conclusions ... 38
8
Final discussion ... 40
8.1 Reflections ... 40
8.1.1 Suggestions for further research... 40
8.2 Acknowledgments ... 41
Figures
Figure 2-1 Technology Acceptance Model (TAM), (Davis, 1989)... 11
Figure 2-2 Cause-effect diagram. Fuggetta, 2003... 13
Figure 2-3 Research model... 15
Figure 4-1 Overview of the system interaction at a municipality... 25
Figure 4-2 Service Oriented Architecture (SOA) ... 26
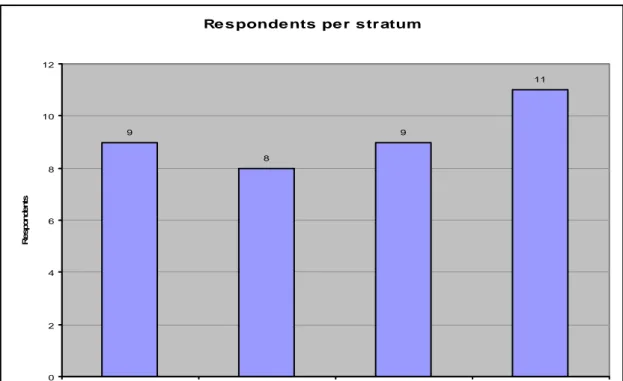
Figure 5-1 Respondents per stratum... 27
Figure 7-1 Research model with mean values ... 39
Tables
Table 3-1 Stratified sample ... 20Table 5-1 Organisational level... 29
Table 5-2 Environmental level... 30
Table 5-3 User level ... 30
Table 5-4 System level... 31
Appendix
Appendix 1 ... 44 Appendix 2 ... 46 Appendix 3 ... 49 Appendix 4 ... 50 Appendix 5 ... 53 Appendix 6 ... 541 Introduction
The introduction chapter will help the reader to get to know the subject better and understand how it fits into its broader context. The problem and purpose will then be used for narrowing the subject and directing the focus towards the particular phenomenon that will be discussed throughout this thesis.
1.1 Background
Following IBM’s unbundling decision in 1969 to separate the operating system software from the hardware, Välimäki and Oksanen (2005), stress the emergence of a software product market. Throughout the years, different operating system platforms have emerged but also vanished. Moreover, Välimäki and Oksanen argue that Microsoft and its MS-DOS, which later became the Microsoft Windows, early on became the de facto standard for op-erating systems and have also played a major role in shaping the software business of today in terms of business models, licences agreements etc. The dominant position of Microsoft can however be questioned based on if you are talking about server operating systems or desktop operating systems. Bitzer (2005) claims that WindowsNT possessed a market share of 41.9 percent (in 2003) in the server operating system sector while the Linux platform (Appendix 1) has a 38 percent market share at the same time. If one, on the other hand, fo-cuses on operating systems for the desktop environment, Välimäki and Oksanen (2005) claim that Windows possess a 95-98 percent market share while Linux only have 0.2-0.4 percent. Although the accuracy of these two investigations may be questioned since they are not using the same sample sizes, it is still interesting to see the fundamental differences in terms of market shares between these two technologies when it comes to the degree of successfulness in penetrating different markets.
Organisations have traditionally relied on commercial software products to support their operations (Goode, 2004). Alternatives to the “traditional” view on software development and distribution have however existed for decades. Richard M Stallman founded the Free Software Foundation (FSF) 1984, which were supposed to encourage the development of free software. Nevertheless, it was not until Linus Torvalds, then a 21- year old student from the University of Helsinki, made his first Linux operating system available on the Internet in the early 90s that the open source movement got publicly known. Linux became the kernel of the open source operating system project that was started by the FSF in 1984. His decision to make it publicly available for free although he could have sold it, created the emergence of a new philosophy concerning software ownership and development. It has been argued that, perhaps Torvalds greatest contribution was not creating Linux but giving it away for free. This decision has raised questions such as why giving away software for free when you could charge money for it? Further, West and Dedrick (2001), question the concept if software really can be owned?
In the past few years, open source software (OSS, Appendix 1) has, according to Fuggetta (2003), become one of the most discussed topics among software users and practitioners. Furthermore, Fuggetta argues that the increased interest in OSS could be motivated by at least three factors: the success of products such as Linux and Apache, which are gaining creasing market shares; the uneasiness about the Microsoft monopoly in the software in-dustry; and, finally, the increasingly strong opinion that the “traditional” approach to soft-ware development are failing to provide a satisfactory answer to the increasing demand for effective and reliable software applications.
A traditional example of a proprietary licence model when it comes to ownership of soft-ware is the Microsoft End User License Agreement (MS EULA). This approach offers only the right to use the software, not to copy, distribute or modify it. While Edwards (2005) ar-gues that the proprietary licensing agreement could be seen as situated on one of the ex-tremes of a spectrum, the General Public License (GPL) is then on the other side of that spectrum, stating that software should be free and not something that you can own. In the middle there is e.g. the Berkeley Software Distribution (BSD) licence which could be viewed as something in between. These specific approaches outline different ways on how to handle license agreements between developers of software and their intended customers. Since developing complex applications requires extensive resources, it could be difficult to see how firms could make money based on giving away their software for free. On the other hand, if you purchase a software package, then should you not be able to do what you want with it? The software industry is different from many other industries in the sense that often you do not really own what you purchase, but you are allowed to use it. If you would have owned it, then you would be able to do whatever you want with it, such as hav-ing access- and behav-ing able to modify the source code. This discussion originates in intellec-tual property law which has previously justified software corporations in their way of “pro-tecting” what they perceive as theirs. The development of OSS however presents an alter-native business model which questions the former and, argued by some, will revolutionize the software industry forever (Välimäki & Oksanen, 2005; Lerner & Tirole, 2001).
1.2 Problem
Organisations, according to Goode (2004), perceive value in their hardware and software and are therefore prepared to invest substantial amounts in IT acquisitions and mainte-nance in order to stay efficient and effective. Moreover, Goode argues that the commercial software model recently has come under threat in two ways. First, acquisition and mainte-nance costs could be significant, e.g. licenses, updates etc. Second, adopters have encoun-tered increasing difficulties in quantifying the benefits of IT acquisitions. If companies are unable to quantify the benefits, Goode (2004) argues that they must be unable to justify the costs for any software.
Perhaps, it is the Schumpeterian ideology of “creative destruction”, developed by Schum-peter (1934) and reproduced by Bitzer (2005), saying that eventually even the most secure monopoly will be destroyed by a new technology, a new idea, or a shift in tastes. Arguably, the OSS movement, with its new technology and innovative way of looking at software ownership and software development could be seen as a challenge to the traditional actors within the software market. At this point of time, the proprietary developed software model constitutes a monopoly, or at least is in an oligopoly position, acknowledging the re-cent penetration of open source developed software. However, could it be the case that open source creates a “crack in the armour” of the proprietary model resulting in a course of events which leads to the “creative destruction”, presented by Schumpeter (1934)? Although one could see a surge in articles presented in scientific journals, magazines etc., in recent years concerning open source, it is still a new area of research and the development moves in a striking speed which means that there is an extensive amount of open source subjects yet unexplored. Subjects that have been explored within the open source area are mainly of a juridical or technological character. Thus focusing on advantages and disadvan-tages of the open source developing model, security and privacy limitations and opportuni-ties of OSS, or in what ways OSS differs from the proprietary model in terms of licensing, ownership, etc. There is however a certain amount of research guided by business related
aspects of OSS as well. Goode (2004), for example, outlines different management barriers when it comes to the adoption of OSS. Although, management barriers concerns technol-ogy acceptance and factors for evaluating OSS, we found no research specifically covering this area. Moreover, an extensive amount of research on technology acceptance have been published, e.g. by Davis (1989) who developed a model explaining the acceptance of new technologies. These studies are important when trying to understand the acceptance of new technology adoption. However, there is a lack of research made concerning factors that af-fect the evaluation and justification process of OSS and how technology acceptance theory could be used to explain this phenomenon.
Two camps have been established: those who advocate the possibilities of introducing OSS into companies and those who do not. Dahlgren (2005) argues that traditional software de-velopers clearly sees a risk with the recent popularity of OSS and argues that it could never replace the proprietary model since it is not as solid and does not offer the same degree of documentation and maintenance. The other camp, however, argues that OSS can drasti-cally reduce the IT cost in terms of licenses etc., and offers an increased degree of freedom since you are allowed to change the source code and distribute it to others. Clearly it is hard to predict which camp that offers the most reasonable arguments since their entire exis-tence affects their arguments. Still, as mentioned by Olsson (2005), it is better to have an open mind and study the possibilities of using OSS such as Linux, MySQL and Apache. Consequently, it is wrong to invest in OSS without understanding the drawbacks of this technology.
Not long ago the dissatisfaction with Microsoft’s expensive license upgrades was a hot is-sue, especially within municipalities. OSS alternatives were discussed as a possible alterna-tive and were on equality with commercial proprietary products. The saving potentials were however considered to be significant. The common opinion is that OSS is satisfactory and cheap; nevertheless the municipalities are not willing to migrate into OSS. Some of the rea-sons that are mentioned are: high costs for education, insufficient competence on the soft-ware, and the striving for homogeneity (Berg, 2005). These reasons might to some extent have emerged from insufficient investigations. It might also be because of convenience rea-sons; no one will hang the decision-maker for choosing Microsoft since it is a well known actor on the software market and already used in many organisation. Moreover, a common notion might be that if everyone else is using Microsoft products, then we must use it to. It is possible to question the degree of objectivity, which should be an important part of the foundation when making decisions regarding software alternatives. The common ap-prehension at municipalities is that open source is a good and cheap alternative but carries high costs in terms of education and lack of competence (Berg, 2005). One easily gets the impression that choosing Microsoft could be a convenience decision in the sense that it is a well accepted and widely used alternative which means that it is easy to justify and probably could be seen as a “safe” choice. Thus one could argue that, based on the discussion above, there is a need to study relevant factors in order to evaluate and justify the possibility to migrate or integrate into using OSS.
Based on the problem discussion above, we formulate the following research questions: • Which factors have an impact on the outcome of deciding if to migrate or integrate
into open source software at municipalities?
• To what extent are these factors affecting the Swedish municipalities when it comes to deciding if to migrate or integrate into open source software?
1.3 Purpose
The purpose of this thesis is to identify factors and their impact on the decision-making process when it comes to Swedish municipalities migrating or integrating into using open source software.
1.4 Perspective
Investigating enablers for evaluating and justifying a migration or integration into open source developed software; one could argue the phenomenon could be viewed from differ-ent perspectives. We have come up with four alternative perspectives, but acknowledge the possibility that other perspective most certainly do exist:
• The IT managers’ perspective and what he or she perceives as the most relevant factors for evaluating a potential migration or integration to open source developed software.
• The IT managers’ perspective within a municipality and what he or she perceives as the most important factors when evaluating a potential migration or integration to open source developed software.
• The end users’ perspective meaning what they think is the most important factors when evaluating the possibility of starting to use open source developed software. • The software developers’ perspective and what they believe are the most important
factors for the customer to take into consideration when evaluating the possibility of a migration or integration into open source developed software.
The first two mentioned perspectives could at a quick glance seem almost identical. How-ever, one could argue that substantial differences do exist between these alternatives. This may justify separating them into two specific perspectives. By IT manager, we are referring to e.g. a Chief Information Officer, or someone who are responsible for IT investments. The main difference between an IT managers in a company compared to a municipality in terms of perspective is that their business drivers differs. While firms are profit driven, municipalities’ major concern regards stability, cost efficiency and what is best for the dis-trict in which they operate. Furthermore, one could argue that these differences could af-fect how one are viewing the two different perspectives. Throughout this thesis, our sole focus will be on IT managers’ perspective within municipalities. This means that the other suggested perspectives are only used with the intention of showing that other perspectives do exist and that they differ from the one we intend to focus on.
1.5 Definitions
The open source subject constitutes a territory with a number of abbreviations and techni-cal expressions. Therefore, one could argue for a description of important words related to the subject early in the thesis in order to simplify the understand ability and decrease the possibility for misunderstandings. The definitions are derived from scientific journals but formulated by us. Thus, the definitions may not be scientific; they are however adequate in understanding how the terms are used within this thesis. Since the list of definitions consti-tutes a rather long list, we have chosen to put it in Appendix 1.
1.6
Interested parties
Since our empirical study concerns municipalities, this is the most obvious group of inter-ested parties. IT departments within municipalities need to be able to justify their software investments, e.g. choosing between an open source application and a proprietary software alternative.
Knowing which factors that play a major role for municipalities when evaluating their pur-chasing needs in terms of software could also be of interest for software developers. This could, for example, help guiding the OSS developers to more accurately emphasise on as-pects that are of interest for municipalities.
One could argue that several target groups could have an interest of a model illustrating the use of OSS within an organisation and which factor that needs to be taken into considera-tion. Developing a generic model could have been an alternative. Though, it would proba-bly be problematic since creating a generic model applicable to all kinds of organisations and authorities is almost impossible, as the business structure, demands and needs are dif-ferent.
2
Frame of references
The frame of references is divided into two sections. The former section (2.1-2.2) introduces the subject and illustrates how open source differs from traditionally “proprietary” software products. This part is an intro-duction to the specific topic in order to create a theoretical foundation. The latter section (2.3) is more pre-cisely directed towards our study. Here, four main areas have been identified as means for studying open source software at municipalities.
2.1
Pinpointing the concept of open source
The Open Source Initiative (OSI), which is an organisation dedicated to managing and promoting the open source definition, presents the following definition of open source:
“Open source promotes software reliability and quality by supporting independent peer review and rapid evo-lution of source code “
(OSI, 2005-04-13)
The definition presented by the Open Source Initiative is of the abstract kind. This is probably intentional since a broader definition is easier to fit with different kinds of OSS alternatives. However, if one is interested in a precise definition, covering every aspect of the subject, one runs the risk of loosing the meaning of the definition and going too deep into technicalities. Dixon (2004), on the other hand, succeeds in presenting a definition that we believe is neither too detailed nor too abstract.
“Open source software is offered to users with open access to the source code and the end users should be freely able to modify, copy, or redistribute the software they have legally acquired”.
(Dixon, 2004, chapter1, paragraph 3)
This is the definition that will be used throughout this thesis since it is considered by us to be on the accurate abstraction level and clearly pinpoints what open source stands for. However, if one is interested in the full (long version) definition of the term open source, presented by the OSI, it is available in Appendix 2.
The debate about the definition of open source is considerable. There are, according to Fuggetta (2003) and Dixon (2004) two different interpretations that are currently used: “free software” and open source software. Further, Fuggetta (2003) argues that the differ-ences between these two concepts are minimal. We will, in this thesis, consider the two terms (open source software and free software) as identical but will refer to the subject as OSS. The argument for the term “open source” is that “free software”, according to Fug-getta (2003), makes some people uneasy. The Free Software Foundation argues that you should think of “free software” and OSS as in free speech, not free beer. This means that the terms specify that once you have obtain the software, you are free to modify it, redis-tribute it etc.; still it could cost money to purchase it. In this sense, one could argue that the term OSS gives a more accurate perception of the meaning and what you are allowed to do than the expression “free software”. For example, the term OSS does not give the same as-sociations of that the software necessarily needs to be free to obtain. Instead, the emphasis is on the freedom aspect in terms of that it allows a user to modify the source code, dis-tribute it to others etc.
2.2
Proprietary Software vs. Open Source Software
Our intention with this section is to give the reader an insight into the differences between open source licences and closed source licenses and also to show internal differences be-tween two different types of open source licenses. The Microsoft End User License Agreement (MS EULA) is a proprietary license provided by Microsoft, and the General Public License (GPL), together with the Berkeley Software Distribution (BSD) are two ex-amples of open source licenses.
There are several open source licenses; the OSI has approved 58 different kinds of licenses. The licenses must fulfil the demands of OSI’s Open Source Definition (see Appendix 2), however this thesis will not go further into the definition aspect. The main issues in the definition are free access to the source code and free redistribution.
During the discussion of the licenses, different roles in software development will be brought up. The different roles are the maintainer, who is responsible for releasing new versions of the software and the user-developer which is a user that uses the software and also makes modifications and improvements in the software. Users are people who just use the software and might give feedback, not source feedback, to the maintainer or user-developers of missing or faulty features.
2.2.1 Microsoft End User License Agreement
MS EULA is a contract that gives the license for an end-user the right to use software after approval of the agreement. Edwards (2004) means that software under this form of license is not “open” to the user. The source code is regarded as a trade secret and the software provided to the user as a binary program. Furthermore the owners of the software are only able to use the software on one computer. The MS EULA license states that distribution and copying are strictly forbidden.
Edwards (2004) argues that the communication between maintainer and users are insuffi-cient within the MS EULA agreement since the relation is governed by the market mecha-nism. The maintainer will only implement a missing feature or fix a faulty feature if the cost is lower than the future income generated by the feature.
2.2.2 General Public License
GPL is according to Edwards (2004) far more permissive than the MS EULA. The users are able to copy, modify and distribute the software in almost any way. Though there is a regulation that the form of license can not be changed, another requirement is that modifi-cations, such as added features or fixed defects are sent back to the maintainer of the soft-ware for approval and implementation which result in a new release of the program. Nev-ertheless, a user-developer can choose not to go public with his modifications, but then the modified software can only be for private use.
Development under this type of license, you could say there are three different roles. The maintainer, who is the original releaser, is responsible for new releases of the software. The maintainer gets input in terms of source code, which consists of changed or new features from user-developers. The user-developers get non-source code feedback from users who reports about defects or requests about new features.
Edwards (2004) argues that modifications are mostly derived from maintainers’ and user-developers’ private needs. There is a possible scenario when modifications clash, for exam-ple there might be two user-developers who are working on a new feature without knowl-edge about each other’s work. Suppose that one of the user-developers finishes his modifi-cation and sends the code to the maintainer for approval and implementation. The main-tainer releases a new version of the software including the user-developer’s new feature at the time the other user-developer have finished his modification. This modification is in-compatible with the first user-developer’s modification. The maintainer has two choices, rejection of the last feature or be responsible for an integration of the last modification. This scenario could, according to Edwards (2004), be avoided through coordination, the user-developers could post in a forum what they intend to develop, and perhaps then could even work together.
2.2.3 Berkeley Software Distribution
The BSD license is an open source license which, according to Edwards (2004), gives the user-developer the freedom to do modifications and distribute the software in any way he wants. The difference from the GPL license is that the user-developer can distribute the software as closed source under another license. When the user-developer changes the li-cense type, he becomes the maintainer of the software. The connection with the user-developers is disconnected. Furthermore, the maintainer is able to implement modifica-tions that are implemented in the original software.
The relation between the maintainers and the user-developers becomes spoilt, as it is pos-sible for the user-developers to wait for software to mature and then distribute it as pro-prietary software without any compensation to the maintainer.
Edwards (2004) argues that BSD has lower incentives for user-developers to make and dis-tribute modifications compared to GPL. Although user-developers are sending modifica-tions to the maintainer it might be because of personal interest, the user-developer wants the software to mature with the intention to later release the software as proprietary soft-ware. There is a possibility that this type of license leads to competition between user-developers to be the first one distributing the software as closed source.
2.3
Classification of open source software factors
The classification of literature relevant to this study is divided into four main factors: or-ganisational-, environmental-, user- and system level. This classification builds upon an ear-lier classification made by Goode (2004) in the sense that we use the same four main fac-tors. One could argue that since Goode (2004) studies Australian firms while our study concerns Swedish municipalities, using the same classification would not be appropriate. However, this is not the case since our factors consists of a number of sub factors which differs from the ones presented by Goode (2004). The intention with this classification is to reflect upon different sides of the OSS phenomenon in order to be able to answer our research questions as accurately as possible. Moreover, each sub factor has derived through the literature review in order to establish a theoretical body suitable to this study.
2.3.1 Organisational Level
This section will bring up factors at the organisational level which have an impact on the adoption of a new technology. Chircu and Kauffman (2000) argue that when firms estimate value potential of a technology they have to consider the impact their own organisation and the industry have on a possible IT investment.
Furthermore, Chircu and Kauffman (2000) outline industry- and organisational barriers as factors that limit the value of the IT investment. When evaluating an IT investment in a given industry, a potential value is estimated. The potential value is, according to Chircu and Kaufman (2000), the maximum value a firm or organisation can obtain from an in-vestment in a certain environment. The potential value will never be reached in reality, as it will only reach that value if the implementation is 100 % successful, which is not that likely. During the conversion process the potential value will decrease to a realized value.
2.3.1.1 Industry
The value potential of an IT investment is, according to Chircu and Kauffman (2000), of-ten limited by lack of resources, costs, and path -dependencies of co-specialized assets that are necessary to gain the benefits of the technology. An example could be that existing competences and capabilities constrains the renewal process.
There are certain types of technologies that, according to Chircu and Kauffman (2000), are favoured by a specific industry. In these cases, the favoured technologies are compatible with the pre existing technology while other technologies are not compatible. This could be seen as a barrier that emerges from the industry structure which inhibits the dispersion of new innovative technologies.
Furthermore the standardization of complementary technologies is an issue that might limit the value of a potential technology; an example is that the success of DVD discs is depend-ent on that people have DVD players.
2.3.1.2 Organisation
The same IT investment can lead to different estimated value potential depending on the characteristics of the organisation. Examples of characteristics that might limit the value potential, according to Chircu and Kaufmann (2000), are organisational routines and norms, market and product expertise and human capital. A new IT implementation might lead to ‘sunk costs’ which means that investments done in existing technology and human capital will be lost, which might hinder the adoption in many organisations.
It is important to redesign current business processes around the new IT’s capabilities to maximize the benefits of the implementation. The alignment of business processes and IT can, according to Chircu and Kauffman (2000), create inefficiencies and trade-offs that end up embedded in organisational routines, this might lead to a limitation of the potential value of IT.
2.3.2 Environmental Level
Competition is stated by Thong (1999) as an important factor that affects companies in their business environment. It is generally assumed that adoption of innovations is more likely in a highly competitive environment since the uncertainty is high which increases the need for adoption of innovations. However, one could argue that municipalities act in an
environment where the competition is fairly low, as a consequence there is no need for adopting innovations.
We have chosen to focus on the management when it comes to the environmental level. According to Thong (1999), the characteristic of the management are crucial in the deci-sion-making process in the adoption of IT.
2.3.2.1 Management
The driving force for an IT innovation can, according to Pinsonneault and Kraemer (1993), be personal interest among decision-makers concerning technology. It could be argued that they see an opportunity to promote their interest and strengthen their position in the or-ganisation through the technology.
Thong (1999) argues that the CEO's innovativeness is an important issue for the adoption of IT in small businesses. One could argue that the innovativeness of the decision-makers in municipalities also is an important issue. Thong (1999) brings up two extremes: adaptors and innovators. The adaptor is looking for solutions that have been tried and understood. One could argue that an adaptor is not likely to adopt an OSS alternative. The innovator decision-maker on the other hand is trying to find solutions that change the structure in which the problem is embedded. These solutions have not been tried before and are there-fore risky.
Moreover, Thong (1999) stresses the knowledge of the CEO and its impact on adoption. Many businesses delay adoption of innovations until knowledge barriers to adoption are lowered or circumvented. As lack of knowledge is an adoption barrier it is important to ac-quire the knowledge to overcome it, one could argue that this is a strategic issue in terms of that the responsibility is on the management function. The knowledge will lower the adop-tion barrier and this will lead to greater probability of adopting the innovaadop-tion. Ettlie (1990), (retrieved from Thong, 1999), has found that CEOs with more knowledge of an innovation are significantly more likely to implement an aggressive technology adoption. The lack of knowledge also has impact on decision-makers as they believe that they have no use for a certain technology because they do not have knowledge of the benefits. Thong (1999) argues that if the decision-makers get educated in the subject they might realize that their business could gain improvements and they are more likely to adopt the technology. Goode (2004) has conducted a study of management rejection of OSS. Further, Goode (2004) identified a number of management barriers when it comes to adopting the use of OSS: • Lack of relevance • Lack of support • Minimal or no requirements • Insufficient resources • Commitment to Microsoft
According to Goode (2004), managers are concerned that if no equivalent to commercial software support exists, companies using OSS run the risk of having to support their own software applications using company resources. This is however not entirely true since
companies such as Red Hat Linux and VA Linux do exist, which entirely make money on providing services such as support, installations etc. These companies may however be less well known. Minimal or no requirements means, according to Goode (2004), that manage-ment is unwilling to explore new software models. In this case it could be important to have a technology champion within the function who has the knowledge and is willing to promote the new software models. Insufficient resources could be manifested in the way that one does not want to invest in education and training of using entirely new software environments when the users already are familiar with e.g. the Windows platform. More-over, since Microsoft is such a big player on the software market, Goode (2004), argues that there are actors who feel committed to using their products and therefore reject all other alternatives.
2.3.3 User level
Behavioural elements such as the adoption and acceptance of innovations are important factors when trying to understand the users’ relationship to information technology. The user level consists of factors that influence the usage of information technology. Further, the OSS issue is here related to the wider user acceptance discussion.
2.3.3.1 User acceptance
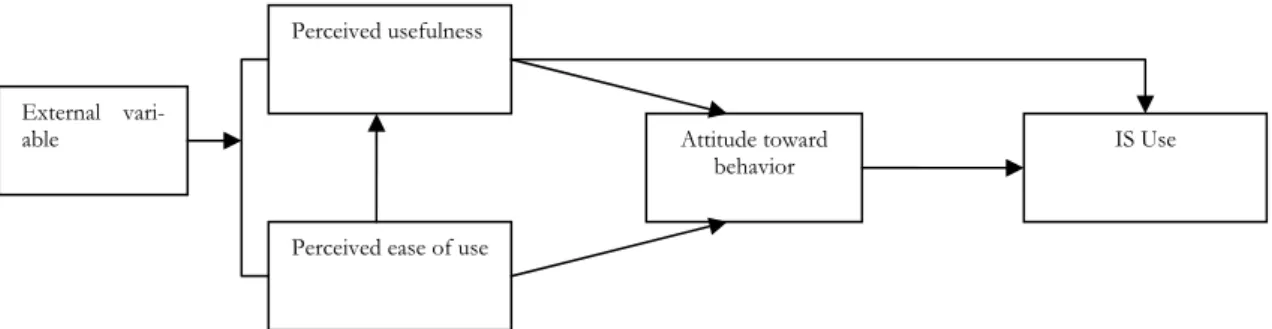
Davis (1989) and Bugozzi and Davis (1992) have developed a technology acceptance model (TAM) in order to describe the acceptance of information technology in performing tasks. TAM has throughout the years received extensive empirical support and has been modified on a number of occasions by e.g. Lai & Li, 2005; Yang & Yoo, 2003; Amoako-Gyampah and Salam, 2003) in order to be applicable to ERP systems, Internet banking etc. The TAM model consists of two important factors that influence the usage of information systems (IS): perceived usefulness (PU) and perceived ease of use (PEU). Davis (1989) de-fines PU as the degree to which a person believes that using a particular system would en-hance his or her job performance. This is related to job effectiveness, productivity and rela-tive importance of the system to one’s job. PEU, on the other hand, refers, according to Davis (1989), to the degree to which a person believes that using a particular system would be free of effort, in terms of physical and mental effort as well as ease of learning. It is, ac-cording to TAM, these two beliefs (PU and PEU) that determine one’s intention to use a particular technology. Furthermore, the TAM model uses behavioural intention such as IS usage and attitude toward certain behaviour as functions of PU and PEU. The TAM model was, according to Davis and Venkatesh (1996), primarily designed to understand the casual chain linking external variables to its user acceptance and actual use in a workplace. Figure 2-1 illustrates the original TAM model, developed by Davis (1989).
Perceived usefulness
Figure 2-1 Technology Acceptance Model (TAM), (Davis, 1989).
Perceived ease of use
Attitude toward
behavior IS Use
External vari-able
Applying the TAM framework to this study, the external variable could be OSS. This vari-able subsequently affects the degree to which users perceive the usefulness and ease of use of OSS. Depending on the outcome of PU and PEU, a certain attitude is formed which in return affect the usage of the specific OSS.
2.3.4 System level
The system level addresses issues such as security and risk, when it comes to OSS, but also in which ways this innovative and distributed development process affects the quality of the software products.
2.3.4.1 Security and risk
The security and risk barrier concerning OSS is an important and widely discussed topic that needs to be analysed further in order to determine its suitability for municipalities. Generally, it is argued that open equals safer according to the Linux community (Hunter, 2004). The argument for this is that the open source approach reduces the threat posed by bugs in the code by exposing it to wide scrutiny, unlike the Windows operating systems where the source code is a commercial secret.
Moreover, Hansen, Köhntopp and Pfitzmann (2002) extend this argument by suggesting that for a wide use of IT systems in information societies there should not only be a feeling of security from the users’ side , but also an actual security claim that is made subject to validation. Hansen et al. (2002), claim that both are true when it comes to open source. Open source enhances software’s transparency since it allows access to the source code which means that, in principle, anyone is able to check an open source software for its specified functionality, or whether it contains any Trojans or other types of infected code. This may be true in theory, but it is questionable to argue that the regular users have the proper knowledge to examine the source code of an OSS in order to determine if it consist of infected code or not. Therefore, it is more likely as suggested by Hanson et al. (2002) that, in many open source projects, bug databases are run, where users can send bug re-ports. As soon as the problem is fixed, the users will be informed. On the contrary, the dis-closure of the source code and the criteria for its design has, according to Hanson et al. (2002), for a long time been considered necessary conditions for security. The concept of “security by obscurity” is however questionable since reverse engineering could still be used to find security holes. The Opensource.Org, for example, states that problems are be-ing found and fixed instead of bebe-ing kept secret until the wrong person discovers them.
2.3.4.2 Quality
Although, OSS is often scrutinised by a large number of people, it could lull people into a false sense of security (Hansen et al., 2002). The intention of the Internet community might not always be obvious. For example, it could be widely left to the chance to what extent a source code is being evaluated by users. Since OSS developers rarely get any monetary compensation for the time and effort they put in, one might have a hard time understand-ing what is in it for them? What motivate programmers are instead mainly ego gratification incentives which steams from the desire of peer recognition (Lerner & Tirole, 2000; Hars & Ou, 2001; Lakhani & Hippel, 2003). Other drivers are future job offers, shares in com-mercial open source companies, future access to the venture capital market. The idea that improvements are driven by the developers’ personal motivation is also supported by Han-sen et al. (2002), who see this as an advantage compared to proprietary programs. Then, there are no market pressures to release a new software version within a time frame,
al-though the product might not be considered as entirely completed. Alal-though, there are other personal drivers besides monetary rewards, one needs to acknowledge that this factor is important and might as well work as good as any other driver such as community recog-nition etc. A programmer, for example, could work for a proprietary software firm during the days, driven by the monetary rewards, and on his free time work with OSS develop-ment. Both fulfil different needs and could be equally important in terms of personal needs and self actualisation.
Fuggetta (2003) presents a cause-effect diagram, Figure 2-2, illustrating how open source developed software creates high quality software and customer satisfaction.
Software development is carried out in a dis-tributed setting
It is possible to include expert developers from the entire world
Software can be tested in a much
more efficient way …
Other factors
A new process fro software develop-ment Developers are strongly motivated Software is open source Software quality is high; customers are satisfied; …
Figure 2-2 Cause-effect diagram. Fuggetta, 2003
Figure 2-2 illustrates that there are a number of factors affecting the level of software qual-ity. Moreover, the open source developing approach allows multiple users being able to si-multaneously test and improve the code. A widely performed inspection of the code in search of bugs etc. is also performed. This distributed setting together with the ego gratifi-cation incentives, creates a process for software development where high software quality is produced.
2.3.4.3 Training and education
Although OSS presents obvious cost advantages in terms of not having to spend money on licences, alternative costs may arise due to training and education etc. Chircu and Kaufman (2000) identify resources and knowledge as two potential barriers which could hinder the value creation of IT investments. Further, training and other efforts to increase “organisa-tional awareness” of how to obtain value is, according to Chircu and Kaufman, correlated with the degree of resources put into the project. Building and retaining human capital through training and human resources, policies help organisations eliminate the knowledge barrier (Chircu and Kauffman, 2000). When trying to integrate or migrate the organisa-tion’s software platform into using OSS, obstacles most certainly will arise. As stated by
Ward and Bawden (1996), if change is to be successfully implemented within an organiza-tion and complexity and uncertainty associated with that change are to be minimized, one need to carefully think through the whole implementation process. Changing software therefore requires, among other things, investments in training in order to minimize the knowledge barrier. Goode (2004) mentions there seem to be a notion that OSS is only free to those who do not value time. Although, this might be to exaggerate, the statement cer-tainly carries some truth. If one is not willing to acknowledge the importance of training and knowledge creation and is not ready to put resources into it, one should carefully con-sider staying with the old information systems and applications. Certainly all new software purchases require training, going from a Microsoft product to another Microsoft product compared to an OSS alternative, probably is a bigger step since the environment has fun-damentally shifted.
2.4
Discussion of the frame of reference
The four main factors that are being used in our classification (organisational, environ-mental, user and system) have been presented with the intention to elucidate our way of categorising OSS related factors for this study. These four main factors followed by the sub factors are used as a foundation when creating relevant questions for our survey. Moreover, we are aware that the classification used, is not covering every single aspect of the phe-nomenon, e.g. legal- and cost structural aspects are two alternative factors that could have been discussed further. It would have been possible to put the former of these two under environmental factors, and the latter under system factors. However, including the men-tioned factors (legal- and, cost aspects), one could argue, would have shifted the focus away from our intended purpose, negatively affecting the consistency of the thesis. For example, the reader would then probably have expected cost efficiency analysis examining the sav-ings that could be made by choosing an OSS alternative.
Subsequently, these factors followed by their sub factors all have a certain level of impact on the decision-making process regarding municipalities’ possibility to migrate or integrate into using OSS. Although, they may not be equally important in the eyes of an IT manager within a municipality, they still mirror a certain impact on the decision-making process. As stated in our research questions (1.2), this impact and to which extent it is facilitated is then studied. The reasoning taking place above is illustrated in Figure 2-3. The statements in the questionnaire have emerged from different parts in the theoretical framework. Statement one to four have emerged from the organisational factors, statement five to seven concerns environmental factors, eight to ten is statements that have emerged from factors concern-ing user level and eleven to fourteen is statements concernconcern-ing system level.
Organisational factors
Industry Organisation
Figure 2-3 Research model
The main argument for presenting the theoretical framework according to Figure 2-3 is be-cause it allows us to not only visualising what theory that is being used but also how the different parts are related to each other. The factors, illustrated on the left side of the model together with their impact on the decision-making process concerning OSS illus-trated on the right side, directly steams from the two different research questions presented in chapter 1.2. This is done with the aim to show how the theory is used in order to guide our research.
2.5
Proposal for aspects to measure
As suggested by the research model, Figure 2-3 presents four main factors that could be viewed as a foundation or starting point when approaching the aspects we intend to meas-ure. These factors will help deepening the level of understanding regarding to which extent organisational-, environmental-, user- and system factor affect IT managers when evaluat-ing and justifyevaluat-ing the possibility to migrate or integrate into usevaluat-ing OSS. Based on the theo-retical framework and the stated research questions (1.2) we present the following proposi-tions:
P1. We will study which impact organisational factors have on the decision-making process of IT managers, within municipalities, when it comes to migrate or integrate into using open source software.
P2. We will study which impact environmental factors have on the decision-making proc-ess of IT managers, within municipalities, when it comes to migrate or integrate into using open source software.
P3. We will study which impact user factors have on the decision-making process of IT managers, within municipalities, when it comes to migrate or integrate into using open source software.
Environmental factor
Management
User factor
User acceptance
Impact on the decision-making process regarding municipalities’ when it comes to migrate or inte-grate into using OSS.
System factors
Security and risk Quality
P4. We will study which impact system factors have on the decision-making process of IT managers, within municipalities, when it comes to migrate or integrate into using open source software.
The proposals presented above all steam from the factors displayed on the left side of Fig-ure 2-3. The right side of FigFig-ure 2-3 could be seen as functions of the organisational-, envi-ronmental-, user-, and system factors, each affecting the decision-making process to some extent. Furthermore, these functions are of an analytical nature and therefore will not be discussed further in this chapter but will instead be used as a foundation when presenting our empirical findings and analysing our results.
3 Methodology
This chapter will discuss and motivate the research design and approach for this thesis. Moreover, measure-ments of the study’s trustworthiness together with justifiable data gathering techniques will be brought for-ward in order to present a strong case.
3.1 Research
design
Social research, according to de Vaus (2001), needs a design or a structure before data col-lection or analysis can commence. Further, de Vaus argues that the function of a research design is to ensure that the evidence obtained enables us to answer the initial question as unambiguously as possible. This means that one needs to specify the type of evidence needed to answer the research questions or to accurately describe some phenomenon. Ba-sically, the question that needs to be answered is: What evidence do I need to collect? Our research questions are of an explanatory nature in terms of that we intend to describe which factors municipalities use when evaluating and justifying the possibility of using OSS. But also try to comprehend why they are doing it the way they are. According to Björklund and Paulsson (2003), explanatory studies could be used when you are in search of deeper knowledge and you intend to both describe and comprehend a certain phenome-non. Moreover, knowledge regarding municipalities deciding variables, when it comes to open source, are crucial in order to later on being able to understand the importance and meaning of each factor and how it is related to the other factors. Therefore, one could see a need for an explanatory study where a descriptive “foundation” is laid out which then fa-cilitates finding evidence of a more comprehensive nature.
3.2
Choice of research approach
Järvinen (2000) stresses that the reason for taking a research approach instead of a research method as a unit of analysis is the limitations of human information processing. It has been determined that the human short term memory is restricted to 5 ± 2 observational units, thus using a research approach, it could contain several research methods but still belong to a certain approach. Within Järvinen’s taxonomy of research approaches, the theory-testing approach is one of the categories. The theory-testing approach is used for empirical studies where the theory, model or framework is either taken from the literature, or developed or redefined for that study. Methods that could be applied are laboratory experiment, survey, field study, field experiment etc.
Since our intentions are to study municipalities throughout Sweden and given the intended purpose one could argue that deductive reasoning, using theory-testing, is the most suitable research approach. Testing different propositions, derived from the theoretical framework, could therefore be used when trying to confirm or falsify the theory. Further, the munici-palities could be seen as a homogenous group with similar needs and interests which speak in favour of accurately being able to generalize the results. The quantitative research ap-proach acknowledges the importance of being able to generalize the results to a wider population. Although, dividing research into quantitative and qualitative terms have be-come increasingly criticised e.g. by Byrman (1997) and Gomm (2004) given that quantita-tive research not necessarily needs to generate quantitaquantita-tive information, our study could still be argued to be of a quantitative nature. Our proposals for aspects to measure (see 2.5) are derived from the theoretical framework which in turn is derived from the literature
re-view. Data will be gathered and analysed numerically in order to be generalized to a wider population.
An alternative approach could be to pursue the path of qualitative research. The fundamen-tal characteristic of qualitative research is, according to Byrman (1997), the will to see, ex-press occurrences, norms and values through the eyes of the study object. Further, the ap-proach emphasises the need to “dig deep” into a certain subject in order to understand per-sons and their actions in its social context. Using a qualitative research approach and e.g. conduct interviews, would make it possible to find formerly unknown factors, not found in previous literature, which could affect IT managers’ decision regarding open source within municipalities. Being able to spontaneously coming up with new questions based on the study object’s answer is another advantage of interviews. However, one could argue that a rigorous and thought through theoretical framework increases the chances of a quantitative research approach which manages to use appropriate questions in order to be able to fulfil the purpose. Basically, one could argue that it is possible to “dig” relatively deep using a quantitative research approach as long as one is using the right questions.
3.2.1 Survey
Even though one is pursuing a quantitative research approach, there are still a number of possible routes to consider, e.g. observations, experiments, questionnaires etc. (Holme & Solvang, 1991). For this study a questionnaire, derived from the theoretical framework and the pre study, was used. The pre study is further explained in section 3.3. One of the strengths with using a questionnaire is, according to Björklund and Paulsson (2003), the possibility to gather a relatively large amount of primary data. A weakness, according to Björklund and Paulsson (2003), is however the risk of the respondents misinterpreting the questions. Nevertheless, since our sample consists of IT managers which presumably are knowledgeable in IT infrastructural issues, we are relatively confident that they will under-stand our questions.
Gomm (2004) argues that the use of closed as opposed to open questions can certainly give rise to different answers about the same matters. Closed questions forces the study object to choose between a number of alternatives when answering a specific question while open questions are unstructured making it possible for the respondent to freely express his or her point of view on a certain topic. Our questionnaire is composed of closed questions based on a number of reasons. As suggested by Gomm (2004), closed questions can be constructed to force respondents to make themselves comparable with others by express-ing an opinion or belief. Our intention is to be able to generalize the results to a wider population and therefore we believe closed questions are a suitable alternative. Moreover, forcing the study object to choose between a number of alternatives makes it possible to quantify the results in order to perform statistical tests and generalize the results.
There are different question formats available; however we will use a likert scale illustrating beliefs and opinions such as strongly disagree, disagree, uncertain, agree, and strongly agree. Accord-ing to Zikmund (2000) usAccord-ing a likert scale, respondents indicate their attitudes by checkAccord-ing how strongly they agree or disagree with carefully constructed statements that range from very positive to very negative toward the attitudinal object. Moreover, Zikmund states that each alternative response is assigned a weight in order to be measurable. In our survey,
strongly disagree is assigned with the numerical value of one ranging to strongly agree with the
numerical value of five. Hence, a disadvantage with using likert scale summated rating methods, according to Zikmund (2000), is that it is difficult to know what a single
sum-mated score means. Thus, identical total scores may reflect different “attitudes” because of the different combinations of statements endorsed. We are aware of this problem and have therefore carefully formulated our statements as homogeneously as possible, e.g. each statement generates a low number if one is positive towards OSS solutions, while a high number indicates a negative point-of-view towards OSS. However, formulating the state-ments as described above, the disposition becomes slightly negative. For example, each statement is formulated negatively against OSS and positively against proprietary software. Unfortunately, this is necessary in order for the study object to either agree or disagree with a certain statement. Further, Zikmund (2000) also acknowledges this problem but states that as long as the researchers are aware of the phenomenon, it should not be seen as a sig-nificant barrier for receiving accurate responses.
3.2.2 Sampling
The population for this research is 290 municipalities, which is the total number of munici-palities in Sweden. One could argue that the population is rather small and all elements should be included in the survey. However we do believe that it would have been too de-manding in terms of time and resources needed. Holme and Solvang (1991) argue that there often is suitable to take a sample as it is too expensive and time-demanding to exam-ine a whole population. Furthermore, Holme and Solvang mention that an investigation of a sample can give more accurate results than an investigation of the population, this be-cause too many elements and information decreases the researchers’ ability to keep a high level of concentration throughout their entire study.
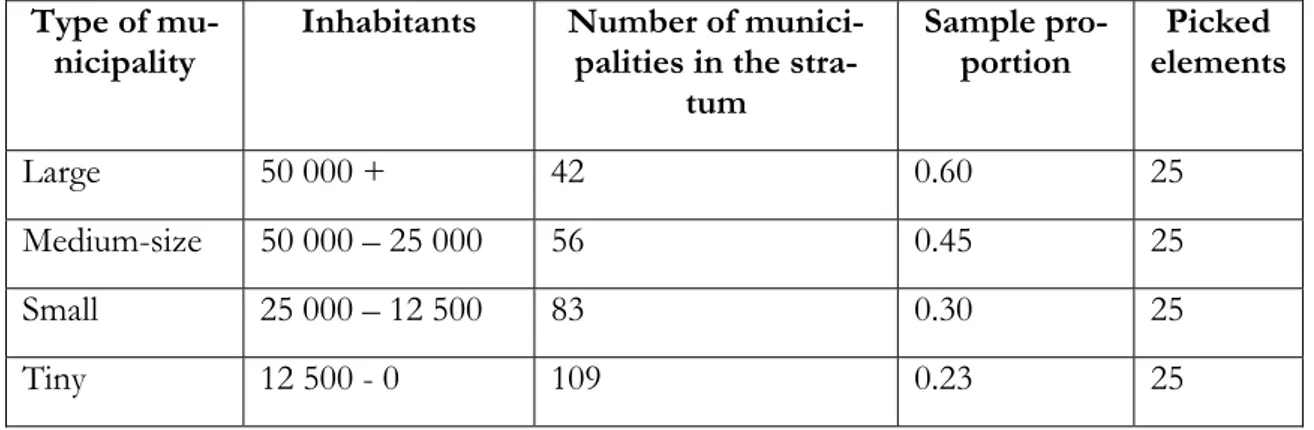
Our intention is to be able to generalise the results to the entire population which means that the sample therefore has to be representative (Holme and Solvang, 1991). Creating a representative sample for a population, you must be able to calculate the probability for each element included in the sample. This is the distinction between the two kinds of sam-ple: non-probability and probability sample. There are, according to Holme and Solvang (1991), different kinds of probability samples, e.g. stratified sample, quota sample and clus-ter sample. A stratified sample is when you divide the population into a number of groups which are called stratums. The stratums are decided with some strata variable, so that simi-lar elements are in the same stratum.
The sample that is suitable for this thesis is a stratified sample. One could argue that there are two different purposes for using stratified sample, one is to analyze differences between diverse groups, and the other is to make sure to spread your sample in case of that one group is overrepresented. According to Körner and Wahlgren (1998), a random sample can create a deceptive sample since it could be derived from a population where the distribu-tion of, for example, large-, medium, and small size organisadistribu-tions is uneven. This is because the probability for a large organisation to be picked is small. The purpose of using a strati-fied sample is therefore to make sure that the different stratums of the population is equally represented in the sample. According to Holme and Solvang (1991) a stratified sample is suitable when a certain number of elements are desired. We believe that there is a differ-ence between municipalities in terms of knowledge, usefulness and pre-usage of OSS. One could argue that these issues are affected by the size of the municipality since demands of the IT infrastructure together with their use of applications are different. The number of inhabitants reflects the size- and the demand of the municipality and therefore the size will be used as the strata variable. The sampling frame is retrieved from The Swedish Associa-tion of Local Authorities and Regions, (2005).
According to Aczel and Sounderpandian (2002), a sample of 30 or more elements is large enough to get a distribution of the sample mean which represents a normal distribution of the population from which the random sample is drawn. We have chosen to draw a sample of 100 elements since we believe we will receive a response rate of at least 40 % which will give us at least 40 elements.
The four strata are found in Table 3-1. According to Holme and Solvang (1991), there are two choices when deciding how many elements from each stratum that should be included: proportional and non-proportional. Proportional sample is when the proportion between different stratums in the sample is the same as in the population. The only point in taking a proportional stratified sample is, according to Gomm (2004), that you indeed got the same percentage from each stratum. For this thesis both types of sampling could be a feasible option. However, we have chosen to make a non-proportional sample as we have an equal interest in large municipalities as in smaller ones. The sampling is still a probability sample as the probability for each element to be chosen is known, which according to Aczel and Sounderpandian (2002) is called sample proportion.
Table 3-1 Stratified sample Type of
mu-nicipality Inhabitants Number palities in the stra-of munici-tum
Sample
pro-portion elementsPicked
Large 50 000 + 42 0.60 25
Medium-size 50 000 – 25 000 56 0.45 25
Small 25 000 – 12 500 83 0.30 25
Tiny 12 500 - 0 109 0.23 25
To decide what elements that should be in the sample, we applied a systematic sampling procedure which, according to Sekaran (2003), is that you draw every nth element in the population with a randomly selected start point. First we gave all elements a number from one to the last number in the stratum, then a starting point for each stratum was selected with help of the random function in Microsoft Excel. Then we picked every fourth for large, every third for medium-size-, every fourth for small- and every fifth for tiny munici-palities. The cause for using different numbers for the different stratums is that the number of the picked elements divided with the number of the municipalities in the stratum had to be odd. The list of the chosen municipalities can be found in Appendix 3.
3.2.3 Qualitative supporting quantitative
A qualitative research approach could, according to Bryman (1997), be used in a pre study in order to further tune the instrument of the quantitative study, in our case the question-naire. An obvious function of this, stressed by Bryman (1997), is that the qualitative re-search approach then could act as a source for developing new ideas and formulating propositions and hypothesis.
Although one could argue that the theoretical framework is accurate for placing this study in a suitable context, the pre study (chapter 4) further helps when narrowing the focus of
the research and more specifically generate primary data concerning the municipalities. For example, the theoretical framework is applicable to our area of concern, although being on a higher abstraction level than the pre study. The pre study on the other hand has the in-tention, as argued by Bryman (1997), to generate new ideas and possibly cover issues that have gone by unnoticed throughout the literature review. Moreover, performing an inter-view will in a way help us see the research questions through the eyes of one of our study objects. Hopefully, this will simplify formulating the questions for the questionnaire, creat-ing a higher degree of precision. Arguably we will then have a better understandcreat-ing of the terms that are being used when discussing the topic of OSS and municipalities.
Another purpose with the pre study was to be able to use it as another source of informa-tion when conducting the analysis. One could argue that by using complementary tech-niques and information sources during the data gathering procedure, one are strengthening the trustworthiness of the discussion that are taking place in the analysis.
3.3
Data gathering procedure
After deciding that we were going to e-mail our survey to the municipalities, included in the sample, we needed to make sure that we possessed valid e-mail addresses to respective IT-manager. Therefore, we called the receptions at every municipality and asked about the e-mail address to the IT-manager. Otherwise, sending the e-e-mail to the contact address of each municipality, we believe the response rate would be significantly lower due to the need of forward the message to the right person. The response time would probably also had been longer.
Initially, we decided to e-mail our questionnaire on the afternoon, Friday the 29th April. However, we realized that there was a considerable risk that the IT-managers would not open the e-mail before Monday morning, the following week when reading and clearing their e-mail accounts from spam etc. Moreover, this could lower their chance of respond-ing since the mail could have gone by unnoticed or it could be associated with a spam e-mail. Therefore we decided to send our questionnaire at noon, Monday the 2nd May, when the inbox is relatively empty.
The questionnaire was a MS Word document on approximately 300 Kb which led to a risk that the answers would be rejected since the inbox would turn up full. Therefore we signed up for an e-mail account with over 2 gigabyte inbox. To get a serious impression we signed up magisteruppsatsinformatik@gmail.com.
Sending all e-mails at one particular occasion could cause the e-mails getting blocked in a spam filter. Furthermore, we did not want to expose the IT-managers’ e-mail addresses to each other because of privacy reasons. Therefore, we decided to send four separate e-mails, each containing 25 respondents. The e-mail, consisting of a questionnaire (Appendix 4) to-gether with an introduction text (Appendix 5) was sent as a blind carbon copy making the addresses invisible.
To increase the trustworthiness of the survey it was important to receive as many responses as possible. For that reason, after one week we sent a reminder (Appendix 5) to the re-spondents who had not yet answered. This turned out to be a good idea since we received ten additional responses resulting in a final amount of 37 responses (response rate 37 %). The answers received from each respondent are displayed in Appendix 6. Moreover, the questionnaire was created in Swedish and after the results had been received translated into English. It is possible that the translation, to some extent, changed the content of the