https://doi.org/10.47260/jesge/1126 Scientific Press International Limited
Agriculture in Iraq
Nadhir Al-Ansari1, Salwan Ali Abed2 and Salam Hussein Ewaid3
Abstract
The climate of Iraq is of the subtropical semi-dry type; however, the country was rich in water resources until a few decades ago. The climate change, the construction of many dams on the Tigris and Euphrates Rivers in the neighboring countries, wasting water, and mismanagement caused water shortages. Now, there is a need to decrease consumption, good management of water resources and determining the water requirements and water footprints of the major crops because agriculture is the first consumer of water. The FAO CROPWAT 8.0 simulation model, the CLIMWAT 2.0 tool, and the Aqua-Crop model can be used in Iraq to find the crop water requirements (CWR), irrigation schedules and water footprint (WF) for major crops, the Aqua-Crop software can predict the effects of water deficits on crop productivity or yield to improve irrigation under limited water conditions. All of that is to improve the management of water resources to cope with drought. The objectives of this proposal study beside the calculating of wheat water footprint are to assess the capability of the AquaCrop model to simulate wheat (Triticum aestivum L.) performance in hot dry conditions under full and deficient water conditions in south of Iraq, to study the effect of various irrigation scenarios (stages of crop growth and water depth applied) on wheat yield. The AquaCrop model will be evaluated with experimental data during the field experiment. The AquaCrop model can accurately simulate root zone, crop biomass and grain yield soil water content, with less than 10 percent standardized root mean square error (RMSE).
Keywords: Water, Agriculture, AquaCrop, Iraq.
1 Department of Civil, Environmental and Natural Resources Engineering, Luleå University of
Technology, Sweden.
2 Department of Environment, College of Science, University of Al-Qadisiyah, Iraq. 3 Technical Institute of Shatra, Southern Technical University, Iraq.
Article Info: Received: October 27, 2020. Revised: November 1, 2020. Published online: November 15, 2020.
1. Introduction
1.1 An overview of the state of agriculture and irrigation in Iraq
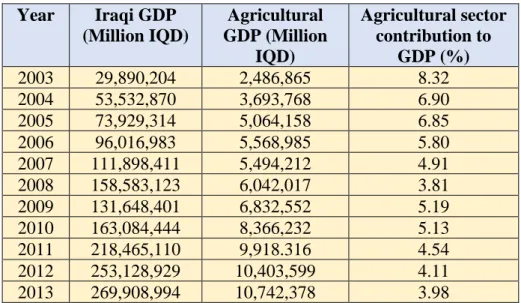
The vision of Iraq is to achieve stable food security for the nation through cultivation of fertile land, use of skilled workers and appropriate equipment, and sound farm management. The increase in financial and technical efficiency in agriculture is essential as it is also in improving animal productivity. Despite efforts to enhance biodiversity in crop systems, wheat and barley remain among the basic crops necessary for food self-sufficiency. Whenever water shortage is one of the determinants of agricultural activities, then water consumption is reduced and the total irrigated area is reduced, and the necessary food is imported. Iraq’s need for food calls for greater activity from farmers to contribute to investment costs and preserve natural resources, Table 1 and 2 (Iraqi MOWR, 2014).
Table 1: Present State of Agriculture
Year Iraqi GDP (Million IQD) Agricultural GDP (Million IQD) Agricultural sector contribution to GDP (%) 2003 29,890,204 2,486,865 8.32 2004 53,532,870 3,693,768 6.90 2005 73,929,314 5,064,158 6.85 2006 96,016,983 5,568,985 5.80 2007 111,898,411 5,494,212 4.91 2008 158,583,123 6,042,017 3.81 2009 131,648,401 6,832,552 5.19 2010 163,084,444 8,366,232 5.13 2011 218,465,110 9,918.316 4.54 2012 253,128,929 10,403,599 4.11 2013 269,908,994 10,742,378 3.98
Table 2: Future State of Agriculture Million Hectars Million Donums %
Total Area of Iraq 43.700 174.800 100.0%
Total Area suitable for Agriculture 7.000 28.000 16.0%
Total Area ready for cultivation by 2015 5.985 23.938 100.0%
Irrigated 3.810 15.238 63.7%
By surface water INSIDE official irrigation projects 2.534 10.135 42.3% By surface water OUTSIDE official irrigation projects 0.850 3.400 14.2% By springs INSIDE officials irrigation projects 0.007 0.029 0.1% By ground water INSIDE officials irrigation projects 0.020 0.081 0.3% By groundwater OUTSIDE officials irrigation projects 0.398 1.593 6.7%
Rain fed 2.175 8.700 36.6%
Presently Irrigated Area 3.810 15.238 100.0%
Developed or Partially Developed Irrigation Projects 1.369 5.474 35.9% Undeveloped Land Currently Cultivated 2.441 9.764 64.1% Area receiving water through gravity irrigation 2.081 8.325 54.6% Area receiving water through Pumping 1.193 4.773 31.3% Area receiving water form Ground Water 0.350 1.703 11.2%
Total Amount of Water for Irrigation (BCM) 49.919
From Surface Water (BCM) 46.420
From springs (BCM) 0.099
From the Ground Water (BCM) 3.400
Overall Irrigation Efficiency 35%
Table 3: Future State of Agriculture. Present State of Agriculture Million Hectars Million Donums %
Total Area of Iraq 43.700 174.800 100%
Total Area suitable for Agriculture 7.000 28.000 16.8%
Total Area ready for cultivation by 2035 5.397 21.586 100% Irrigated (if 100% of the area were to be developed) 3.397 13.586 62.9%
By surface water INSIDE official irrigation projects 3.191 12.748 59.1% By surface water OUTSIDE official irrigation projects 0.000 0.000 0.0% By springs INSIDE officials irrigation projects 0.011 0.045 0.2% By ground water INSIDE officials irrigation projects 0.032 0.127 0.6% By groundwater OUTSIDE officials irrigation projects 0.167 0.66 3.1%
Rain fed 2.000 8.000 37.0%
Area proposed for irrigation by this Strategy 3.230 12.920 94.6%
To be rehabilitated 1.369 5.474 42.4%
To be reclaimed (based in available water) 1.862 7.446 57.6% Area receiving water through gravity irrigation 3.187 12.748 98.7% Total Amount of Water for Irrigation (BCM/Y) 34.560
Surface Water (BCM/Y) 32.678
Springs INSIDE official Irrigation Projects (BCM/Y) 0.103 Ground Water INSIDE official Irrigation Projects
(BCM/Y)
0.300 Ground Water OUTSIDE official Irrigation (BCM/Y) 1.479
Overall Irrigation Efficiency 60%
Overall Cropping Intensity in the Irrigated Land 115% 1.2 Overview of Irrigation System
The irrigation systems in Iraq, diverting its water mainly from the Tigris and Euphrates river, is comprised of 25 dams and weirs and 275 pumping stations, with a total network of about 27,000 km2. Recent development of large dams and
irrigated farmlands in neighboring countries situated in the upstream of the Tigris and Euphrates rivers, is causing reduction in the flow into Iraq, and thus, is becoming a problem. In addition, occupation of the Mosul dam in the Tigris basins by ISIL, a destabilizing force in Syria and in central and western Iraq since 2014, had also contributed to water use instability.
1.3 Agricultural development and productivity
The importance of agriculture is not limited to providing food for the population. Agriculture, like the food it produces, is the cornerstone of many major aspects of life such as: culture, health, livelihoods and prosperity in Iraq. Agriculture is the second largest contributor to GDP, (of course, after oil production) and employs about 20% of population. Although the sector’s contribution to the economy
decreased from about 9% in 2002 to 3.6% in 2009 (Iraq CSO, 2009), it is still a major source of support for the poor and is the largest source of employment in rural areas.
In addition to feeding and employing the population and contributing to the GDP, well-managed cultivated lands help prevent desertification, as well as help prevent sand and dust storms and land degradation. However, in order to achieve the desired goals of the agricultural sector - including reducing the proportion of food imports, increasing productivity, and building the technical capacities of farmers - coherent and coordinated efforts must be sought to improve policies, re-prioritize investment projects, and support the rehabilitation of services (Iraqi MOWR, 2014).
1.4 Providing food for the population and reducing dependence on imports
The simplest role of food is to feed people. According to the World Food Program (WFP) for the year 2012, the nutritional needs of Iraq require the minimum dietary energy requirement (MDER), which is 1727 calories per day per person. In the year 2011, approximately 5.7% of the Iraqi population lived under this minimum, which is comparatively better than the rest of the Middle East, which is at 9%, is also an improvement compared to the year 2007, when 7.1% of the Iraqi population lived below the required minimum of food energy. It is considered people who live below average. Nutritional needs are at risk of malnutrition.
The negative impact on the health of Iraqis due to food deprivation is important. Malnutrition, especially in children, increases the frequency and severity of infectious diseases, affects their intellectual and physical development, and increases the mortality rate. About 5.8% of Iraqi children under the age of five are underweight, and one in four suffers from stunted physical and intellectual development due to chronic undernutrition (Iraqi MOWR, 2014).
Iraq relies heavily on importing foodstuffs to meet its food needs. It was the average national production of wheat for the period 2009 to 2011 including the estimated wheat production for 2012 is 2.4 and 2.1 million tons, respectively. For the year 2012, imported wheat is estimated 3.5 million tons.
The production of rice in the agricultural season is estimated from 2012 to 2013, along with rice imported in 2013, to 1.0 and 0.2 million tons, respectively (Abbasian & Pound, 2013). Therefore, in 2012, the import dependency ratio (IDR) for wheat and rice was estimated at 62.5% and 94.0%, respectively. Comparing the import dependency ratio for 2012 to 2007, wheat imports remained roughly equal, but rice imports increased by seven percent. This means that during the five-year period from 2007 to 2012, there was no improvement in the rates of Iraqi wheat production, but even an increase in dependence on imported rice in the country. The self-sufficiency ratio (SSR), which expresses the size of agricultural production for household consumption, was 37.5% and 6.2% for wheat and rice, respectively, in 2012, as these figures indicate a high dependence on global food sources (Saade, 2012).
1.5 Employment of farmers and poverty reduction
Most of the agriculture in Iraq is practiced today in small farms that operate with a relatively low input system and thus give low output. This means that limited technology is used on farms, thus achieving agricultural crops and low economic gains. The use of available poor quality chemicals along with the misuse and scarcity of organic fertilizers make agricultural crops somewhat scarce according to the comparison criteria. Moreover, the obsolescence of agricultural machinery and insufficient technical skills of most farmers contribute to weakening and reducing productivity (Iraq CSO, 2009).
Crop production is the main source of income for 75% of farmers in Iraq, while the rest depends on livestock production. Cereals, chiefly wheat and barley, are among the main crops in the north and dirt regions. In central and southern Iraq, where agriculture depends mainly on irrigation from the Tigris and Euphrates rivers, and mixed farming systems prevail. Dates are also of major value for food crops as well as vegetables, especially tomatoes and potatoes. Animal husbandry, fish ponds and poultry are practiced on a large scale and are a valuable source of protein and income for the rural population.
Poverty rates in rural areas (39%) are much higher than urban areas (16%), with about 15% of rural residents earning less than 1 dollar per person per day, compared to 4.6% in urban. Poverty rates vary widely between governorates, ranging from 49% in Al-Muthanna Governorate to 3% in Sulaymaniyah. In rural areas, poverty rates are particularly high in the governorates of Muthanna (75%), in Babil (61%), and in Wasit (60%) (Iraqi MOWR, 2014; Al-Haboby et al., 2014).
1.6 Preventing desertification
The agricultural sector is vulnerable to changes in the environment, including reduced water availability, land degradation and desertification, extreme weather events, and changes in weather patterns. Bad agricultural practices can contribute to this weakness, and as degraded lands are also subject to erosion, this means that agricultural lands contribute to a large extent by forming sand and dust in the air during strong winds, which leads to the loss of fertile soil. It is likely that within the next ten years the number of dust storms will increase dramatically, which highlights the urgent need to improve land management by farmers and decision-makers.
The agricultural sector consumes 75% of the total water resources in Iraq. As a result, when drought occurs, agriculture is most affected. For example, in the year 2008 and 2009, the drought damage affected nearly 40% of the agricultural lands in Iraq, and Nineveh and Erbil witnessed damage that affected more than 50% of their agricultural lands. By aggregating the threats of drought, the land that requires irrigation and planted with wheat alone expanded by 33% between 2000 and 2010. Finally, although most of the agricultural lands in Iraq depend on irrigation, the low amount of rainfall guarantees production losses for the demolished crops. Floods can cause similar damage to the agricultural sector.
In May 2013, for example, nearly 600 families were displaced due to severe floods, and around 30,000 hectares of crops were damaged or destroyed by flood waters in Maysan, Qadisiyah, and Wasit governorates (Iraqi MOWR, 2014).
In addition, according to the Iraqi government, 92% of the total area of Iraq is under the risk of desertification, a process whereby land degradation occurs in arid and semi-arid climates due to man-made activities and drought or climate change. Proper management of farmland can help halt or reverse this process. Every year due to poor land management, approximately 100,000 hectares of farmland are lost due to land degradation. This means a decrease of agricultural land reaching 23% of the total area of Iraq in the year 1993 to 19% in the year 2011 (Woertz, 2017).
1.7 Needs
With the growth of the Iraqi population in the coming decades, and to impose maintaining the average levels of food supplies (estimated in the year 2011 at 150 kg of wheat per year per person), Iraq will need nearly 6.3 million tons of wheat by the year 2020 and more than 8.9 million tons by 2035. About 40% of the daily Iraqi food consumption is represented in wheat flour and its derivatives. If measures are not taken to improve wheat production in Iraq, it is expected that average wheat productivity will decrease by 12.5% by the year 2020. Therefore, dependence on importing wheat could exceed 70%, which represents a worrying trend of food security in Iraq (Iraqi MOWR, 2014).
1.8 Opportunities and Strategies
The rehabilitation and development of Iraqi agriculture is a medium to long-term goal that can only be achieved through coordinated and coherent efforts based on improving policies and project investment, including the rehabilitation of aid services and capacity building. Ultimately, there has to be a fundamental shift in the nature and capacity of Iraqi farmers: they need to be more efficient, more productive, and more responsible in using their water and operating and maintaining distribution systems. In order to realize these gains, farmers need help. The government needs to put in place clear policies and procedures, give up a certain amount of control over local water user associations, provide opportunities for access to the funds needed to develop technology, and give farmers the support they need to adapt to changing circumstances. Moreover, there is a need for a gradual but assertive shift to a market-based system for the food sector, while reducing dependence on government subsidies.
This strategy envisions that agriculture in Iraq should not be developed at any cost: production activities should be promoted only in conditions where good quality water is available and soil conditions are appropriate. According to the National Development Strategy (NWDS) of the Iraqi Ministry of Planning, and the Millennium Development Goals of the United Nations, SWLRI gives top priority in developing a food strategy that will improve public health and eliminate poverty.
As a result, the strategy aims to reduce the migration of people by improving economic opportunities in rural areas.
Great importance has also been given to choosing crops that use less water. Consequently, conventional rice cultivation is much less than the total crop mix. As for other foodstuffs, such as wheat and barley, which are given high priority and within a healthy agricultural cycle, they will be in great proportions in the agricultural system in Iraq. Priority has also been given to better use of available technologies in the field of irrigated agriculture, and aquaculture will not be developed on a large scale. Some of the key recommendations of this strategy concern extension services and institutional changes, as shown below:
The future is scarce with water and requires the choice of crops and agricultural cycles that follow the principles of efficiency and productivity and strive to achieve the largest amount of food and jobs per unit of water. It is unlikely that Iraq will be able to achieve self-sufficiency in food. Therefore, the challenge is to determine the correct crop mix and the most appropriate and sustainable technical approach to maximize the quality and quantity of plant and animal productivity, both for the domestic and international markets. The proportion of basic crops and crops of high monetary value must be carefully scrutinized and diversified between the agro-ecological regions in the country, in order to obtain national self-sufficiency and ensure acceptable returns for farmers. In response to these challenges and needs, this strategy has identified eight Agricultural Climatic Zones (ACZs), in which climatic and agricultural conditions are similar and common strategies that can be adopted. For each of the eight agro-climatic zones, a specific crop mix was chosen as the most appropriate for specific land conditions. Moreover, the proposed cropping patterns meet the needs of human nutrition and the production of animal fodder to prevent overgrazing of pastures, thus reducing desertification and generating dust storms.
The options available for intensifying crop production in Iraq have been studied, drawing on a very large and diverse group of crops, most of which were previously cultivated on a large scale in Iraq. The crops were selected in agreement with the Ministry of Agriculture and the Ministry of Water Resources. And they belong to a variety of groups, such as:
• Market: food and cash crops.
• Time: the agricultural cycle (summer, winter and perennial crops) • Usage: basic food, vegetables, fruit trees, fodder, etc.
In particular, due to the long crop cycle, there are 25 annual crops, two of which are multi-year and six are permanent crops. According to the type of use, there are: two basic grains, three legumes, ten vegetables, three industrial crops, four oil crops, five forages and six fruit tree crops. Tomatoes, cucumbers, sweet peppers and eggplant were proposed for cultivation, both outdoors and in greenhouses, to reflect the growing interest in these agricultural methods that allow farmers to save water and bring the best market prices, as in such houses, crops are produced during the winter (Iraqi MOWR, 2014).
2. Proposed study
Using the models CROPWAT, CLIMWAT to calculate the water requirements, water footprint, and validation the AQUACROP model for wheat production in Southern Iraq.
2.1 Introduction
The climate of Iraq is of the subtropical semi-dry type; however, the country was rich in water resources until a few decades ago. The climate change and the construction of many dams on the Tigris and Euphrates Rivers in the neighboring countries caused water shortages. Now, there is a need to decrease consumption, good management of water resources and determining the water requirements and water footprint of the major crops because agriculture is the first consumer of water. The FAO CROPWAT 8.0 simulation model, the CLIMWAT 2.0 tool, and the Aqua-Crop model can be used in Iraq to find the crop water requirements (CWR), irrigation schedules and water footprint (WF) for major crops, the Aqua-Crop software can predict the effects of water deficits on crop productivity or yield to improve irrigation under limited water conditions. All of that is to improve the management of water resources to cope with drought. The objectives of this proposal study beside the calculating of wheat water footprint are to assess the capability of the AquaCrop model to simulate wheat (Triticum aestivum L.) performance in hot dry conditions under full and deficient water conditions in the south of Iraq, to study the effect of various irrigation scenarios (stages of crop growth and water depth applied) on wheat yield.
The AquaCrop model must be evaluated with experimental data during the field experiment. The AquaCrop model can accurately simulate root zone, crop biomass and grain yield soil water content, with less than 10 percent standardized root mean square error (RMSE).
Around 72 % of available freshwater resources are used by irrigated agriculture on a global scale (Geerts and Raes, 2009). The rapid increase in the world populace and the corresponding demand for more water from sectors such as industries and municipalities force the agricultural sector, on the one hand, to use its irrigation water more efficiently and, on the other, to produce more food. The defining optimal strategies for the management and planning of available agricultural water resources is becoming a global and national priority (Smith, 2000).
Iraqi water resources are inefficiently managed in the irrigation systems field, this issue, in the short-term was not representing a real problem because of the abundance of water, depending on the Tigris and Euphrates rivers with relatively moderate rainfall levels, but recently with water scarcity crisis, low rains levels and main rivers discharge decrease there is a need to modernize irrigation systems (JICA, 2016).
Agriculture is the main consumer of water and the irrigation systems require modernization and good management by evaluating water system water prerequisites precisely and it is important to know the water footprint, crop water
requirements (CWR) and irrigation scheduling to take care of the irrigation demand. The suitable for agriculture land in Iraq is about 8 million hectares, covering less than 15% of the country total area and only 4 to 5 million hectares are being cultivated (Iraqi MOWR, 2014)
Irrigation water resources in Iraq are not managed efficiently, this issue was not demonstrating a really difficult because of the richness of water, depending on the Euphrates and Tigris Rivers with moderate rainfall levels, but now with water shortage crisis, increase salinity, low rains levels and rivers discharge decrease, and there is a need to improve the irrigation systems (Ewaid et al., 2019a).
Iraq is facing a water shortage problem now. This problem is required to be more extreme later on where the supply is anticipated to be 43 and 17.6 BCM in 2015 and 2025, while current demand is somewhere in the range of 66.8 and 77 BCM (Ewaid et al., 2019b).
Various studies have shown that irrigation deficits could be one of the promising strategies (Geerts and Raes, 2009), whereas during the growing period less water than required is applied. While this inevitably leads to crop water stress and depression, high yields can still be achieved by providing the required quantity of irrigation water through sensitive crop growth stages and limiting water stress to tolerant growth stages (Blum, 2009).
Examining the yield response in the field and/or controlled experiments to various water applications is laborious and expensive. Modeling can be a useful tool for studying and developing promising irrigation deficit strategies (Pereira et al., 2009). Models allow for combined evaluation of various factors affecting yield to derive optimum irrigation quantities for different scenarios (Liu et al., 2007). They can also make it possible to differentiate evapotranspiration between transpiration and evaporation and to split crop production into various sub-models (Steduto et al., 2009), which may help to elucidate the mechanisms underlying the deficit irrigation of higher water productivity.
Calibration, parameterization, and evaluation should be carried out before any model can be used (Nain and Kersebaum, 2007). One changes model parameters and even coding to obtain exact prediction versus observed data for parameterization calibration. Validation, on the other hand, is the process by which the model runs against independent data without altering model parameters or code (Salazar et al., 2009).
Under water-limiting conditions, the FAO AquaCrop model predicts crop production, water requirement and water efficiency (Raes et al., 2009). This model has been tested under various environmental conditions for many crops. All of them illustrated that under complete irrigation and soil fertility stress conditions, the model could exactly simulate the crop biomass and yield in addition to soil water dynamics.
The aim of this proposed study besides the calculating of wheat water footprint is to evaluate AquaCrop model under complete and deficit irrigation and to use it to simulate the effects of various irrigation scenarios on grain yield and wheat water productivity in a dry and hot region of southern Iraq.
2.2 Materials and methods
2.2.1 The calculation of wheat water footprint (WF)
The WF for a crop is the size of freshwater that is spent during all the process of production (Aldaya et al., 2012). It has three parts: green, blue and gray.
The blue WF indicates the consumption of groundwater and surface water during the supply chain of the product; the green WF indicates the consumption of rainwater before it becomes a run-off; and the gray WF is the necessary volume of water to conform to a load of pollutants into accepted water quality standards (Hoekstra, 2017).
The WF gives an excellent perception of how and where freshwater is used in the supply chain to facilitates decision-making processes. WF accounting can be a useful tool to measure and predict the consumptive water use in rain fed and irrigated agriculture to meet the demands by rainwater, irrigation or combination of both.
This study will be a focus on the WF of wheat by estimating the green and blue WF from a production perspective for both irrigated and rain fed lands of Iraq in view of the actual water use by wheat production at the provincial scale, total water use in each province of Iraq will be also calculated.
The water footprint estimation can go about as benchmarks for the country and can conceivably prompt policymakers on maintainable and monetarily proficient water administration strategies.
2.2.2 Calculation of wheat water requirements
Software modeling by programs like CROPWAT 8.0 model and the CLIMWAT 2.0 tool attached to it is a significant practice to be actualized by scientists for the assessment of crop evapotranspiration, crop water requirements (CWR), and irrigation scheduling. This computer software is a tool to assist the irrigation engineers and agronomists to perform the usual calculation for water irrigation studies and mainly the management and schemes design (Valiantzas, et al., 2013). In the present proposed study, the irrigation water requirements of wheat will be studied in the south of Iraq to find the CWR and irrigation schedules.
The CROPWAT Penman-Monteith method will be used to calculate the reference crop evapotranspiration (ETo) and the USDA S. C. method will be used to estimate the effective rainfall.
The volume of water needed by a crop to grow is named the crop water requirement (CWR, mm), its level varied according to the type of crop and influenced by the crop coefficient (Kc) and the reference crop evapotranspiration (ET0, mm) (Aldaya et al., 2012).
The CWR is calculated as follows under the ideal conditions:
CWR=Kc × ETo (1) CWR= ETc (2) Kc is a value that differentiates field crops from the reference grass crop used for ET0 and the Kc changes during the crop growing. The period of a crop growing is divided into four stages (Aldaya et al., 2012).
2.2.3 Green CWU
The green quantity of crop water use (CWU green, m3/ha) is the size of rainwater that wheat crop used. It’s calculated by this equation (Allen et al., 1998).
CWU𝑔𝑟𝑒𝑒𝑛 = 10 × ∑Igpd=1ET𝑔𝑟𝑒𝑒𝑛 (3)
ET𝑔𝑟𝑒𝑒𝑛 = min (𝐸𝑇𝑐, 𝐸𝑓𝑓. 𝑟𝑎𝑖𝑛) (4)
2.2.4 Blue CWU
The blue constituent of CWU (CWU blue, m3/ha) is the size of crop irrigation water needed for growth including ground and surface water.
The blue constituent of CWU (CWU blue, m3/ha) is the size of crop irrigation water
needed for growth including ground and surface water.
CWU𝑏𝑙𝑢𝑒 = 10 × ∑Igpd=1ET𝑏𝑙𝑢𝑒 (5) The ETblue otherwise called the irrigation requirement (IR), it is the difference
between the ETc and the Eff. rain.
3. Total water footprint (WF) of a crop
The total WF of a crop is the summation of the green (WF green, m3/ton), blue (WF blue, m3/ton) and grey (WF grey, m3/ton). It provides the amount of water used up to yield a certain amount of a crop in m3/ton (Aldaya et al., 2012).
𝑊𝐹 = WF 𝑔𝑟𝑒𝑒𝑛 + WF𝑏𝑙𝑢𝑒 +WF𝑔𝑟𝑒𝑦 (7) The WF green is computed by dividing the green CWU (m3/ha) by the crop yield
(Y, ton/ha). In the same way, τhe WF blue is computed as the blue CWU (m3/ha) divided by the Y.
The WF grey is calculated by the grey water use AWU (m3/ha) divided by the Y.
𝑊𝐹 𝑔𝑟𝑒𝑒𝑛 =𝐶𝑊𝑈 𝑔𝑟𝑒𝑒𝑛𝑌 (8) 𝑊𝐹 𝑏𝑙𝑢𝑒 =𝐶𝑊𝑈 𝑏𝑙𝑢𝑒𝑌 (9) The WF crop production refers to the volume of water devoured to develop the amount of crop for a specific period. The production total WF of a crop (m3/yr) is the summation of the blue, green, and grey WF components by m3/yr. In the same way, the WF per ton of wheat (m3/ton) is the summation of the blue, green, and grey WF components by m3/ton.
𝑊𝐹 = WF 𝑔𝑟𝑒𝑒𝑛 + WF𝑏𝑙𝑢𝑒 (10) The computations of the three constituents are done by multiplying the annual production (ton/yr) times the water footprint per unit mass of crop (m3/ton) and the WF of each component will be shown in the volume of cubic meters of water per time period (m3/yr).
WF 𝑔𝑟𝑒𝑒𝑛 = WF 𝑔𝑟𝑒𝑒𝑛 × 𝑝𝑟𝑜𝑑𝑢𝑐𝑡𝑖𝑜𝑛 (𝑚3/𝑦𝑟) (11) WF𝑏𝑙𝑢𝑒 = WF𝑏𝑙𝑢𝑒 × 𝑝𝑟𝑜𝑑𝑢𝑐𝑡𝑖𝑜𝑛 (𝑚3/𝑦𝑟) (12)
4. Validation the FAO Aqua-Crop model
4.1 Field experiment
Due to low rainfall and high evaporation during the growing season, it is impossible to grow rain fed wheat in the southern Iraq region. Wheat production in this region is inevitably dependent on irrigation water. Data will be obtained from an experiment which will be conducted to assess the performance of the AquaCrop, (31◦21_N, 48◦8_E, 20 m above mean sea level) for a cropping season. The winter wheat genotype will be cultivated under full and deficit irrigation conditions. However, for evaluation of the AquaCrop model, the field data related to the Iraqi IPA 99 and Abu Ghraib -3 wheat cultivars, which is widely cultivated in Iraq, will be employed. Wheat will be sown on 15 November 2020 cropping season. Each plot consisted of 12 rows, 200 mm apart and 12 m long, using 400 seeds per m2. Based on 50 percent of the maximum available soil water in the root zone, irrigation will be scheduled as permissible depletion of soil water.
The surface flood method will be used to apply irrigation water. Irrigation will be withheld from anthesis in deficit irrigation treatment. The requirements for nutrients will be determined on the basis of soil analysis, and fertilizer applications met adequately. Before planting, nutrients will be applied and at the beginning of the stem elongation stage, nitrogen will be also applied as topdressing. Weeds will be effectively controlled using herbicides and during the growing seasons, there will be no pests or disease infestations observed.
Sowing date and emergence date will be recorded. When 90 percent of seedlings have emerged, the date of emergence is considered. There is also flowering and flowering duration, maximum canopy cover (using LAI), senescence and observation of maturity. Senescence is assumed to decline when the canopy starts while maturity is assumed when the canopy cover reaches almost zero (Raes et al., 2009).
Samples of aboveground biomass will be harvested monthly from an area of 0.33 m2 and dried for 3 days in a forced air dryer at 60 C to document the production of biomass (Ehdaie and Waines, 2001).
Ten days after physiological maturity and above-ground dry biomass and grain yield will be measured, the harvesting of experiments will be done manually.
Gravimetrically, the soil water content will be measured every 5 days in every 0.3m layer down to 0.9 m depth. Measurements per treatment will be performed in two replications. Based on gravimetric content and bulk density, the volumetric water content will be obtained.
4.2 Weather and soil data
Data from the weather station will be obtained daily maximum and minimum air temperature, sunshine, rainfall (mm) and evaporation (mm/day) situated near to the field experiment.
The experimental site soil will be classified. Soil texture, bulk density, and soil chemistry are the parameters that will be determined.
4.3 AquaCrop Model description
AquaCrop (Steduto et al., 2009), the FAO crop model, simulates achievable yields from major herbaceous crops as a function of water consumption under rain fed, supplementary, deficit and full irrigation conditions. AquaCrop's growth engine is water - driven by first calculating transpiration and translating it into biomass using a conservative, crop - specific parameter (Geerts et al., 2009), the productivity of biomass water, standardized for atmospheric evaporative demand and concentration of air CO2. The standardization is to apply AquaCrop to various locations and
seasons. Simulations are performed over thermal time, but in daily time steps, they can be performed over calendar time. The model uses canopy ground cover as the basis for calculating transpiration and separating soil evaporation from transpiration instead of leaf area index (LAI). The yield of crop is calculated as the dry biomass and harvest index (HI) above ground. HI increases linearly from flowering to near physiological maturity with time after a lag phase. Other than the yield, there is no partitioning of biomass into the different organs.
Based on the differential sensitivity to water stress of four major plant processes, crop responses to water deficits are simulated with four modifiers that are functions of fractional available soil water modulated by evaporative demand: expansion of the canopy, stomatal transpiration control, senescence of the canopy and HI. Depending on the stress level, timing and duration of stress, the HI can be adjusted negatively or positively. AquaCrop uses relatively few (explicit and mostly intuitive) parameters and attempts to balance simplicity, accuracy, and robustness. The model is aimed primarily at practitioner - type end - users such as those working for extension services, consulting engineers, government agencies, and various types of farmers ' associations. It is also designed to meet the needs of economists and policy experts who use simple planning and scenario analysis models (Steduto et al., 2009).
For tuning of parameters for non - conservative crops with the local environment, some of the wheat parameters in AquaCrop were considered conservative in the manual appendix of AquaCrop (Raes et al., 2009). In the validation, the same values of this set of parameters will be used to further evaluate AquaCrop's performance and robustness. These parameters include canopy cover growth and canopy decline coefficient; crop coefficient for full canopy transpiration; WP* for biomass; thresholds for soil water depletion to inhibit leaf growth and stomatal conductance and to accelerate canopy senescence; and HI adjustment coefficients in relation to leaf growth inhibition and stomatal behavior. These parameters are presumed to apply to a wide range of conditions and not specific to a particular crop; and HI adjustment coefficients in relation to leaf growth inhibition and stomatal behavior. These parameters are presumed to apply to a wide range of conditions and not specific to a particular crop. Usually specified by users, these parameters will be estimated using the 2020 cropping season experiment measured data. Using crop measured data, the crop characteristics required by the model can be adjusted for the particular cultivar. The calibration for the canopy cover is crucial in the
AquaCrop model. The change in the canopy will be measured in the field over the growing period. The options in the model will be used to estimate the sowing rate, seed weight, seed number and estimating the germination rate for the initial canopy cover (CCo). After entering some of the phonological dates such as emergence dates, maximum canopy cover, senescence and maturity, the model automatically will be estimated the canopy expansion rates. To calculate grain yield production, the flowering date, length of the flowering stage and reference HI and build - up period of HI will be specified. Calculating from temperature data, AquaCrop will be run on a growing degree day (GDD). The values of conservative parameters are the same as those proposed by FAO (Raes et al., 2009). The values will be measured or estimated by non-conservative parameters using experimental data. With the exception of the reference harvest index, the values of these parameters are located in the proposed FAO ranges.
5. AquaCrop Model validation
Evaluation is an important step in verifying the model. It involves a comparison between the model - created independent field measurements (data) and output. For model evaluation, soil water content over root depth, dry biomass above ground, and grain yield will be considered in this study. The calibrated model's performance will be evaluated against independent data sets (experimental data from cropping seasons 2020). Various statistical indices, including determination coefficient (r2), regression 1:1, absolute and standardized root mean square error (RMSE) and agreement (D - index) will be used to compare simulated to observed data. According to Loague and Green (1991), the normalized RMSE expressed in percentage (Eq. (13)) will be calculated.
(13)
(14)
The Pi and Oi refer to simulated and observed values of variables, e.g. days from planting to anthesis, days from anthesis to maturity, index of leaf area (LAI), biomass, the yield of grain and yield components. M is the observed variable's mean. A measure (percent) of the relative difference between simulated and observed data is given by standardized RMSE. The simulation is considered excellent with a
standardized RMSE of less than 10%; good if the standardized RMSE is greater than 10% and less than 20%; fair if the standardized RMSE is greater than 20% and less than 30%; and poor if the standardized RMSE exceeds 30% (Jamieson et al., 1991).
Willmott et al. (1985)'s proposed agreement index (D - index) was estimated (Eq. 15). The closer the index value to one, the better the agreement between the two variables being compared and vice versa, according to the d-statistic.
(15)
Where n is the number of observations, Pi the predicted observation, Oi is a measured observation, P_ M and O_.
6. Model application
The model will be used after model validation to evaluate the effects of various irrigation scenarios (crop growth stages and water depth applied) on grain yield and water use efficiency (WUE) for evapotranspiration. Weather data from the study area will be used to classify the year as wet (W), normal (N), and dry (D), depending on the amount of the precipitation.
For the simulation, the crop parameter values which will be reported and the field experiment station soil characteristics will be used.
WUE is a useful indicator for quantifying the impact on water management of irrigation scheduling decisions. WUE is used in the crop production system to define the relationship between crop production and the amount of water involved in crop production as crop production per unit volume of water (Ali and Talukder, 2008). In this study, WUE refers to the ratio between cumulative crop evapotranspiration (ET) and final grain yield (GY).
References
[1] Abbasian, A., and Pound, J. (2013). Food Outlook-Biannual Report on Global Food Markets. Food Outlook, 135.
[2] Aldaya, M.M., Chapagain, A.K., Hoekstra, A.Y., Mekonnen, M.M. (2012). The Water Footprint Assessment Manual: Setting the Global Standard; Routledge: Abingdon, UK.
[3] Al-Haboby, A., Breisinger, C., Debowicz, D., El-Hakim, A. H., Ferguson, J., van Rheenen, T. and Telleria, R. (2014). Agriculture for development in Iraq? Estimating the impacts of achieving the agricultural targets of the national development plan 2013-2017 on economic growth, incomes, and gender equality (Vol. 1349). Intl Food Policy Res Inst.
[4] Ali, M.H. and Talukder, M.S.U. (2008). Increasing water productivity in crop production: A synthesis. Agric. Water Manage. 95, 1201–1213.
[5] Allen, R.G., Pereira, L.S., Smith, M., Raes, D., Wright, J.L. (2005). FAO-56 dual crop coefficient method for estimating evaporation from soil and application extensions. J. Irrig. Drain. Eng, 131, 2–13.
[6] Blum, F A. (2009). Effective use of water (EUW) and not water-use efficiency (WUE) is the target of crop yield improvement under drought stress. Field Crops Res. 112, 119–123.
[7] Ehdaie, B. and Waines, J.G. (2001). Sowing dates and nitrogen rates effect on dry mater and nitrogen partitioning in bread and durum wheat. Field Crops Res. 73, 47–61.
[8] Ewaid, S. H., Abed, S. A., and Al-Ansari, N. (2019a). Crop water requirements and irrigation schedules for some major crops in Southern Iraq. Water, 11(4), 756.
[9] Ewaid, S. H., Kadhum, S. A., Abed, S. A., and Salih, R. M. (2019b). Development and evaluation of irrigation water quality guide using IWQG V. 1 software: A case study of Al-Gharraf Canal, Southern Iraq. Environmental Technology & Innovation, 13, 224-232.
[10] Geerts, S. and Raes, D. (2009). Deficit irrigation as on-farm strategy to maximize crop water productivity in dry areas. Agric. Water Manage. 96, pp.1275–1284.
[11] Hoekstra, A.Y. (2017). Water footprint assessment: Evolvement of a new research field. Water Resour. Manag., 31, pp.3061–3081.
[12] Iraqi CSO (2020). Iraqi Central Statistical Organization Yearly Statistics, Ministry of Planning Baghdad. Available online: http://www.cosit.gov.iq/en/ [13] Iraqi MOWR (2014). Iraqi Ministry of Water Resources National Center for
Water Resources Management. Strategy for Water & land resources in Iraq, Final report.
[14] Jamieson, P.D., Porter, J.R. and Wilson, D.R. (1991). A test of computer simulation model ARC-WHEAT1 on wheat crops grown in New Zealand. Field Crops Res. 27, pp.337–350.
[15] JICA (2016). Data collection survey on water resource management and agriculture irrigation in the republic of Iraq. Final report, Japan International Cooperation Agency (JICA), NTC International Co., Ltd.
[16] Liu, J., Wiberg, D., Zehnder, A. and Yang, H. (2007). Modeling the role of irrigation in winter wheat yield, crop water productivity, and production in china. Irrig. Sci. 26, pp.21–23.
[17] Loague, K. and Green, R.E. (1991). Statistical and graphical methods for evaluating solute transport models; overview and application. J. Contam. Hydrol. 7, pp.51–73.
[18] Nain, A.S. and Kersebaum, K. Ch. (2007). Calibration and validation of CERES-wheat model for simulating water and nutrients in Germany. In: Kersebaum, K.Ch., et al. (Eds.), Modeling Water and Nutrient Dynamics in Soil–Crop Systems. Springer, pp.161–181.
[19] Pereira, L.S., Paredes, P., Sholpankulov, E.D., Inchenkova, O.P., Teodor, P.R. and Horst, M.G. (2009). Irrigation scheduling strategies for cotton to cope with water scarcity in the Fergana Valley, Central Asia. Agric. Water Manage. 96, pp.723–735.
[20] Raes, D., Steduto, P., Hsiao, T.C. and Fereres, E. (2009). AquaCrop—The FAO Crop Model to Simulate Yield Response to Water: Reference Manual Annexes., www.fao.org/nr/water/aquacrop.html.
[21] Saade, M. (2012). Iraq Agriculture sector note. Food and Agriculture Organization of the United Nations (FAO).
[22] Salazar, O., Wesstrom, I., Youssef, M.A., Wayne, Skaggs, R. and Joel, A. (2009). Evaluation of the DRAINMOD-N II model for predicting nitrogen losses in loamy sand under cultivation in southeast Sweden. Agric. Water Manage. 96, pp.267–281.
[23] Smith, M. (2000). The application of climatic data for planning and management of sustainable rainfed and irrigated crop production. Agric. Forest Meteorol. 103, pp.99–108.
[24] Steduto, P., Hsiao, T.C., Raes, D., Fereres, E. (2009). AquaCrop—the FAO crop model to simulate yield response to water. I. Concepts and principles. Agron. J. 101, pp.426–437.
[25] Valiantzas, J.D. (2013). Simplified forms for the standardized FAO-56 Penman–Monteith reference evapotranspiration using limited weather data. J. Hydrol. 2013, 505, pp.13–23.
[26] Willmott, C.J., Akleson, G.S., Davis, R.E., Feddema, J.J., Klink, K.M., Legates, D.R., Odonnell, J. and Rowe, C.M. (1985). Statistic for the evaluation and comparison of models. J. Geophys. Res. 90, pp.8995–9005.
[27] Woertz, E. (2017). Food security in Iraq: results from quantitative and qualitative surveys. Food Security, 9(3), pp.511-522.