A Review of Evidence for
Corrosion of Copper by water
Research
Authors:2009:30
Michael J. Apted David G. Bennett Timo SaarioTitle: A Review of Evidence for Corrosion of Copper by water. Report number: 2009:30.
Authors: :Michael J. Apted, David G. Bennett, Timo Saario Date: September 2009.
This report concerns a study which has been conducted for the Swedish Radiation Safety Authority, SSM. The conclusions and viewpoints pre-sented in the report are those of the author/authors and do not neces-sarily coincide with those of the SSM.
SSM perspective
Background
The planned spent nuclear fuel repository in Sweden relies on a copper cast iron canister as the primary engineered barrier. The corrosion be-haviour of copper in the expected environment needs to be thoroughly understood as a basis for the post-closure safety analysis. It has been shown that corrosion may indeed be the primary canister degradation process during the utilised assessment period of 1 million years (this period is the longest time for which risk calculations will be needed ac-cording guidelines issued by the Swedish Radiation Safety Authority). Previous analysis work has been based on that copper is corroded during the initial oxic environment as well as by sulphide in groundwater once reducing conditions have been restored. The quantitative analyses of the-se procesthe-ses consider upper-bound amounts of atmospheric oxidation as well as represen-tative sulphide concentrations coupled with the trans-port limitation of the bentonite buffer and of the surrounding bedrock. A group of researchers at the Royal Institute of Technology (Stockholm, Sweden) suggest, based on published experimental results, that disposed canisters will also be corroded by water itself under hydrogen evolution (Gunnar Hultqvist, Peter Szakalos, Gunnar Wikmark).
Purpose of Project
The purpose of the project is to evaluate the findings of the KTH re-search group based on an assessment of their experimental methods and chemical analysis work, thermodynamic models, and a discussion of reaction mecha-nisms as well as comparison with the analogue beha-viour of native copper. As a background, the authors also provide a brief overview of other corro-sion processes and safety assessment signifi-cance.
Results
The authors conclude that the KTH researchers have not convincingly dem-onstrated that copper will indeed be corroded by pure water and that it is in any case very unlikely that this process will be dominant under the reducing chemical conditions that are expected in the re-pository environment. How-ever, the authors do not completely rule out that copper may corrode slowly by extracting oxygen from water in
pure water at atmospheric conditions. They therefore recommend that an independent experimental investigation of the postulated corrosion process should be carried out.
Future work
Additional work connected to corrosion of copper by water itself car-ried out by the Swedish Nuclear Fuel and Waste Management Company (SKB) as well as by the KTH research group should be carefully exami-ned both from the scientific point of view as well as within the safety analysis context.
Project Information
Project manager: Bo Strömberg Project reference: SSM 2009/2262 Project number: 1724
Content
1. Introduction...3
2. Review of Experiments by Szakálos et al. (2007) ...4
2.1 Review of experiments described in Szakálos et al. (2007) ...4
2.2 Possible hypotheses...7
2.3 Thermodynamic perspectives...8
2.4 Reaction rate estimation...11
2.5 Amount of hydrogen generated ...12
Ion pump experiment ...12
Pressure gauge experiment...13
2.6 Apparent activation energy...14
2.7 Dissociation constant of water...15
2.8 Copper metal as a possible hydrogen source ...16
2.9 Solid phase analyses...16
3. Copper Behaviour Under Repository Conditions ...19
3.1 Repository Conditions...19
3.2 Natural analogues of copper under repository conditions...23
3.3 Consideration of Szakálos et al. (2007) study with respect to evidence from natural copper deposits ...25
3.4 Summary of evidence from natural systems regarding the relevance of the results of Szakálos et al. (2007) to actual repository conditions ...26
4. Potential Consequences for the KBS-3 Concept of Copper Corrosion by Water ...27
4.1 Containment times...27
4.2 Safety assessment sensitivity...29
5. Conclusions and Recommendations ...33
References...35
1. Introduction
The Swedish government has decided to merge the Swedish Nuclear Power Inspectorate (SKI) and Swedish Radiation Protection Institute (SSI) into a single new authority, the Swedish Radiation Safety Authority (SSM). This new authority, taking on the roles of its predecessor organisations, will have responsibility for conducting a formal review of a license application for the construction of a spent nuclear fuel repository, which is being developed by the Swedish Nuclear Fuel and Waste Management Company (SKB). To inform its review of SKB’s plans and the associated licence application, the new Authority will take advice from a range of experts, including the Barrier Review, Integration, Tracking and Evaluation group, BRITE, which has been engaged in SKI’s research and regulatory support programme1. SKB refers to its proposals for the disposal of spent nuclear fuel as the KBS-3 concept. The KBS-KBS-3 concept emphasises a system of engineered barriers to isolate and contain the wastes. According to the concept, after 30 to 40 years of interim storage, spent nuclear fuel will be encapsulated in cylindri-cal copper canisters and these will be surrounded by a bentonite clay buffer and disposed of at a depth of about 500 m in crystalline bedrock. The clay is designed to provide mechanical protection for the canisters and to limit the access of groundwater and corrosive substances (e.g., sulphide) to their sur-faces. The bentonite clay may also retard any radionuclides that are released from the canisters, and filter any colloids that may form within the waste. A recently published research study by Szakálos et al. (2007) argues that there may be stronger evidence for copper corrosion in pure water than was previously believed. The study has generated some media attention and concern, given the important role of the copper canister in SKB’s disposal concept for spent fuel. SSM needs to be informed regarding the likelihood and possible consequences of this process and have, therefore, requested the BRITE group to independently review the issue.
At its meeting in November 2007, the BRITE group developed an outline approach for its review that involved addressing three principal questions: Does water corrode copper in the experiments described by Szakálos
et al.?
Could water corrode copper under realistic repository conditions? If water could corrode copper under repository conditions, what might
be the consequences? 1
The BRITE group comprises Mick Apted (Monitor Scientific LLC), David Bennett (Ter-raSalus Limited), Timo Saario (VTT Materials and Building), Göran Sällfors (Chalmers University of Technology), Peter Segle (Inspecta), David Savage (Quintessa Limited).
2. Review of Experiments
by Szakálos et al. (2007)
As noted above for the KBS-3 concept, the copper canister will be in contact with water-saturated bentonite clay, and will undergo some general corro-sion, mainly due to the diffusion-limited transport of dissolved oxygen in the groundwater during the initial, relatively short oxic period after initial re-pository closure and to diffusion-limited transport of dissolved sulphide dur-ing the much longer anoxic, period that will be imposed by the strongly re-ducing environment measured for the candidate repository sites in Sweden (SKB 2006a, R-06-69; SKB 2006b, R-06-70). However, based on mass balance estimates, the total amount of corrosion will not threaten the integ-rity of the canister during the expected 106 year lifetime (further details are provided below – but see also SKB 2006c).
Based on experimental findings described in their recent paper ‘Corrosion of
copper by water’, Szakálos et al. (2007) have proposed, that copper can also
corrode by extracting oxygen from water molecules even under anoxic con-ditions. If true, this process would allow continuous general corrosion to take place during the anoxic period and, according to the authors, would possibly necessitate a refined design for the spent fuel repository.
The analyses presented in this report were performed with the aim of ena-bling a judgement to be made on the scientific basis for the occurrence of the copper corrosion process, and for any possible activity to be launched based on the Szakálos et al. (2007) paper. Additional unpublished information presented by Szakálos and Hultquist (2008) has been considered, but be-cause of gaps in the information provided and a lack of detail, BRITE has not been able to make a definitive review, or come to firm judgments, about this work.
2.1 Review of experiments described in
Szakálos et al.
(2007)
In their paper, Szakálos et al. (2007) describe two different experimental arrangements. In both arrangements a test chamber containing 0.1 mm thick CuOFHC coupons and deionized water is separated from an analysis cham-ber by a 0.1 mm thick Pd-membrane, which is permeable to hydrogen but not to other elements.
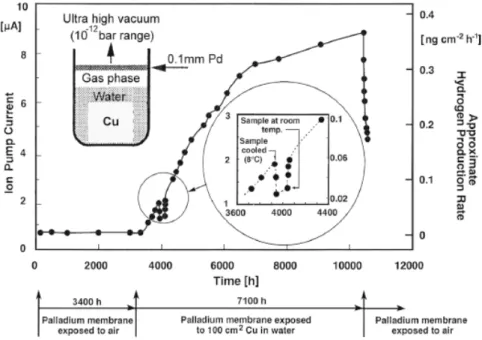
In the first arrangement, ‘the ion pump experiment’ (Figure 2-1), an ultra high vacuum (10-12 bar range) was maintained in the analysis chamber via an ion pump, and the current of the ion pump was used as a measure of the rate of hydrogen flux entering the analysis chamber from the test chamber through the Pd membrane.
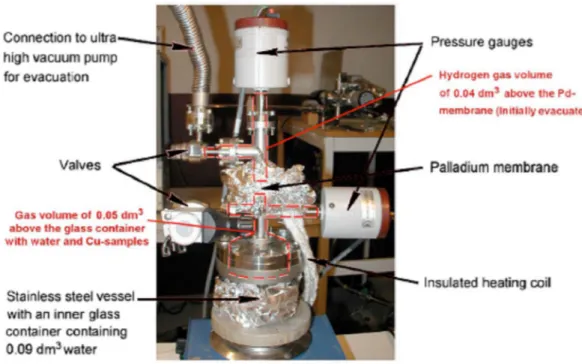
In the second arrangement, ‘the pressure gauge experiment’ (Figures 2-2 and 2-3), after an initial evacuation, the pressure in the analysis chamber was allowed to build up and it was used as the measure of the total amount of hydrogen entering the analysis chamber from the test chamber through the Pd membrane.
Figure 2-1 Test arrangement and results from the ion pump experiment
(Szakálos et al. 2007). The measured ion pump current is pro-portional to the rate of hydrogen permeation through the Pd membrane, which is assumed to correspond to the hydrogen production rate. The temperature was near 20°C, except for 100 h at 8°C.
Figure 2-2 Test arrangement in the pressure gauge experiment (Szakálos et
al. 2007).
Figure 2-3 Results from the pressure gauge experiment (Szakálos et al.
2.2 Possible hypotheses
The main, undisputed result from the Szakálos et al. (2007) experiments is that hydrogen is generated in both the test arrangements. There may be sev-eral hypotheses explaining the source of hydrogen gas. In all of the hy-potheses discussed below, the hydrogen gas is formed by recombination of hydrogen ions on copper surface.
The reaction is (Pourbaix, 1974):
)
(
2
e
H
2g
H
H
(or 2H2O2eH2(g)2OH) (1) The source of electrons is the anodic reaction, which needs to be defined. Below are some alternative hypotheses for the anodic reaction.1) Hypothesis 1: Szakálos et al. (2007) suggest that copper oxidises by
extracting oxygen from water molecules. The suggested surface film composition is HxCuOy. Part of the hydrogen liberated from water molecules recombines to form hydrogen gas. Here the anodic reaction would be oxidation of copper.
2) Hypothesis 2: Copper forms an oxide in air, and also in water with
dissolved oxygen. Also according to Szakálos et al. at least part of the surface film in their experiments was grown by reaction of copper with the remaining oxygen initially in the water. Here the anodic re-action would possibly be that of oxidation of a pre-existing Cu(I)- to Cu(II)-oxide (e.g. Cu2O to Cu(OH)2) via e.g. the reaction
e H OH Cu O H O
Cu2 3 2 2 ( )2 2 2 , and the following re-combination of H+ and e to H2.
3) Hypothesis 3: Water always contains H+ and OH- ions, formed by natural dissociation. One hypothesis is that the recombination of H+ from water dissociation is catalysed by copper surface giving rise to hydrogen gas generation. Here the anodic reaction could be e.g. oxi-dation of dissolved Cu+ to Cu2+ in the water (Cu+ dissolved earlier dur-ing oxide growth in presence of remaindur-ing oxygen), or oxidation of hydroxide ions, 4OH O2 2H2O 4e (the latter would require a high potential, which is not impossible but considered unlikely). 4) Hypothesis 4: Hydrogen gas is formed from hydrogen left in the
cop-per as a result of the manufacturing process.
A fifth hypothesis, assuming that the hydrogen would result from reaction of water with the stainless steel supporting vessel has been, to our understand-ing, adequately dealt with by Szakálos et al., and proven to be negligible.
Below, a detailed discussion is given on possible sources of hydrogen in the given experimental arrangement.
2.3 Thermodynamic perspectives
One may look into the hypothesis of Cu being oxidised by water and form-ing hydrogen gas on basis of thermodynamics. The presumed anodic reac-tion (in general terms) would be
yH
O
Cu
O
H
y
z
H
y
z
e
xCu
2 x y z(
2
)
(
2
)
and with the corresponding cathodic reaction of
)
(
)
2
(
)
2
(
2
)
2
(
2
y
z
H
y
z
e
y
z
H
2g
this would result in the total reaction of
) ( ) 2 ( 2yH2O Cu O H y z H2 g xCu x y z (2)
For Cu(OH)2, i.e. CuxOyHz with x=1, y=z=2 (the only copper hydroxide for which reliable thermodynamic data exists as a function of temperature), the equation for the anodic reaction would become
H
O
Cu
OH
H
e
Cu
2
2(
)
22
2
The corresponding cathodic reaction would then be
)
(
2
2
H
e
H
2g
resulting in hydrogen generation. The total reaction would become
)
(
)
(
2
H
2O
Cu
OH
2H
2g
Cu
(3)In case of chemical and electrochemical reactions at equilibrium, in general terms
0
ln
0
oR
T
M
nFE
Here
o is the standard chemical potential,
is the stoichiometric reaction(fugacity of a gaseous species), n is the number of electrons transferred, F is Faraday’s constant and E0 the equilibrium potential. For the above total reac-tion (n = 0 in case of a chemical reacreac-tion) this equareac-tion becomes
(
(
))
ln
(
)
ln
2
ln
)
0
(ln
))
(
2
)
(
)
(
(
))
(
(
(
2 2 2 2 2 2
O
H
Cu
OH
Cu
g
H
f
T
R
O
H
Cu
OH
Cu
g
H
o o o o
When representing the difference of standard chemical potentials as
o, using312352
)
(
,
12746
)
(
,
492097
)
)
(
(
,
46738
))
(
(
2 2 2
O
H
Cu
OH
Cu
g
H
o o o o
(Jmol-1, calculated for T = 73oC), (Outotec Ltd, 2008), and taking the activi-ties of Cu(OH)2, Cu and H2O as 1, the equation gives
1 2(
))
98615
(
ln
oR
T
f
H
g
Jmol
which, at equilibrium, gives for the hydrogen fugacity f(H2(g)) = 1.3*10
-15
bar. The maximum hydrogen pressure reported by Szakalos et al. has been as high as 10-2 bar, which therefore clearly could not be produced by oxida-tion of Cu with water to Cu(OH)2.
In case of Cu(OH) there is only one reference for the standard chemical po-tential, giving
o 200 kJ/mol(Wagman et al. 1982). A possibleover-all reaction producing Cu(OH) and hydrogen would be
2
2
2
(
)
2
2
Cu
H
O
Cu
OH
H
(4)For this reaction the equilibrium gives,
(
(
))
2
ln
(
)
2
ln
2
ln
)
0
(ln
))
(
2
)
(
2
)
(
(
2
))
(
(
(
2 2 2 2
O
H
Cu
OH
Cu
g
H
f
T
R
O
H
Cu
OH
Cu
g
H
o o o o
Using the same procedure and assumptions as for the Cu(OH)2 case above, the hydrogen fugacity becomes f(H2(g)) = 1.8*10-18 bar. Even with the
pos-sible unreliability in the standard chemical potential value for Cu(OH), it is very much unlikely that the hydrogen pressure reported by Szakalos et al. could have been produced by oxidation of Cu with water to Cu(OH). For the cathodic reaction,
)
(
2
which is an electrochemical reaction (with n = 2), and using
E
00nF
o
the equilibrium condition becomes:
( ( ))
log 15 . 1 3 . 2 ) )) ( ( log log 2 ( 2 3 . 2 ) )) ( ( ln ln 2 ( 2 2 2 2 g H f F RT pH F RT E g H f H F RT E g H f H F RT E E o o o o o o o Using0
2
))
(
2
)
(
2
))
(
(
(
2
F
e
H
g
H
E
o o o o o
results (at 73oC) in
( ( ))
log 0343 . 0 0686 . 0 pH f H2 g Eoo Thus, increasing pH or hydrogen gas fugacity tends to decrease the equilib-rium potential. Assuming a nearly neutral pH = 6.5 (distilled water with some acidification through dissolved carbon dioxide) and f(H2(g)) = 10
-3 bar results in an equilibrium potential of Eo 0.343 V vs SHE. Because Szakalos et al. experimental arrangement did not include measurement of potential this calculated value can not be compared with an experimental one.
At very low concentrations of Cu+2 –ions in water, the copper dissolution reaction,
)
(
2
H
Cu
2H
2g
Cu
(6)becomes thermodynamically feasible at near neutral pH. For this reaction one may write
(
(
))
ln
(
)
ln
2
ln
0
(ln
))
(
2
)
(
)
(
))
(
(
(
2 2 2 2
H
Cu
Cu
g
H
f
T
R
H
Cu
Cu
g
H
o o o o
With the proper thermodynamic values (at 73oC) this reaction results in
(
(
))
log
2
log
9
.
8
log
2
2
H
Cu
g
H
f
Taking(
2(
))
10
3
g
H
f
and assuming pH (= –log[H+]) = 6.5, one arrives at [Cu2+] = 10-19 M. At concentrations higher than this, hydrogen generation via this reaction becomes thermodynamically unfavoured. Although copper ion concentrations were not reported by Szakaloz et al., it is highly unlikely that such extremely low concentrations of Cu2+ would prevail in any test vessel with copper exposed to water.It is good to recognise here that thermodynamic calculations are based on measured values of enthalpy and entropy of formation of species (like Cu2O and H2O). As there are no measured values for the proposed HxCuOy solid phase (unless x and y are 1 or 2), one can not make any calculations for it. This does not, however, prove that such species could not exist (one hundred years ago no measured values were available for most of the solid phases we now know well). Thus, one can not solely use thermodynamic grounds to eliminate the Szakálos et al. (2007) interpretation of their results, although these analyses indicate that available thermodynamic data do not seem to support their hypothesis.
2.4 Reaction rate estimation
In the ion-pump experiment (Figure 2-1) the ion pump current (considered to be equal to the generation rate of hydrogen) increases linearly for about 3500 hrs and then continues with a lower rate of linear increase for another 3000 hrs. Thus, one is led to imagine a metal oxidation process that accelerates when the reaction proceeds and the surface film on the metal is growing thicker. This is quite the contrary of the normal finding that reaction rate decreases as the result of film formation. Typically (e.g., Feng et al. 1996) one finds a near-parabolic rate of film growth and reaction product formation (e.g., hydrogen in reaction (3)) according to the formula:
t A
d (7)
where d is the thickness of the reaction product layer, A is constant (related to the diffusion resistance of the film) and t is time. The close to parabolic dependence is a result of a diffusion process that transfers reactants (typi-cally oxygen bearing species) through the existing layer to the metal/oxide interface, and/or cations (metal ions) from the metal/oxide interface to the oxide/water interface. Thus, a thicker layer results in a longer diffusion route and a decreasing reaction rate. In corrosion science it is common to talk about passivation of a material, where passivation is a direct conse-quence of formation of a surface layer which slows down the diffusion of species involved.
In the pressure gauge experiment, the hydrogen pressure was measured as a function of time. Using the ideal gas law:
T R n V
p (8) the rate of hydrogen production can be estimated as:
V T V T t p T R V t n , , ( ) ) ( (9)
and, thus, the slope of the curve shown in Figure 2-3 at each temperature gives the hydrogen production rate. The data shown in Figure 2-3, for 62°C,
also indicate that in this test arrangement the reaction rate (slope) increases as a function of time for the first about 400 hrs (from t = 1300 to t = 1700 hrs). It is also clear that towards the end of the exposure at 62°C, the reac-tion rate slows down, producing a sigmoidal type of pressure – time depend-ence. It would appear as if there is a limiting hydrogen pressure of about 0.5 mbar at 62°C at which the reaction approaches equilibrium. An accelerating reaction rate as a function of time would be typical for a catalytic reaction, such as hydrogen recombination catalysed by copper surface. Szakálos and Hultquist (2008) explained the increasing reaction rate by postulating a dete-riorating diffusion resistance of the film as a function of time, caused by hydrogen entering the metal through the film. This hypothesis might also be possible, although no confirmatory evidence for such a surface-film evolu-tion has been provided, nor have any quantitative analyses been presented by Szakálos et al. to substantiate their postulate. Indeed, the experience with growing oxide layers on metals is contrary to the authors’ postulate, because such layers typically evolve toward greater thickness, crystallinity and effec-tiveness in diffusion resistance over time.
2.5 Amount of hydrogen generated
Ion pump experiment
The average hydrogen generation rate in the ion pump experiment was about 0.25 ngcm-2h-1 (Figure 2-1). The total amount of H2 generated during the 7000 hr exposure, thus, becomes 1.8 µgcm-2, which corresponds to 0.9 x 10⁻⁶ molcm-2 of H2. The total amount of hydrogen, if calculated for the total ex-posed surface area, i.e. 150 cm2, becomes 1.35 x 10⁻⁴ mol. Assuming that the molar volume of the presumed HxCuOy oxide film would be close to that of Cu(OH)2, i.e. Vm = 0.0345 mol/cm
3
, the film thickness then becomes 2.6 x 10⁻⁵ cm, i.e. 0.26 µm2. This would correspond to an assumed film thick-ness growth rate of 0.33 µm/y. According to equation (2) for each mol of H2 produced two mols of Cu are consumed, whereas for equation (4) and equa-tion (6) only one mol of Cu would be consumed. Taking the molar weight of Cu as 63.54 g/mol, and the density of Cu as 8.96 g/cm3, the 1.35 x 10⁻⁴ mol of Cu equates to an assumed corrosion rate of 0.08 µm/y.
From another point of view, the 0.9 x 10⁻⁶ molcm-2 of H2, if assumed to be formed as a result of Cu(I) oxidation in the pre-existing film according to the reaction: e H OH Cu O H O Cu2 3 2 2 ( )2 2 2 (10)
would correspond to the same molar amount of Cu2O, which again would correspond to an assumed thickness of 0.21 µm of Cu2O transformed to Cu(OH)2. Thus, with regard to the second hypothesis, the pre-existing film that formed while dissolved oxygen was present, would need to have had a
2
Cupric hydroxide, Cu(OH)2, is assumed for convenience because of the absence of
molar volume data for the more appropriate cuprous hydroxide, CuOH, which is the closer known equivalent to the proposed HxCuOy phase.
thickness of clearly more than 0.21 µm in order to accommodate a sub-layer of Cu2O of such thickness. This may be possible, as the test vessel was not evacuated at the beginning of the test.
Of course, there could be a steady state between film growth at the Cu/film interface and film dissolution at the outer interface according e.g. to the reac-tions: 2 2 2 2 ( ) 2 2 aq aq CuOH H Cu H O Cu OH H Cu H O (11) These reactions will however generate Cu ions in the solution. Unfortu-nately the concentration of dissolved copper was not reported by Szakálos et
al. for this particular test.
Pressure gauge experiment
From the ideal gas law the amount of gas becomes:
T R V p n (12) Substituting the values from the second experiment at 62°C (i.e. V = 0.04 dm3, p = 0.5 mbar) one arrives at n(H2) = 7.2 x 10⁻⁷ mol as the total moles of H2 evolved within the 900 hr exposure time. With the same assumptions (and cautions) as above (i.e., the molar volume of the presumed HxCuOy oxide film would be the same as that of Cu(OH)2, i.e. Vm = 0.0345 mol/cm
3 ) one arrives at a total volume of the presumed oxide of 2.1 x 10⁻⁵ cm3. Using the exposed surface area of 150 cm2, the assumed layer thickness would become 1.4 x 10⁻⁹ m, i.e. 1.4 nm, corresponding to an assumed film thick-ness growth rate of 0.013 µm/y. Similarly to above, for 7.2 x 10⁻⁷ mol of Cu, the assumed corrosion rate3 would become 0.0004 µm/y.
Based on the above estimates of the total amount of hydrogen detected in the two test arrangements, the reaction rate is very different - about forty times lower for the pressure gauge experiment, which was performed at higher temperature. This would indicate that the reactions in the two experiments were different or that the rate determining step was different. Another pos-sible explanation would be that the reaction had not yet reached a steady state, at least in the pressure gauge experiment (900 hrs), which would in-validate the above comparison. A possible reason for not reaching a steady state in hydrogen production would be that a considerable amount of hydro-gen, in the early stage at least, was transported (by diffusion) into the copper metal and, thus, the amount of hydrogen in the gas phase would be only a part of the total amount.
3
In making both of the corrosion rate estimates it has, for simplicity, been assumed that no hydrogen enters the copper metal – because of thissimplification it is acknowledged that the estimatespresented here may slightly underestimate the apparent corrosion rate.
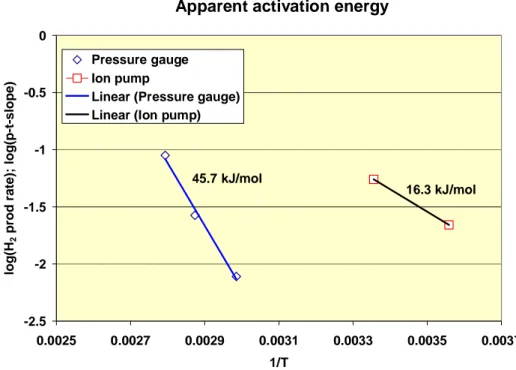
2.6 Apparent activation energy
One way of trying to clarify the source of hydrogen is to look at the apparent activation energy of the process. From Figure 2-3 in the Szakálos et al. (2007) paper (reproduced as Figure 2-3 in this report) one may attempt to determine the apparent activation energy of the process responsible for hy-drogen generation. Plotting the logarithm of the slopes of H2 pressure vs. time curve (defined at the three different temperatures studied) vs 1/T gives an apparent activation energy of about 46 kJmol-1, Figure 2-4. This value is rather uncertain, as the trend of data points at temperatures higher than 62°C are rather difficult to track from the figure. The result from the ion pump experiment, reproduced as Figure 2-1 in this report, contains data at room temperature (20°C) and at 8°C. Plotting these two data points (hydrogen production rate) vs 1/T results in an apparent activation energy of 16 kJmol-1 (Figure 2-4).
The two estimated apparent activation energies are quite different, indicating that the process in question may be different at room temperature and at ambient temperature, or that the rate limiting step is different. The lower apparent activation energy at room temperature is consistent with much higher estimated reaction rate estimated above for this temperature. Below are some activation energies for relevant processes, to be compared with the activation energies in Figure 2-4:
Diffusion of both protons and uncharged hydrogen in water are rela-tively fast. The activation energy for these processes is between 11 and 16 kJmol-1 (Roduner 2005).
The activation energy for copper corrosion in 3.5% NaCl containing neutral water is 39 kJmol-1 (Otmacic and Stupnisek-Lisac 2003). The activation energy of Cu2O dissolution is 40 kJ mol
-1
(King et al. 2001).
Based on the above analysis it would seem plausible that the activation en-ergy derived for the higher temperature tests of Szakálos et al. (i.e. the pres-sure chamber test) is near that for dissolution of Cu or Cu2O, whereas for the lower temperature tests (i.e. the ion pump experiment) the activation energy is more similar to that for a diffusion in water-based process.
Apparent activation energy -2.5 -2 -1.5 -1 -0.5 0 0.0025 0.0027 0.0029 0.0031 0.0033 0.0035 0.0037 1/T lo g (H 2 p ro d r a te ); lo g (p -t-s lo p e ) Pressure gauge Ion pump
Linear (Pressure gauge) Linear (Ion pump)
45.7 kJ/mol
16.3 kJ/mol
Figure 2-4 Apparent activation energy estimated for the results from the
two experimental arrangements in Szakálos et al. (2007) paper.
2.7 Dissociation constant of water
The dissociation of water by reaction H2O = OH- + H+ has an equilibrium constant at room temperature given by:
14 2 10 O H H OH Keq (13) From this equation, bearing in mind that the concentrations of hydroxide ion and hydrogen ion are equal, and that
H
2O
1
, the pH of neutral water becomes pH log(
OH
H ) = 7, and [H+] = 10-7 mol dm-3. For the ion pump experiment with a test cell volume of 0.1 dm3, the amount of H+ in the water would be 10-8 mol. For the pressure gauge experiment with a test cell volume of 0.09 dm3 and a temperature of 62°C, the amount of H+ in the water would be about 3 x 10⁻⁸ mol. This is because the dissociation con-stant for water increases as a function of temperature. The H+ concentration will remain at the same level because water has a large capacity to replenish the H+ concentration (there is 5 mol H2O in 0.09 dm3
of water). Removing H+ exclusively (e.g. by copper catalysing H+ recombination and H2 passing through the Pd membrane) would possibly be expected to result in an in-crease of pH. An amount of 10-6 mol of H2 would then be expected to result in an increase of pH from 7 to 8, and 10-5 mol of H2 a further increase of pH
from 8 to 9. Thus, the amounts of H2 generated in both the tests reported in the Szakálos et al. (2007) paper were probably too small to result in a no-ticeable increase of pH, supposing that Hypothesis #3 would be correct.
2.8 Copper metal as a possible hydrogen
source
During manufacture, copper is annealed in a hydrogen atmosphere, during which an appreciable amount of hydrogen can enter copper metal. Accord-ing to Gdowski and Bullen (1998), the amount of hydrogen could be be-tween 1 and 2.5 cm3 per 100 g of copper. From the ideal gas law, using m(Cu) = 8.93 g (Wagman, et al. 1982), this amounts to n = 7 x 10⁻⁷mol, which is the same amount estimated above as the total amount of hydrogen from the pressure gauge experiment. However, the estimated total amount of hydrogen in the ion pump experiment is higher by two orders of magni-tude and, thus, could not be the result of initial hydrogen in the copper metal. Therefore, it seems that Hypothesis #4 can be rejected as the full explana-tion.
2.9 Solid phase analyses
There is unfortunate vagueness and imprecision in the measurements and solids characterization reported in Szakálos et al. (2007) that raise issues regarding the authors’ interpretations of their tests. These issues include: SIMS analysis: The reported secondary-ion mass spectrometry
(SIMS) results seem problematic in several respects. The method and location of the SIMS analyses on the copper specimens are not clearly reported. It seems from Figure 2 of Szakálos et al. (2007)4 that the re-ported “CuO” species is more abundant in the anoxic-water sample than in the in the oxic-water sample, but this surprising result is not explained. A more thorough set of SIMS analyses might have in-cluded analysis of various copper oxides and hydroxides, as well as H2-impregnated copper, contacted by the same water types. Such an array of samples would provide a more complete calibration set of possible ‘model’ surface species in the system Cu-O-H. It is also un-fortunate that Szakálos et al. (2007) does not include an error analysis of SIMS (or other measurement) results which would allow an inde-pendent judgment on whether the stoichiometry asserted by the au-thors is both reasonable and unique.
Powder XRD analysis: The use of x-ray diffraction (XRD) as a
diag-nostic tool seems rather wishful thinking on the part of the authors. The size and thickness of the surface “layers” would seem to be too
4
small for this technique. Furthermore, XRD detects well-ordered crystalline phases, but is insensitive to poorly crystalline or amor-phous phases as might be occurring in these tests. Even with abun-dant, crystalline material, the resolution of XRD is often >5 weight percent, whereas the speculative surface phase(s) described in Szakálos et al. (2007) would be expected to be far below this resolu-tion value. The authors rely strongly (page C65 of Szakálos et al. 2007) on the absence of detectable hydroxide species by XRD, but this measurement only sets an upper limit of several weight percent, and does not prove their inference of 0% copper-hydroxides. Also, it is not clear how Szakálos et al. prepared samples for the reported “powder diffraction analysis”; certainly the mechanical energy im-parted by grinding a metal sample with possible O-H bearing surface layer phase could easily lead to alteration of existing, and/or genera-tion of, new phases. We consider that there may be better alternative x-ray methods (e.g., small-angle scattering, EXAFS) and/or other techniques that could be used to examine the composition and charac-teristics of the surface phases in situ, and without grinding of test samples.
HxCuOy phase: Vague and imprecise terms are used by Szakálos et
al. (2007) in their discussion of this previously unknown solid phase:
- ‘…this indicates H is in an unusual position in the solid prod-uct…’ It is not clear if the authors mean uncharged, atomic
hy-drogen by their use of the symbol “H”, and what is the meaning of ‘unusual position’ in terms of chemical bonding.
- ‘…it seems most likely that hydrogen is associated with copper ions and/or copper vacancies in the copper oxide crystals…’
Again, the form of the hydrogen and the chemical bonding / thermodynamic meaning of ‘associated’ is imprecise. Also, there does not seem to be any reported data by which the au-thors’ can justfy their speculations on hydrogen being associ-ated with Cu ions and/or Cu vacancies.
- ‘…copper-modified zeolites have been shown to adsorb/absorb hydrogen unusually strong [sic] due to the interaction of copper ions.’ There is no technical foundation presented by the
au-thors for assuming that atomic hydrogen adsorbed/absorbed onto charged copper ions within separated cage-position of zeo-lites is a relevant model compound to the proposed HxCuOy phase.
- ‘…where the average values of both x and y seem to be close to unity, at least after extended exposure times.’ It is not clear if
the authors are implying that the there is a continuum in compo-sitions of the proposed HxCuOy phase over the time scale of several months, or that initial phases are metastable and are re-placed over time by increasingly more thermodynamically sta-ble phases within the general set of HxCuOy-type phases. If x
and y tend to 1 over the several months of their experiment, this leaves open the possibility that x and y tend to even higher val-ues (maybe x = y = 2) over longer (e.g., repository-relevant) time scales.
Taken together, these imprecise measurements and vague statements regard-ing the nature of the solid phase raise the fundamental issue of whether the hydrogen (in whatever form) is actually chemically bonded with copper to form a single, thermodynamically meaningful discrete HxCuOy phase, whether hydrogen is occurring as hydroxyl groups bonded to the copper, or whether hydrogen is physically associated with copper-oxide on the surface of the copper, basically as two separate phases.
3. Copper Behaviour Under
Repository Conditions
3.1 Repository Conditions
Even if the results from Szakálos et al. (2007) were construed to support corrosion of copper under their test conditions, it is important to consider whether the same copper corrosion reaction would occur under repository conditions. The experimental conditions for the Szakálos et al. (2007) tests ranged from 8˚C to 73˚C and 1 bar total system pressure (hence, 1 bar water pressure, PH2O), whereas the planned Swedish repository is at a depth of
per-haps 300 to 700 meters depth, corresponding to a total system pressure (PH2O) of between 30 and 70 bars. Total system pressure does matter in terms of thermodynamic relationships, especially for reactions involving volatiles species, and also for the behavior of redox-sensitive elements (in-cluding copper) that are affected by the chemical potentials (partial pres-sures) of redox-active species in aqueous solutions, such as H2 and O2. A review of redox theory and measurement is beyond the scope of this re-view, but the concepts are well established and are presented in various text-books (Garrels and Christ, 1965; Stumm and Morgan, 1996; Langmuir, 1997). A common representation of redox behavior in aqueous systems is the use of the redox potential (Eh, in millivolts relative to standard hydrogen
electrode, SHE), where at 25˚C and 1 bar pressure, the following
relation-ship can be made (Langmuir, 1997):
pH P
Eh –0.0296log H 0.0592
2
(14)
where PH2 is the partial pressure of hydrogen in the system and pH is the
conventional representation of the negative log of the dissolved hydrogen-ion activity. Figure 3-1 shows the stability field for water as a functhydrogen-ion of Eh and pH at 25˚C and 1 bar pressure. Note the cross-hatched region repre-sents the range in Eh-pH conditions for water where the dissolved oxygen concentration is at or above a detection threshold of 5 µg/L. Some research-ers call this the “oxic” region and the region below the cross-hatched area the “anoxic” region. As will be shown in subsequent sections, however, many oxide compounds of redox-sensitive elements (including copper) are stable to Eh values far into the ‘anoxic” region. This makes this
“oxic/anoxic” distinction less useful, and even misleading, when discussing actual geological systems.
A basic principle of thermodynamics is that the chemical potential (partial pressure) of volatile species, such as water, O2, H2, CO2, H2S, CH4, etc., can be a direct function of total system pressure. For an aqueous system at 1 bar total pressure, the maximum possible partial pressure of O2 or H2 is 1 bar
(see Figure 3-1); for a system at 50 bars total pressure, the maximum possi-ble partial pressure of O2 (PO2) or H2 (PH2) is 50 bars. The effect of total
system pressure on chemical potential (partial pressure) of volatiles is par-ticularly important for reactions involving volatiles, such as evolution of hydrogen, hydration/ dehydration, or carbonation/ decarbonation. Increased H2O pressure, for example, favours the formation and thermodynamic stabil-ity of hydrated phases over compositionally equivalent non-hydrated phases + water.
Figure 3-1 Stability field for water as a function of Eh and pH at 25˚C and
1 bar pressure (modified from Langmuir, 1997). Cross-hatched area is the ‘oxic’ region, with dissolved O2 at or above a detec-tion limit of 5 µg/l.
Consideration of elevated system pressure, hence elevated partial pressure of equilibrated volatile species (e.g., such as O2 and H2 in aqueous systems), is also important from the perspective of the LeChatelier Principle. For an aqueous reaction that evolves a volatile species (e.g., A B + H2), having an elevated existing partial pressure of the evolved volatile species in a sys-tem (i.e., elevated PH2) will cause the reaction to shift to the left-hand side
compared to the same reaction in a system with a lower PH2.
For the candidate repository sites in Sweden, numerous in situ measurements of both pH and Eh have been made (SKB 2006a; 2006b). In general, for all alumino-silicate rocks (including granite, basalt, gabbro, most metamorphic rocks, many sedimentary rocks) pH is buffered by hydrolysis reactions
among aluminosilicate minerals and calcite (Giggenbach, 1991; Savage et
al., 1999). For the same array of rock types, the Eh is buffered by a ‘redox
pair’, consisting of a more reduced (e.g., FeS2) and a more oxidized (e.g., Fe2O35) pair of minerals sharing a redox-active component (e.g., Fe2+/Fe3+). Essentially the same pH and Eh buffering minerals occur for igneous rocks such as granites and basalt, as well as for iron-bearing, aluminosilicate metamorphic and sedimentary rocks.
Figure 3-2 shows a conventional Eh-pH diagram for such rock systems for the purpose of illustrating several key points. The approximate measured range of pH and Eh values for Swedish granites is also shown, confirming that active redox and pH buffering is occurring in such deep rock-water sys-tems. In particular, Eh is controlled by reaction between several possible phases containing oxidized and reduced forms of iron (SKB 2006a; 2006b). Also note the extremely low Eh values for a deep geological repository in granite compared to the “oxic-anoxic” boundary in Figure 3-1. Waters that may be termed “anoxic” because there is no detectable O2 can represent Eh values that are 900 millivolts (SHE) more oxidizing than the actual ground-water of a repository for a given pH value. Thus, ‘oxic’ and ‘anoxic’ are rather vague and imprecise terms and should be either avoided or carefully defined.
5
Different oxidized ferric oxide and hydroxide phases of different degrees of crystallinity (hence, different thermodynamic stability) may form and persist in natural systems.
Fe
2O
3Fe(OH)
3Reported environments
for deep SKB granites
Figure 3-2 Example of phase equilibrium relationships between possible
Eh-buffering minerals in the system Fe-O-H-S (modified from Garrels and Christ, 1965). The impact of formation of the less stable “Ferric Hydroxide” [Fe(OH)3] phase as an alternative to Fe2O3 is shown by the dashed lines. Red shaded area is range in Eh-pH conditions observed at repository depth for the candidate Swedish sites from reported measurements (SKB, 2006a, b).
3.2 Natural analogues of copper under
reposi-tory conditions
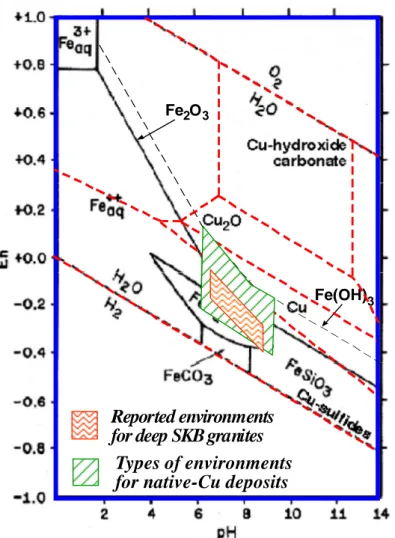
Turning now to natural systems in which the copper occurs as a major, rather than minor, component, there are numerous examples of native copper, cop-per oxides, copcop-per sulfides, and copcop-per carbonates that form ore-quality de-posits in all types of host rocks (Johnson and Francis, 1980; Miller et al., 1994), including both in granite (e.g., Marcos, 1989; Marcos and Ahonen, 1999) and in clay-based rock (e.g., Milodowski et al., 2002). An equilib-rium phase diagram based on thermodynamic properties of common copper-phases known in nature (Garrels and Christ, 1965; see also Beverskog and Puigdomènech, 1995) is presented in Figure 3-3.
Fe 2O3
Fe(OH)3
Reported environments
for deep SKB granites
Types of environments
for native-Cu deposits
Figure 3-3 Phase equilibrium relationships (red dashed lines) between
pos-sible Eh-buffering minerals in the system Cu-O-H-S-C for PCO2
= 10–3.5 bars and a total dissolved sulfur species = 10–1 m (modi-fied from Garrels and Christ, 1965). Swedish granite data from SKB (2006a, b). The green cross-hatched area is inferred from data reported by Brown (2006).
There are several insights to be drawn from Figure 3-3. First is that elevated activities of volatile species such as H2S and CO2 (as well as other solution species such as Cl– and NH4+) can lead to the formation of non-oxide and non-hydroxide compounds of copper. A thorough analysis has been made of the effects of chemical and physical parameters (e.g., temperature) on the thermodynamic stability of metallic copper and other copper phases ob-served in nature, and especially the extent of the metallic copper stability field for repository-relevant Eh and pH conditions (Bath and Hermansson, 2009). This complexity in stability of various copper phases, including na-tive metallic copper, as a function of environmental factors indicates the importance of conducting tests with solutions that closely simulate actual repository compositions if the tests are intended to be relevant to the per-formance of copper canisters in a repository.
Second, note in Figure 3-3 that the stability field of copper metal (Cu0) is strongly attenuated in the presence of reduced sulfur species, with chal-cocite, Cu2S, favoured for the reducing conditions of the deep Swedish gran-ites. This exact behavior is observed in granites containing native copper (e.g., Marcos and Ahonen, 1999). Such thermodynamic instability of copper with respect to a copper-sulfide phase does not undermine the extreme lon-gevity of copper as a canister material in the KBS-3 concept. This is be-cause the actual corrosion rate of the copper is assumed by SKB (SKB, 2006c) to be equal to the rate of diffusive mass-transport of sulfide (or dis-solved O2 for a limited time after emplacement in a repository) through the low-permeability, compacted-clay buffer. The copper is assumed to react instantaneously with the corrodants as it arrives at the copper canister sur-face. As the following section will argue, this diffusion-controlled corrosion rate is extremely slow, leading to exceptionally long containment times (>105 years) if the buffer system is not perturbed.
Third, among the various types of copper-ore deposits, there is wide-spread occurrence in diverse rock types of so-called ‘native-copper’ deposits, in which metallic copper is found in massive habit at concentrations many or-ders of magnitude above its primordial concentration in primary magmatic source rocks (e.g., Miller et al., 1994; Marcos, N. 1989; Marcos and Aho-nen, 1999; Milodowski et al., 2002; Brown, 2006). While a full review of the formation of such native copper deposits is beyond the scope of this re-view (see Bath and Hermansson, 2009), it is important to note that in agree-ment with known thermodynamic stability relationships of copper phases as shown in Figure 3-3, metallic copper is found to form in nature. In contrast, there is no known reported occurrence of the HxCuOy phase postulated by Szakálos et al. (2007) to form under relevant Eh-pH conditions of a reposi-tory.
3.3 Consideration of Szakálos et al. (2007)
study with respect to evidence from natural
copper deposits
It is the not just the formation of native copper deposits, however, that is revealing with respect consideration of the relevance of the Szakálos et al. (2007) study, but also the persistence of such native copper under conditions closely similar to Swedish repository sites. Take for example, the famous massive native copper deposits in basalt of Keweenaw, Michigan USA, which are approximately 1100 million years old (Brown, 2006). Several cases can be considered regarding the absence of evidence for the HxCuOy compound proposed by Szakálos et al. (2007) for repository-relevant condi-tions.
1) Case 1 - HxCuOy compound is thermodynamically metastable
with respect to Cu0: Mineralogical and crystallographic analyses
confirm that the current native copper was deposited as metallic copper, and is not a pseudomorphic replacement of some earlier copper compound, such as the HxCuOy compound of Szakálos et
al. (2007). Therefore, it cannot be credibly argued that HxCuOy formed first as a meta-stable compound that was later replaced by more stable Cu0 under repository-relevant Eh-pH-temperature conditions.
2) Case 2 - HxCuOy compound is thermodynamically stable with
respect to Cu0: If the initially deposited (and currently present)
metallic copper were metastable with respect HxCuOy in the pres-ence of water, then there should be evidpres-ence for such corrosion reaction over the intervening 1100 million years. There is, how-ever, no evidence for any alteration rinds of copper metal where encompassed by Keweenaw basalt (i.e., not directly exposed to the atmosphere or penetrating aerobic meteoric water). At the rates of corrosion indicted by the results of Szakálos et al. (2007) (see above) virtually the entire deposit would have converted to HxCuOy. Even if the initial native copper only was contacted by groundwater for the most recent 100,000-year period of glacia-tion that is known to have covered these deposits, then corrosion rinds of HxCuOy up to 8-mm thick should be evident. There is no such evidence, indicating that HxCuOy does not form as a stable corrosion product of native copper under repository-relevant conditions.
3.4 Summary of evidence from natural systems
regarding the relevance of the results of
Szakálos et al. (2007) to actual repository
con-ditions
In summary, the formation and chemical form of copper phases in nature, whether metallic copper or copper sulphides or oxides, depends on the chemical potential or activity of various solutions species, such as chloride, sulfide, carbonate, etc., as well as Eh, pH, temperature and total system pres-sure. Most copper occurs in crustal rocks as a disseminated trace element in common alumino-silicate minerals, or as concentrated economic ores of copper- sulfides and copper oxides/ hydroxides. The formation of native metallic copper deposits is much scarcer, although as noted there are numer-ous examples of native metallic copper forming in a wide range of different host rocks, including granite.
The environmental conditions for the occurrence of native copper overlap with those expected in a repository at depth in granite. However, it must be noted that previous estimates of longevity of copper canisters by SKB do not rely on the ‘nobility’ of copper, but on the diffusive mass-transport rate to the copper surface of reactants through the compacted bentonite-clay buffer surrounding the canister.
What is completely absent from the geological record, however, is any re-ported occurrence of the “HxCuOy” phase speculated by Szakálos et al. (2007). It seems extremely unlikely that mineralogists and economic geolo-gists have simply missed this “HxCuOy” phase over centuries of study on one of the most economically valuable and well-studied metals.
If the absence of evidence in nature for the formation of a “HxCuOy” phase is not sufficiently compelling evidence against the relevance of the Szakálos et
al. (2007) results to the behaviour of copper canisters under expected
reposi-tory conditions, the persistence of native metallic copper contacted by water under anaerobic conditions for many millions of years would seem to refute the relevance to a geological repository of the Szakálos et al. (2007) results (which are from experiments conducted with pure water at 1 bar pressure and at room temperature). There is no independent evidence for copper cor-rosion by water for naturally occurring metallic copper under repository-relevant conditions (PH2O = 30-50 bars, external buffering of Eh and pH by
mineral-H2O reactions in granite and clay). Furthermore, any inferences that the HxCuOy phase proposed by Szakálos et al. (2007) might be either a tastable phase or a ‘slowly-formed’ stable phase with respect to natural me-tallic copper are also unsupported by natural system examples.
4. Potential Consequences
for the KBS-3 Concept of
Copper Corrosion by Water
4.1 Containment times
As noted above, in the SKB concept, long-term containment of radioactive waste by copper canisters does not rely on whether the copper is the stable phase under repository conditions, or on the kinetic rate of copper reactions with corrodants. Instead, the extremely long (106 years or longer) lifetime estimated by SKB for the 5-cm thick copper canister is based on the diffu-sive transport rate of corrodants through the 35-cm thick, low-permeability, clay-based buffer.
Given the prevailing thermodynamic understanding of the aqueous Cu-O-H-S-C system and the measured Eh-pH conditions of proposed granitic sites in Sweden, SKB assumes that only reduced sulfide species (HS– or S2–) can act as a corrodant to copper (SKB, 2006c). The rate of corrosion of copper by sulfide-species is expected to be limited by the rate of supply of the corro-dant to the copper surface. An estimate of the steady-state,
diffusion-controlled corrosion rate of copper canister can be made using a well-proven mass-transfer equation:
1 0
0 1ln
2
r
r
c
c
LD
M
(15)where (see SKB, 2006c for parameter values):
M = is the diffusive mass-transport rate of sulfide to the canister surface (moles/year).
L = is the length of the canister = 480 cm.
D = the diffusion coefficient of the corrodant through the buffer = 10–5 cm2/sec.
c1 = the concentration of the corrodants at the canister surface = 0 c0 = the concentration of the corrodant at the rock-buffer interface = 10
– 8
moles S2–/cm3.
r1 = is the radius of the canister = 52.5 cm.
r0 = is the radius of the rock-buffer interface = 87.5 cm. r0–r1 = buffer thickness = 35 cm.
The diffusive mass-transport rate of sulfide to the canister surface by this analysis is 1.9 x 10⁻² moles/year. Since one mole of sulfide will react with two moles of copper to produce chalcocite, the effective corrosion rate
im-posed by diffusion of sulfide is 3.8 x 10⁻² moles of copper/year. For a cop-per density of 8.93 gm/cm3 and assuming all of the sulfide is uniformly dis-tributed around the canister surface, the resulting steady-state corrosion rate of the canister would be 0.015 µm/year, leading to penetration of the 5-cm thick canister in slightly over one million years.
By comparison, if it is assumed that copper dissolves as Cu(I), at the fastest rate implied by Szakálos et al. (0.08 µm/year), this would lead to penetration of a 5-cm thick canister in ~625,000 years.
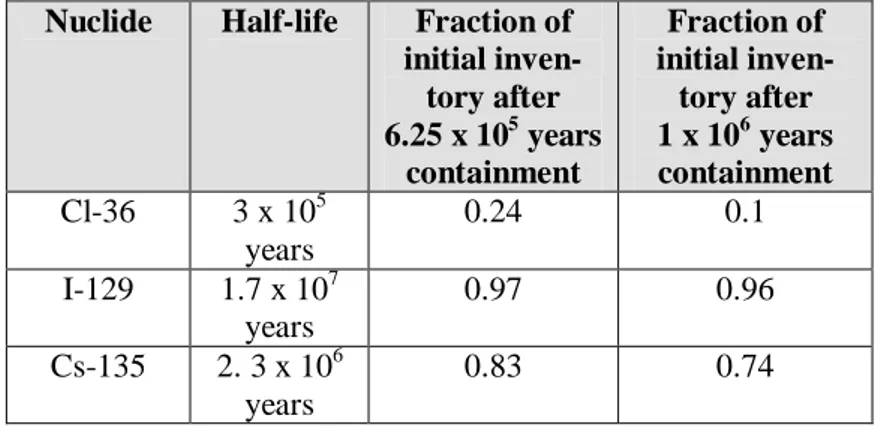
Table 4-1. Effect of various canister containment times on reduction in
ini-tial inventory of some highly soluble, key dose-contributing ra-dionuclides.
Nuclide Half-life Fraction of initial inven-tory after 6.25 x 10⁵ years containment Fraction of initial inven-tory after 1 x 10⁶ years containment Cl-36 3 x 10⁵ years 0.24 0.1 I-129 1.7 x 10⁷ years 0.97 0.96 Cs-135 2. 3 x 10⁶ years 0.83 0.74
Note, however, that SSM’s regulations only require strict comparison with the risk criterion during the first 100,000 years after repository closure. Therefore, the inferred corrosion rate from Szakálos et al., (2007) would not lead to an adverse impact on the 100,000 year regulatory safety compliance, as presented for example in SKB (2006c).
Detailed consideration of the post-100,000 year regulatory perspectives and interpretations on regulatory compliance in Sweden are beyond the scope of this review. The simplified analyses presented here (simplified in that, for example, they do not account for site-specific conditions) suggest that there would be no significant impact on post-100,000 year safety, even if the rosion mechanism proposed by Szakálos et al. (2007) were found to be cor-rect. However, if shown to occur, such corrosion processes might still need to be considered in the safety assessment for the longer period beyond 100 000 years (up to 1 million year), which is analysed in order to explore re-pository performance.
The quantitative impact of a canister lasting 1 million years versus 625,000 years can be explored using a simple mathematical relationship that consid-ers the decay of key, dose-contributing radionuclides.
In Section 10.5 of SKB (2006c), for example, highly soluble nuclides re-leased from the near-field that are potentially key contributors to total dose
include Cl-36, I-129 and Cs-135. Extended containment times can lead to a reduction in the inventory of radionuclides available for release.
Table 4-1 presents a comparison of the reduced fractions of the initial inven-tories for these three radionuclides for two cases: a 625,000-year contain-ment time [copper corrodes by reaction with water, as argued by Szakálos et
al., (2007)] and a 1 million-year containment time (copper corrodes by
diffu-sive transport rate of sulfide). The difference in reduction of initial inven-tory (hence, potential reduction in peak release of such highly soluble ra-dionuclides) is not appreciably different for the two cases. Containment time has to greatly exceed (a factor of 10 times or more) the half-lives of non-solubility limited radionuclides to significantly mitigate peak dose6. Measured corrosion rates such as those of Szakalos et al., (2007) represent conditions far from equilibrium (i.e. represent initial, rather than long-term rates). As chemical affinity effects, such as initial presence, the steady in-crease in dissolved hydrogen in groundwater and the slow diffusive mass-transport rate of dissolved hydrogen in clay buffer away from the copper surface, are considered, the overall free-energy driving the reaction will de-crease. Consequently, the rate of corrosion is also expected to dede-crease. Therefore from that perspective, calculations of canister lifetimes based on the initial rates reported in Szakolas et al. (2007) represent conservative un-derestimates (i.e., unrealistically short) of what would be the canister life-times under actual repository conditions.
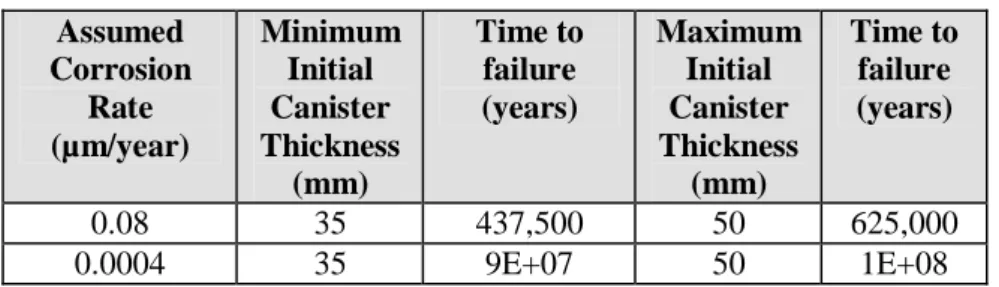
4.2 Safety assessment sensitivity
Szakálos et al. (2007) suggest that corrosion of copper by water could result in ‘sub-micron’ corrosion rates, but do present a numerical estimate for the corrosion rate. However, based on the results of the experiments described by Szakálos et al. (2007), corrosion rates between 0.08 µm / year and 0.0004 µm / year have been derived.
In the SR-Can Safety Report (SKB 2006c, TR-06-09), SKB estimates that 99% of the canisters will have seals with thicknesses between 40 and 50 mm, and that the remaining 1% of the canisters will have seals with thicknesses between 35 and 40 mm. The thickness of the rest of the copper canister shell is assumed to be 50 mm.
Assuming instantaneous wetting of the canister once placed in the reposi-tory, continuous corrosion of the copper by oxygen from water, and no other corrosion processes gives the hypothetical canister lifetimes shown in Table 4-2.
6
Ra-226, with a half-life of 1600 years, is also a potentially non-solubility limited radionuclide that may be a significant contributor to dose (e.g., see Fig 10-19 of SKB, 2006c). Ra-226 be-comes a potentially key contributor to dose because of, rather than in spite of, long containment times presented in SKB (2006c). This is because Ra-226 initially has negligible inventory in spent fuel, but its inventory increases with increasing containment time from radioactive decay and decay-chain in-growth from U-238 and U-234. Further analysis of mitigating factors for Ra-226 are beyond the scope of this review.
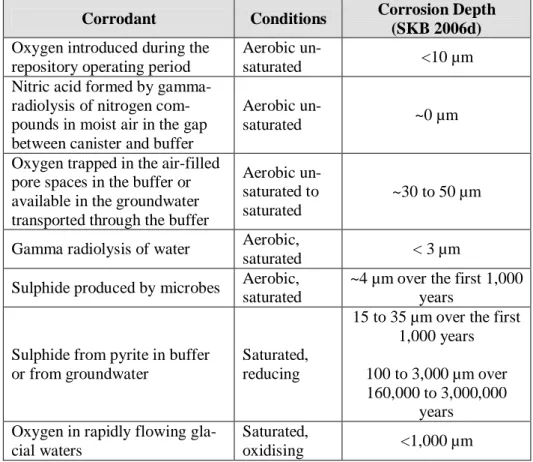
In the SR-Can Safety Report, SKB discusses a range of processes that may cause corrosion of the copper canister (e.g., SKB 2006d, TR-06-22). Ta-ble 4-3 summarises SKB’s estimates of the impact of these processes on canister corrosion during repository evolution.
The summary provided in Table 4-3 shows that although the first 1,000 years or so of repository history will be a relatively more complex period during which several different corrosion mechanisms may operate, the total effect of these ‘early’ corrosion processes is relatively unimportant in comparison with the potential effect of sulphide corrosion in the longer term (SKB gives a total estimate for the first 1,000 years of 55-85 µm of copper corrosion).
Table 4-2 Hypothetical canister lifetimes calculated assuming continuous
corrosion of copper by water following the mechanism reported by Szakálos et al. (2007). Assumed Corrosion Rate (µm/year) Minimum Initial Canister Thickness (mm) Time to failure (years) Maximum Initial Canister Thickness (mm) Time to failure (years) 0.08 35 437,500 50 625,000 0.0004 35 9E+07 50 1E+08