Research
2010:32
Fingerprints of zones in boreholes An
approach to identify the characteristics
of structures
Authors: Thomas Sträng
Stefan Wänstedt Sven Tirén
Title: Fingerprints of zones in boreholes An approach to identify the characteristics of structures Report number: 2010:32
Author: Thomas Sträng, Stefan Wänstedt och Sven Tirén
GEOSIGMA AB
Date: November 2010
This report concerns a study which has been conducted for the Swedish Radiation Safety Authority, SSM. The conclusions and viewpoints present-ed in the report are those of the author/authors and do not necessarily coincide with those of the SSM.
SSM Perspective
This report concerns a study which was initially conducted for the dish Nuclear Power Inspectorate (SKI), which is now merged into the Swe-dish Radiation Safety Authority (SSM). The conclusions and viewpoints presented in the report are those of the authors and do not necessarily coincide with those of the SSM.
Background
The Swedish Nuclear Fuel and Waste Management Co (SKB) has publis-hed Site Descriptive Models (SDM) of two sites, Forsmark and Laxemar, where SKB recently has finished site investigations for a repository for spent nuclear fuel. These models form the base for the conceptual under-standing of the past and future evolution of the site and constitute one of the fundament in the forthcoming SKB application for building the repo-sitory. The approach in geological/structural modelling may vary. Essen-tial in all modelling is that the data used is representative, the treatment of the data is transparent and systematic and that the applied approach is appropriate in a performance assessment.
The classification of geophysical borehole data, in order to identify and characterize structures, which intercepts the borehole, is an important part of 3D modelling of the structural pattern in the bedrock.
The base data used in this study, have been provided and delivered by the SKB and consist of borehole logging data from cored borehole KFM03A at SKB’s Forsmark site. The statistical method chosen for this study, Cluster Analysis using K-means method, groups data into a pre-defined number of clusters with the goal to minimize the variance for data within the group and to maximize the variance between the clusters.
Purpose
The purpose of the current project is to test a statistical approach, Cluster Analysis, on site data in order to see if it possible to classify complex data set, geological and geophysical borehole data, in order to identify boreho-le intersects with increased brittboreho-le deformation, i.e. brittboreho-le deformation zo-nes. The idea is that data can and should be grouped into two categories, two clusters – corresponding to homogeneous bedrock (matrix) in one cluster and open fractures in the other cluster. The analysis also includes a repetition of the cluster analysis, with a stepwise refined data set to see whether strongly accentuated features could be identified.
Results
The results show that the use of K-mean Cluster Analysis will present clusters that could represent the spatial distribution of bedrock matrix and the location of fractures respectively down the borehole. The results were compared with fracture frequency data (from core mapping) and also with the geological Single Hole Interpretation (SHI) of KFM03A performed by SKB. The fracture zones identified in the SHI process are all found in the result of the Cluster Analysis.
The Cluster Analysis also revealed eight additional possible zones. A majo-rity of these are smaller than 5 metres (section width in the borehole) but they are still pronounced in the analysis. Based on the geophysical data these sections should be taken into account when defining and interpre-ting fracture zones in the borehole and when performing the structural modelling of the area, e.g. alternative modelling.
Effects on SSM supervisory and regulatory task
In the forthcoming review of SKB’s application to build a repository for spent nuclear fuel in Forsmark it is important for SSM to know if there are geologi-cal structures that has not been considered by SKB in its SDM for Forsmark.
Project information
SKI reference: SKI 2005/741/200509030 and SKI 2006/690/200609025 Responsible at SKI has been Fritz Kautsky and at SSM Lena Sonnerfelt.
Table of contents
Abstrakt ... 2 Abstract ... 3 1. Introduction ... 4 2. Base data ... 5 3. Methodology ... 5 3.1 Cluster analysis ... 5 3.2 Work flow ... 7 3.3 Data preparation ... 8 4. Results ... 9 4.1 K-means cluster ... 9 4.2 Correlation ... 15 5 Discussion ... 165.1 Using the cluster K-means method ... 16
Abstrakt
Klassificeringen av geofysiska borrhålsdata för att identifiera och karaktärisera strukturer,
som skär borrhålet, är en viktig del av 3D-modellering av strukturella mönster av
berggrun-den.
Syftet med denna studie är att testa en statistisk metod, klusteranalys, på platsdata för att se
om det är möjligt att klassificera komplexa datauppsättningar, geologiska och geofysiska
borrhålsdata, för att identifiera skärningar med ökad spröd deformation, dvs. spröda
deformat-ionszoner.
Det underlag som använts i studien har lämnats och levererats av SKB och består av
borrhåls-data från kärnborrhål KFM03A. Den statistiska metod som valts för denna studie, innebär
klusteranalys med K-medelvärdesmetoden, grupperar data till ett på förhand definierat antal
kluster med målet att minimera variansen för data inom gruppen och för att maximera
variat-ionen mellan kluster.
Tanken är att data bör och kan indelas i två kategorier, två grupper - motsvarande homogen
berggrund (matrix) i ett kluster och öppna sprickor i andra klustret. Analysen inkluderar också
en upprepning av klusteranalysen, med stegvis förfinade data för att se om kraftigt
accentue-rade egenskaper kunde identifieras.
Resultaten visar att användningen av
klusteranalys, baserad på algoritmen K-mean,omfattar
klus-ter som represenklus-terar den rumsliga fördelningen av bergmatrisen och lokalisering av sprickor
längs med borrhålet. Resultaten jämfördes med sprickfrekvensdata (från borrhålskartering)
och även med geologisk enkelhåls tolkning av KFM03A som utförts av SKB. De sprickzoner
som identifierats genom enkelhåls tolkning är också indikerade i resultatet från
klusterana-lysen. Klusteranalysen påvisade ytterligare åtta möjliga zoner. En majoritet av dessa zoner är
mindre än 5 meter (sektionsbredd i borrhålet) men de är ändå utpräglade i analysen. Baserat
på geofysiska data bör dessa sektioner beaktas när man definierar och tolkar sprickzoner i
borrhålet och vid utförande av strukturell modellering av området.
Abstract
The classification of geophysical borehole data in order to identify and characterize structures, which intercepts the borehole, is an important part of 3D modelling of the structural pattern of the bedrock. The objective of this study is to test a statistical approach, cluster analysis, on site data in order to see if it is possible to classify complex data set, geological and geophysical borehole data, in order to iden-tify borehole intersects with increased brittle deformation, i.e. brittle deformation zones.
The base data used in the study have been provided and delivered by SKB and consist of borehole logging data from the cored borehole KFM03A. The statistical method chosen for this study, cluster analysis using K-means method, groups data into a pre-defined number of clusters with the goal to minimize the variance of data within the group and to maximize the variance between the clusters. The idea is that data can and should be grouped into two categories, two clusters – corresponding to homogeneous bedrock (matrix) in one cluster and open fractures in the other cluster. The analysis also includes a repetition of the cluster analysis, with a stepwise refined data set to see whether strongly accentuated features could be identified.
The results show that the use of K-mean Cluster analysis will present clusters that could represent the spatial distribution of bedrock matrix and the location of fractures respectively down the borehole. The results were compared with fracture frequency data (from core mapping) and also with the geological Single Hole Interpretation of KFM03A performed by SKB. The fracture zones identified in the Single Hole Interpretation process are all indicated in the cluster analysis results. The cluster analysis re-vealed eight additional possible zones. A majority of these are smaller than 5 metres (section width in the borehole) but they are still pronounced in the analysis. Based on the geophysical data, these sec-tions should be taken into account when defining and interpreting fracture zones in the borehole and when performing the structural modelling of the area.
1. Introduction
The SKB Site Descriptive Models of sites, one of the fundaments in the forthcoming SKB application for building a deep repository for spent nuclear waste, form the base for the conceptual understanding of the past and future evolution of the site. The approach in geological/structural modelling may vary. Essential in all modelling is that the data used is representative, the treatment of the data is transparent and systematic and that the applied approach is appropriate in a performance assessment. The objec-tive of this study is to test a statistical approach, cluster analysis, on site data in order to see if it is possible to classify complex data set, geological and geophysical borehole data, in order to identify borehole intersects with increased brittle deformation, i.e. brittle deformation zones.
This report is the result of a contract (Ref. SKI 2006/690/20060925) from SKI (ProjectManager: Fritz Kautsky) for a test to get the “fingerprints” of brittle deformation zones.
The characteristics of a fracture zone reflect the conditions that prevailed when the fracture was formed, and its history. They also reflect the changes that the surrounding bedrock has gone through. Thus, zones from different geological ages and conditions will carry certain “fingerprints” (combina-tions of characteristics) which could be of use when trying to identify and map the structures. The present work focuses on displaying borehole logging data using pattern recognition tools.
When applying cluster analysis to a (geo-scientific) data set, the data will group into clusters contain-ing cases with similar characteristics. The scope of this study is to see whether a K-means cluster analysis will be able to group data into groups that reflect the spatial appearance of fractures and frac-ture zones in the bedrock versus the intact rock matrix.
The data used in the analyses consists primarily of geophysical logging data. Fracture mapping data have been used merely to correlate the result of the analysis.
Before the cluster analysis can be carried out, some initial questions needed to be answered. This in-clude
Inventory of data – What borehole logging data exist?
Geophysical parameter response – fractures vs. lithology characteristics – over- lapping response – how can that be handled?
Data preparation and formatting – Should data be normalized or weighted before the analysis?
Tree clustering - a general pattern distribution of geophysical borehole data. Can all data be included in the analysing process and still make useful results?
2. Base data
The base data or input data to this study have been provided and delivered by SKB and consist of borehole logging data from the cored borehole KFM03A 10. The borehole is drilled using a telescopic technique. Thus, the upper section, 0–100 m, is percussion drilled with a large diameter (200 mm). The core-drilled part of the borehole, ca. 100–1000 m, has a diameter of 76 mm.
The borehole KFM03A is supplied with length calibration marks. These marks were cut out as refer-ence rings at certain depths down the hole. The length of each mark is roughly 10 mm. Two marks, separated approximately 10 cm apart, were engraved at each length position (approximately every 50th meter). Some of the anomalies of the geophysical data will most likely be responses from these marks. Analysing differences between the response of these length-calibration marks and other heterogenei-ties in the bedrock is not included in this study.
Table 1. List of borehole logging data from KFM03A used in this study. Data annotated with the word correlation has only been used as a refer-ence when interpreting the results.
Only the geophysical data have been used during the cluster analysis process. Fracture mapping data (fracture frequency data) have been used as correlation when the result of the cluster analysis is pre-sented.
3. Methodology
3.1 Cluster analysis
By default, geophysical logging normally produces a large amount of data. It can however, be difficult to use the large amount of data effectively during interpretation, e.g. using multi-variant analysis. The complexity of the data and the non-unique solutions that exist for different kinds of geophysical data makes the process cumbersome and sometimes impossible to carry out to an acceptable extent. Instead of using the full potential power of geophysical logging (e.g.. the ability to collect several parametres during a logging session), the different types of data are interpreted individually and the correlation between different geophysical parametres is, at the most, tested for two or three variables at the same time.
Cluster analysis make use of the fact that data, in certain cases, can be sorted into homogeneous groups sharing similar characteristics. Patterns or associations between data in a group may not be
Data
use
caliper -caliper (3D) analysing gamma-gamma analysing fluid resistivity -fluid temperature -gamma-gamma analysingmagnetic susceptibility analysing
focused resistivity (140 cm) analysing
focused resistivity (300 cm) analysing
sonic P-wave analysing
core fracture mapping correlation
evident at a first glance; nevertheless their existence can be justified by calculating values of fitness for data within the group and also estimating the non fitness of data of different groups.
Figure 1. An example of classification of Clustering techniques (from 1, p. 13).
Cluster analysis methods can be divided into hierarchical and non hierarchical (partitional clustering) methods 1. The approaches for these two groups are quite different. While hierarchical methods are used unconditionally with respect to the number of clusters sought for, the non hierarchical methods including the K-means method require a predefined number of clusters.
The K-means method groups data into a pre-defined number of clusters with the goal to minimize the variance of data within the group and to maximize the variance between the clusters. This is done by using the following steps (based on 1):
Figure. 2. An algorithm describing the K-mean Cluster analysis technique.
Assign start values for the centres of the clusters (random or defined)
Assign each data case to the closest cluster
Based on the assigned data, calculate an updated cluster centre.
Until a threshold convergence is met -repeat
In this application, the K-means clustering method was used. This approach should be useful if an initial idea is to be tested and verified.
Initially, ordinary tree clustering (hierarchical clustering) was used to inspect individual data points and to get an idea of the possibility to divide data into groups using clustering methods. Those steps are not described further in this work.
3.2 Work flow
Figure 3. Established work flow schedule of the K-means cluster analysis.
The idea of using cluster analysis in general is to let the analysis process take care of the “thinking”. However subjectivity will always be present in the process. In this approach the subjectivity lies in the fact that we want the cluster analysis to identify fractures. Thus we expect the variables used to exhibit distinct different properties for fractured rock than for intact rock. For instance we assume that in the resulting cluster which may hold the cases corresponding to fracture, the mean resistivity values are lower than is the case for the other clusters. The same is valid for, e.g. sonic data.
Only minor preparation of data is carried out before the analysis processes will take place. The evalua-tion of the results of the analysis process will be the first actual step where geological aspects are taken into account. That is, based on the result of the cluster analysis a geological significance will be evalu-ated.
In the work flow (ref to fig. 3), a repetition of the cluster analysis, with a stepwise refined data set, is introduced. Even though the process is rather simple, it has to be done with great attention. Different geophysical parametres have different influence radius (in this context depth of penetration into the
RAW DATA Geophysical
borehole data
Selection of borehole and
data preparation
Cluster analysis step 1
The choise of parameters
Cluster analysis
(K-means)
The selection of two
clusters
Cluster analysis using a
refined data set. Repeated
if possible
Correlation of data versus
core mapping
rock), thus the sensitivity for an incorrect length adjustment varies for the parametres measured. In the statistical treatment of data it is important that the absolute position of the measured parameter coin-cides for each performed logging. No length correction, based on, e.g. gamma data, has been carried out in this study. A length correction has already been done by SKB before storing the data in the da-tabase. All geophysical logs used have a spatial measurement resolution of 10 cm. The final analysis will focus on finding sections with a high frequency of anomalies. Inpractice this is done i.e. by using averaging filters to link a number of realizations indications, spatially closely located, to the same fracture or fracture zone.
Thus, performing a step-wise repeated cluster analysis is useful when the resulting data present a number of cases which will define a discrete number of fractures or fracture zones. The main uncertainty in the analysis is related to the uncertainty concerning the absolute location of the data points.
3.3 Data preparation
Data were prepared before the cluster analysis was carried out. Obvious spikes have been removed from the data set. Resistivity data have been logarithmically transposed. No further correction has been made due to the influence of the resistivity of the fluid.
The distance between different variables of all measured cases (measuring points), is measured linear-ly to eventuallinear-ly establish the group (cluster) identity. To overcome ambiguous results due to the dif-ference in absolute values of data of the different measured parameters, the data have to be standard-ized 12. The standardstandard-ized value is expressed as
Std. Value = (raw value - mean of variable) / std. deviation
No weighting function was applied to any of the parameters since we wanted to treat all parameters equally. The reason to that is that we did not want to rank the significance of the variables used. We did not assume that a certain variable would yield more fracture characterizing information than oth-ers.
Certain geophysical data are best displayed using logarithmic scaling. In order to identify groups with-in these data sets, a discussion needs to take place concernwith-ing the appearance of fractures with-in the bore-hole and their response in the data.
Independent of which technique is used to define the different groups the data response from positions representing a fracture has to be different from the response achieved when measuring on the homoge-nous rock. That is as mentioned earlier the idea of the concept. However, data have in most cases a distribution within the population. Geophysical measured data representing fractures will exhibit one distribution whereas data representing fracture free rock will exhibit another distribution. As long as the distance between the different distributions is big enough, the cluster analysis will have no trouble defining the groups based on the actual populations. The problems occur when the distributions of the two populations to some extent overlap.
Some of the data have been trend corrected by removing the background trend. This has been carried out by inspection and the purpose is to enhance the possibility to identify fractures with a shortwave – high frequency anomaly. The background trend has been assigned by applying a running average (window width of 100 meters).
4. Results
4.1 K-means cluster
The first attempt was to perform the analysis defining two clusters. The idea is that data can and should be grouped into two categories – corresponding to homogeneous bedrock (matrix) in one clus-ter and fractures in the other clusclus-ter.
The assumption made here is basically that geophysical data used will group itself in two different groups with distinctively different mean values for each of the geophysical parameter used. This is the cluster analysis in a nutshell. Other than defining how many groups we are looking for and removing obvious erroneous data the process is completely statistical, i.e. no geological importance of the data has been taken into account in order to weight or classify data. Thus the process will give us two dif-ferent values; a relatively low and a relatively high value for each and every parameter. It is assumed that The K-mean cluster analysis will show that for each cluster there is a distinct mean value which correlates to the class it is given (1= undisturbed bedrock, 2= fracture or fracture zone).
Table 2. Geophysical parameters used in the K-means cluster analysis
Based on inspection, the calliper and the fluid parameters were omitted when the Cluster analysis was carried out. These parameters either exhibit data which could not be correlated to the spatial occur-rence of fractures along the borehole or the data quality is much too poor in order to be useful. A K-means cluster analysis was therefore performed using the remaining parameters (table 2).
Data Density (gamma-gamma) Susceptibility focused resistivity (140 cm) focused resistivity (140 cm) sonic P-wave gamma
Cluster No. 1 Cluster No. 2 Plot of Means for Each Cluster
Variables -3.0 -2.5 -2.0 -1.5 -1.0 -0.5 0.0 0.5 1.0 DENSITY
GAMMA SUSCEPT LG_RES14 LG_RES30 PWAVE
Figure 4. The Cluster K-mean analysis was performed using density, gamma, magnetic susceptibility , res140, res 300 and full-wave (P-wave). All parameters except gamma exhibit lower mean values for cluster 1 than is the case for cluster number 2. Based on this analysis, the gamma parameter was omitted and the analysis was once again performed (figure 4).
The cluster K-mean analysis was performed using density, gamma, magnetic susceptibility, res140, res 300 and full-wave (P-wave). All parameters except gamma exhibit lower mean values for cluster number 1 than is the case for cluster number 2. The significance of using the gamma parameter as a fracture indicator was therefore questioned here. It is not apparent that a higher gamma value will in-dicate a fracture or fracture zone. Based on this analysis, the gamma parameter was omitted and the analysis was once again performed (fig. 4).
Cluster No. 1 Cluster No. 2 Plot of Means for Each Cluster
Variables -3.0 -2.5 -2.0 -1.5 -1.0 -0.5 0.0 0.5 1.0
DENSITY SUSCEPT LG_RES14 LG_RES30 PWAVE
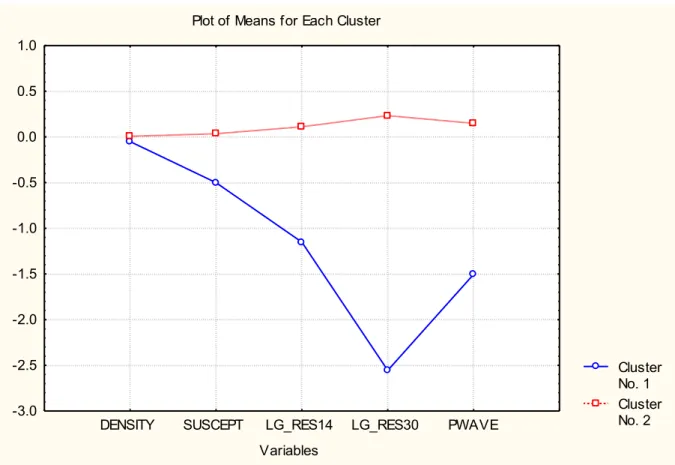
Figure 5. Result of the K-mean cluster analysis using the density, susceptibility, resistivity (140 cm and 300 cm) and the P-wave velocity parame-ters. The standardized mean value for cluster 1 (corresponding to fractures or fracture zones) are considerably lower for most of the geophysical parameters used in the cluster analysis than is the case for cluster 2 (corresponding to bedrock matrix).
The results from the K-mean cluster analysis without the gamma parameter exhibit a similar distribu-tion of the mean values for the parameters of the two clusters. It is possible that the gamma parameter did not affect the grouping of the two clusters to a high extent. Further more the K-mean cluster analy-sis has not clearly shown that density variable is a fracture discriminating parameter.
The data from the analysis is now grouped into two clusters where cluster 1 contains 757 cases and cluster 2 contains the remaining 7263 cases. Cluster 1 corresponds to the expected fracture data and is plotted versus depth (fig. 5). Fracture frequency data is plotted as comparison information (fig. 5).
Figure 6. Results of the K-mean cluster analysis using the density, susceptibility, resistivity (140 cm and 300 cm) and the P-wave velocity parame-ters (based on 8020 cases). A comparison with fracture frequency data (open fractures) is by inspection yielding a certain degree of correlation.
1000980 960 940 920 900 880 860 840 820 800 780 760 740 720 700 680 660 640 620 600 580 560 540 520 500 480 460 440 420 400 380 360 340 320 300 280 260 240 220 200 180 160 140 120 10080 60 40 200 1 2 3 4 5 6
Cluster analysis (K-mean)
0 5 10 15 20 25
Fracture frequency (/1m)
Borrhålslängd (m)
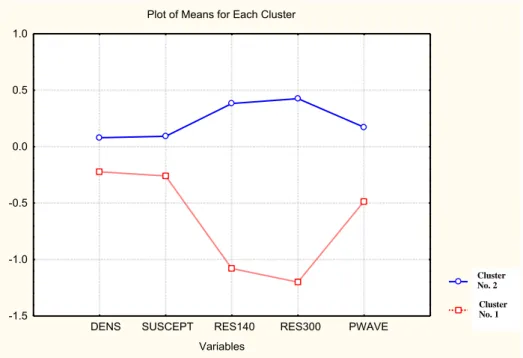
Figure 7. Result of a second (K-mean) cluster analysis phase using 757 datapoints which all where defined as fractures in the first K-mean cluster analysis.
Using the established work flow chart (fig. 3), a second analysis phase was performed where data sole-ly from the first selection is used. The question which needs to be answered is; can data be divided further into a more detailed classification finding more pronounced zones?
The same cluster analysis operation was carried out once again with data which have been classified as belonging to cluster number 1 (757 data points). The cluster analysis once again grouped data into two cluster data. This time cluster 1 contains 198 cases and cluster 2 yields the remaining 559 cases. The cluster analysis data was then filtered using a running average filter to enhance wider structures. This resulted in 15 larger possible structures with a width of at least 3 meters. Three of the sections are located close together (9-11, cf Table 3) and it might be appropriate to treat them as one
struc-ture/anomaly during the correlation phase of the analysis.
Cluster No. 1 Cluster No. 2 Plot of Means for Each Cluster
Variables -1.5 -1.0 -0.5 0.0 0.5 1.0
DENS SUSCEPT RES140 RES300 PWAVE
Cluster No. 1 Cluster No. 2
1000980 960 940 920 900 880 860 840 820 800 780 760 740 720 700 680 660 640 620 600 580 560 540 520 500 480 460 440 420 400 380 360 340 320 300 280 260 240 220 200 180 160 140 120 10080 60 40 200 1 2 3 4 5 6
Cluster analysis (K-mean)
0 5 10 15 20 25
Fracture frequency (/1m)
Borrhålslängd (m)
Figure 8. Result of a second K-mean cluster analysis using the density, susceptibility, resistivity (140 cm and 300 cm) and the P-wave velocity parameters (based on 757 cases). A comparison with fracture frequency data is showing good correlation.
4.2 Correlation 1000980 960 940 920 900 880 860 840 820 800 780 760 740 720 700 680 660 640 620 600 580 560 540 520 500 480 460 440 420 400 380 360 340 320 300 280 260 240 220 200 180 160 140 120 10080 60 40 200 1 2 3 4 5 6 Cluster analysis (K-mean)
0 5 10 15 20 25
Deformation zones
Borrhålslängd (m)
a. b.
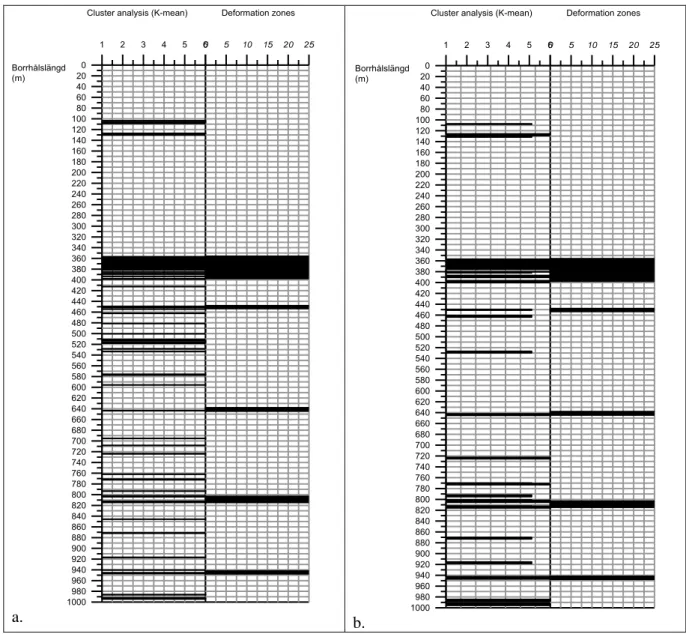
Figure 9. Comparison of the results of cluster analysis and the SKB Single Hole Interpretation of deformation zones of the cored borehole KFM03. The graph to the left displays results from the K-mean cluster analysis based on 757 cases. The graph to the right (b) shows cluster data which have been filtered with a running average in order to promote possible fracture zones with a width in a meter scale. A good correlation with the single hole interpretation with interpreted fracture zones is obvious. The cluster analysis data yields 12-14 sections where possible fracture zones may occur. All fracture zones defined in the single hole interpretation have been identified in the cluster analysis process with the addition of 7-9 possible fracture zones.
A comparison between the results of the cluster analysis and the interpreted zones (SKBs Single Hole Interpretation 8) shows a good correlation. The fracture zones identified in the Single Hole Interpreta-tion process are all indicated in the cluster analysis results (Fig. 8).
1000980 960 940 920 900 880 860 840 820 800 780 760 740 720 700 680 660 640 620 600 580 560 540 520 500 480 460 440 420 400 380 360 340 320 300 280 260 240 220 200 180 160 140 120 10080 60 40 200 1 2 3 4 5 6 Cluster analysis (K-mean)
0 5 10 15 20 25
Deformation zones
Borrhålslängd (m)
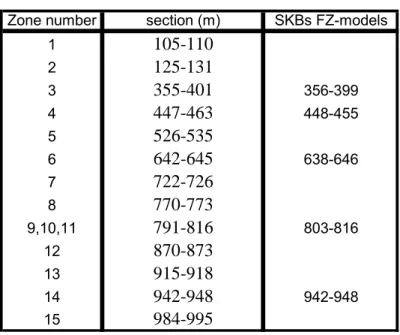
Table 4. Correlation between fracture zones interpreted in the cluster analysis process (see figure 8b ) and fracture zones (FZ) outlined in the SKB Single Hole Interpretation (SKB SHI) .
The cluster analysis revealed eight additional possible zones. A majority of these are smaller than 5 meters (section width in the borehole) but they are still pronounced in the analysis. Based on the geo-physical data, these sections should be taken into account when defining and interpreting fracture zones in the cored borehole KFM03A.
5 Discussion
5.1 Using the cluster K-means method
The results presented in this study indicate that the cluster analysis method is a useful tool to arrange data in an initial stage of the interpretation phase of borehole logging data. The crucial point of using cluster analysis is that the different parameters are compared with each other in terms of, e.g. the dis-tance between the different distributions. Once established, the difference will be the “scale bar” and the tool for discriminating between populations throughout the entire process. The absolute values are not important during the process of arranging the data into clusters. This is very useful and important when using the same process applied to data sets from different boreholes. This is especially valid for logging parameters for which the data, in practice, are difficult to calibrate and convert into absolute values.
The K-mean cluster analysis algorithm can be very sensitive to outliers in data 13. This calls for data preparation where obvious spikes are removed before the analysis takes place.
K-mean cluster analysis will most likely give different results depending on how the initial cluster means are chosen when the analysing process starts. Further more, there are different ways to measure the distance between a member of the cluster and the mean of the cluster. These two conditions will affect the K-mean cluster analysis. The scoop of this work was not to optimize the use of these param-eters. Simple default settings have been used most of the time.
Zone number section (m) SKBs FZ-models
1
105-110
2125-131
3355-401
356-399 4447-463
448-455 5526-535
6642-645
638-646 7722-726
8770-773
9,10,11791-816
803-816 12870-873
13915-918
14942-948
942-948 15984-995
A further development of this study should be to test this work flow on data sets from other boreholes. By performing the statistical analysis on several boreholes close to each other, the possibility to define the spatial distribution of zones could be investigated. Other data parameters (such as flow logging data) can also be used in the analysis.
6 References and further reading
The software package Statistica (v5.1) has been used for the cluster analysis. Most technical references derive from a software manual which can be found on-line 2.
1. Jain, A.K., et al. Data Clustering: A Review. ACM Computing Surveys, Vol. 31, No. 3, Septem-ber 1999.
2. Statistical encyclopedia, Cluster analysis, http://www.statsoft.com/textbook/stcluan.html
3. Statistical Data Mining Tutorials
4. http://www.autonlab.org/tutorials/index.html
5. Cluster Analysis software
6. http://www.clustan.com/what_is_cluster_analysis.html
7. A Practical Guide to the Use of Selected Multivariate Statistics
http://www.pfc.forestry.ca/profiles/wulder/mvstats/index_e.html
8. Carlsten, S, Petersson, J. , Stephens, M., Thunehed, H., Gustafsson, J.,
9. Geological single-hole interpretation of KFM03B, KFM03A and HFM06-08 (DS3). Forsmark site investigation Revised SKB P-04-118. SKB, October 2006.
10. Nielsen, U. T., Ringgaard, J., Geophysical borehole logging in borehole KFM02A, KFM03A and KFM03B. Forsmark site investigation .SKB P-04-97. SKB, 2004.
11. Thunehed, H., Interpretation of borehole geophysical measurements in KFM02A, KFM03A, KFM03B and HFM04 to HFM08. Forsmark site investigation. SKB P-04-98. SKB, 2004. 12. Romesburg, H., C., Cluster Analysis for Researchers. Lulu.com, 2004.
Strålsäkerhetsmyndigheten Swedish Radiation Safety Authority
2010:32 The Swedish Radiation Safety Authority has a compre-hensive responsibility to ensure that society is safe from the effects of radiation. The Authority works to achieve radiation safety in a number of areas: nuclear power, medical care as well as commercial products and services. The Authority also works to achieve protec-tion from natural radiaprotec-tion and to increase the level of radiation safety internationally.
The Swedish Radiation Safety Authority works pro-actively and preventively to protect people and the environment from the harmful effects of radiation, now and in the future. The Authority issues regulations and supervises compliance, while also supporting research, providing training and information, and issuing advice. Often, activities involving radiation require licences is-sued by the Authority. The Swedish Radiation Safety Au-thority maintains emergency preparedness around the clock with the aim of limiting the aftermath of radiation accidents and the unintentional spreading of radioactive substances. The Authority participates in international co-operation in order to promote radiation safety and fi nances projects aiming to raise the level of radiation safety in certain Eastern European countries. The Authority reports to the Ministry of the Environ-ment and has around 270 employees with competencies in the fi elds of engineering, natural and behavioural sciences, law, economics and communications. We have received quality, environmental and working environ-ment certifi cation.