KALMAR, SWEDEN, November 26-28, 2007
voe
EMISSIONS FROM URBAN MUNICIPAL
SOLID WASTE DUMP SITES
Anjali Srivastava
National Environmental Engineering Research Institute, Kolkata, India
ABSTRACTMunicipal solid waste management in India is becoming important in view of the fact that increasing amount of solid waste generated in most cities is now being recognized as a major public health problem. Poor management of solid waste leads to problems, which transcend traditional environmental boundaries and contribute to air, waters and soil pollution,
The percentage of India's population living in cities and urban areas has doubled to 28.8% by 200 I from 14% at the time of Independence, showing the rapid pace of urbanization. The progressively improved standards of living and the wasteful consumer attitudes have resulted in increase of quantities of municipal wastes to be handled.
The present system of solid waste management in India, like any other developing country, is fraught with many inadequacies. Illegal dumping is a major problem that raises significant concerns with regard to safety, property values, and quality of life in our communities. Poor collection or disposal practices are the problem. Since most cities in India still lack properly engineered landfills for safe disposal, waste here is mostly disposed in open dumps, which causes major environmental havoc.
Apart from other environmental hazards from open dumping of municipal solid waste, one of the major problems that rise are the uncontrolled emissions of VOCs or Volatile organic Compounds. VOCs are well known to be hazardous to human health and are potent carcinogens,
The present paper deals with qualitative and quantitative identification of VOCs from a two municipal waste dump site in Mumbai. Air at dump sites was sampled and analyzed on GC/MS in accordance with USEPA TO-17 compendium method for analysis of toxic compounds. As many as 20 VOCs were qualitatively identified and some VOC's were quantified, Concentration of Benzene was observed in the order of 0.6ppm, Some of the VOCs identified were Hazardous Air Pollutants according to USEPA clean air act amendment of 1990,
KEYWORDS
VOC's, Municipal Solid Waste, emission. I INTRODUCTION
In India per capita municipal waste generation in major cities ranges from 0.2 Kg to 0.6 Kg, Out of the total municipal waste collected, on an average 94% is dumped on land and 5% is composted. The mismanagement of solid waste in urban areas poses a grave threat to public health and the quality of life of people living in those areas. Up to now there has been no comprehensive policy in India that deals with the whole cycle of waste management from production at household level to collection and disposal.
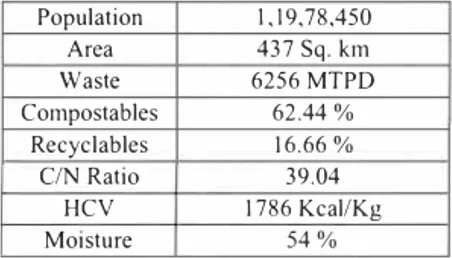
Mumbai, the commercial capital of India spans over 437.71 sq. Km and has a population of approximately 15 million. During the year 2000, MSW generated in greater Mumbai area was estimated as 6256 MT/day. This waste is dumped at Deonar dump site and Malad dump site. Deonar dump site is located in the eastern suburb of Mumbai and is spread over an area of I 32 ha. It receives approximately 4200 MT of solid waste per day excluding construction and demolition waste. Malad Chincholi Sunder dump site is in western suburb of Mumbai.
Table I. Waste Generation Rates, Composition and Characterisation of MSW in greater Mumbai. Population I, I 9,78,450 Area 437 Sq. km Waste 6256 MTPD Compostables 62.44% Recyclables 16.66% C/N Ratio 39.04 HCV 1786 Kcal/Kg Moisture 54% Meteorology
The city, being in the tropical zone and near the Arabian Sea, does not experience distinct seasons, but the climate can broadly be classified into two main seasons - the humid season and the dry season. Monthly relative humidity ranges between 57-87%. The humid season, between March and October, is characterised by high humidity and temperatures of over 30 ° C. The monsoon rains lash the city during June to September and supply most of the city's annual rainfall of 2,200 mm .The dry season, between November and February, is characterised by moderate levels of humidity and warm to cool weather. Cold northerly winds are responsible for a high wind chill factor during January and February. The annual temperatures range from a high of 38 ° C to a low of 11 ° C. Table 2 summarizes monthly temperatures during 2003.
Table 2. Monthly Temperature al Mumbai for year 2003.
Month Minimum Maximum Average
January 15.2 33.8 15.2 February 13.9 34.5 13.9 March I 8.7 35 18.7 April 22.9 36.2 22.9 May 25.1 36 25.1 June 24 35 24 July 23.5 31.9 23.5 August 23.9 3 1.8 23.9 September 23.5 31.3 23.5 October 19.2 36.7 19.2 November 19.1 37.4 19.1 December 13.1 35 13.1
2 Methodology - Sampling and Analytical
Methodology : Levels of voes in ambient air have been detennined by adsorbing ambient air at a unifonn flow rate on chromosorb l 06 cartridge followed by thermal desorption and detection on Varian Ge-MS in accordance with TO-17 compendium of methods for determination of toxic organic compounds (USEP A, 1999).
Battery operated personal air samplers were used to sample air at the rate of 20 ml per minute through adsorption cartridge. Unifom1 flow rate was maintained using rotameter. The monitoring schedule followed 8 hourly samples during a day. Samples were collected at three locations on the dump site.
Sorbent cartridges were fabricated from stainless steel pipe (SS-316) having a length of 15 cm with internal diameter of 4 mm and external diameter of 6 mm with caps on both sides. Desorption from sorbent cartridge was carried out by heating at 200 ° e for 20 minutes. Two tubes were connected in series. When the concentration in the second tube was more than 5% of total concentration it was assumed that break through occurred.
As soon as the pump was turned off the cartridge were removed and capped tightly and sealed in plastic bags. The tubes were stored in refrigeration. Blank cartridges were also stored in identical condition.
Varian Ge-MS (Model Saturn 3) with injection mode of sample introduction with DB 624 capillary column of 30 m length, 0.32 mm interval diameter and 1.8 microfilm was used. Helium gas with flow rate of I ml/min was used as carrier gas with split ratio I :25, Ge oven was programmed for 35 ° e hold for 2 min and ramped to 210 ° e with rate of I 0 ° e. Ion trap temperature was maintained at l 25 ° e while maintained at I 25 ° e while acquisition mass rage was from 35 amu to 260 amu in E I model I 00 µl of desorbed sample was injected into the GC. Each peak of chromatogram was identified using NIST Library mass spectra for individual peak in the total ion chromatograph were examined with respect to fragmentation pattern of ions and m/z for primary and secondary ions. First three mass abundances were matched to identify the peak. Some of the identified compounds were quantified using VOeM IX 15 of Dr. Ehrenstrofer from Perkin Elmer. Three sets of five point calibration curve were drawn and average curve was used to quantify the some of the identified voes which were also present in VOeM IX I 5.
The distribution of HAPs in different component of environment, persistence and its long range transport potential has been calculated using a Multimedia Mass Balance Model, TaPL3.
The TaPL3 model divides the environment in several well-mixed compartments like atmosphere, sea, lake, sediment, soil, biota or vegetation, which are homogeneous, and in equilibrium. In the present study five number of compartment namely atmosphere, creek, soil, sediment, and vegetation have been considered. The environmental persistence of a chemical in the framework of the multimedia model calculation is defined as the average time a chemical resides in particular environment before it is degraded. Mathematically it is given by:
T = n L M; I(M * K I I I
)
Ni
Where, T is the overall persistence of chemical, n, is the number of compartment,
M; is the amount of chemical in compartment i, K; is the degradation rate in compartment i.
The potential for the chemical to be subject to Long-Range Transport is given by the characteristics Travel Distance in Air, LA (Km)
LA=u*IA*YA
Where, u (Km/h) is the average wind speed,
tA is the half life of the chemical in air YA is the mass fraction of the chemical in air
The average hoping value, H, represents the average number of hops experienced by the chemical from one compartment to another. It is calculated only for emission to air. The average number of hop is calculated as,
1
H = (NW,A + NS,A + NV,A)
EA
Where, NW,A is the transfer rate from water to air, NS,A is the transfer rate from soil to air, NV,A is the transfer rate from vegetation to air, and EA is the emission rate to air, all in units of mol/h,
In the present study the environment has been considered as the study area with mixing height as the depth, TaPL3 has performed three simulations,
3 RESULTS AND DISCUSSIONS
Twenty VOCs have been identified in the emissions from dump sites. Amongst these eleven fall under the category of Hazardous Air Pollutants as defined in USEPA Air toxic programme, Figure I shows a typical chromatograph of an air sample from dumpsite. Table 2 shows the HAPs identified and their reactivity in the atmosphere. Species identified as highly reactive have atmospheric lifetimes of less than 6 hours under the specified typical annual average conditions. Those identified as medium-reactivity have a lifetime between 6 and 24 hours low-reactivity species have lifetimes between I and 60 days, and very low reactivity species have lifetimes greater than 60 days. High reactivity significantly decreases ambient concentrations. VOCs, which are highly reactive, thus exist in the atmosphere only close to their sources. As the reactivity decreases, effect on ambient concentrations is less, but long range transport becomes an increasingly important factor. For the HAPs with very low reactivity, an anthropogenic background concentration exists that is the cumulative effect of global emissions. Amongst the VOCs identified Chloroform and Carbon Tetrachloride have very low reactivity and Methylene Chloride, Benzene, Toluene and Ethyl benzene have low reactivity. Naphthalene and Xylenes have medium reactivity and Styrene is highly reactive. Under summer, daylight conditions, atmospheric lifetimes can be much shorter and conversely, under winter conditions the lifetimes can be longer. In tropical countries like India, it can be assumed that atmospheric reactivities will be higher as compared to western countries. The VOCs of concern from dumpsites are Chlorofonn, Carbon Tetrachloride Methylene Chloride, Benzene, Toluene and Ethyl benzene. Distribution of these VOCs in different components of environment is shown in Table 4. It is thus important to monitor them in gas phase. Figure 2 shows a typical output ofTaPL3 model run.
KALMAR, SWEDEN, November 26-28, 2007 Table 3. HAPs ji·om Dumpsite and their Atmospheric Reactivity,
HAP Formula CAS.No Phase Reactivity
Methylene chloride CH,Ci, 75092 Gas Low Chloroform CHCb 67663 Gas Very Low Carbon tetrachloride CCI• 56235 Gas Very Low
Benzene C6H, 71432 Gas Low
Toluene C,H, 108883 Gas Low
Ethylbenzene CsH,o 100414 Gas Low
Naphthalene C,oH, 91203 Gas Medium
Styrene CsHs 100425 Gas High
Xylene(m) CsH,o 108383 Gas Medium
Xylene(o) C,H,o 95476 Gas Medium
Xylene(p) CsH,o 106423 Gas Medium
Table 4. Percentage distribution of VOCs in Different Environments.
voe
Percentage in EnvironmentAir Water Soil Sediment Vegetation
Benzene 98,2 0.0005 1.8 0.0004 0.003 Carbon Tetrachloride Ethyl benzene 0.013 90.0 0.00002 0.0005 4.98 1.34 0,035 0.87 4.15 98,6 Styrene 95,4 0.0003 0.22 0.003 4,4 Toluene 96,2 0.0001 1.35 0.002 2.41 Xylene 0.07 0.00008 6.44 0.14 93,4
Naphthalene 2.28E-07 3.85e-12 I.OIE-08 6.82E-09 100
,,
1. l,'l,.,l--t1..-1r .. n"c1,r1 !><'"'""" l •. ,,..,,.,,., lur"" .l. �1telh )·I q·clo,p,,nf1Ul�
:· •,:; 1 -·l· 1,"u"'""" t� :: ..\:,�-:::.,�
(>. (·,.,·h,,.. ICflM ,-hloti<I<'
1J.-11u11.-"· l. mNhyl, ,\,f I ,..,.,hyl ••h�I)- "�'r""<'
•:u. ;��-,:;�'.:t'·'""'""'' 1 !. t,U,ylh,•n,,..,.� n. n,-,rt.-.,,· I.I. l' �yl,·t1• TOT·· 5 ZH0 2:20 3:30 300 4:,i11 000 s:s.H 5�0 7:00 &00
0.771 TaPL3 Version 3.00 170 2 29E-04 Leqerd EMISSION
..-2.46E-o41! ...
♦
t
2.54E-06: REACTION Avera� Wind Speed= 3. 77 km/h long•range transpo,t ,. 851 km Persistence "' 237 h
Average Number ol Hops• 0.829 Total Mass• 40378 kg
: INTERMEDIA
1 EXCHANGE Al emission. transfer. and
loss rates have Lris of kg/h
:--.
Figure 2. TaPL3 out for distribution of Styrene in environment.
REFERENCE
[I) Status of Municipal Solid Waste: Generation Collection Treatment and Disposal in Class I cities, CPCB April 2000.
[2) Manual on Municipal Solid Waste Management (first edition). Prepared by The Expert Committee constituted by the Ministry of Urban Development, The Government of India. January 2000.
(3) Urban Waste: Status, trends and interventions. Ravi Agarwal, Srishti, January 200 I. Personal Communication with Dr AK Tripathy, Ministry of Non-conventional Sources. (4) Beyer, A., Mackay, D., Matthies, M., Wania , F., Webster, E. 2000. Assessing long
range transport potential of persistence organic pollutants. Environ Sci Technol 699-703.
[5] Mackey D. 1979. Finding Fugacity Feasible. Environ Sci Technol., 12 I 8-1223.
[6) NEER) (National Environmental Engineering Research Institute) Report, 2005. Monitoring and Inventory of emission of volatile organic compounds in urban air -Phase II. Submitted to Central Pollution Control Board, Delhi.
(7) Shonnard David R., Alex S. Mayer, Kurtis G. Paterson, and Martin T. Auer, 1996. Environmental Fate and Risk Assessment Tool (EFRA T); Michigan Technological University.
(8) TRIMFaTE 1999a. US EPA, Office of air quality Planning and standards. TRJMFaTE technical support document, Description of module. EP A-453/D-99-002A, vol. I. Research Triangle park, NC
[9] TRIMFaTE I 999b. USEPA, Office of air quality Planning and standards. TRIMFaTE technical support document, Description of chemical transport and transforn1ation algorithm. EPA-453/D-99-002B, vol. II. Research Triangle park, NC
[ I OJ USEPA, I 999. Compendium Methods for the Detennination of organic compounds in ambient air, TO-I 7, EPA625/R-96/-0 I Ob.
KALMAR, SWEDEN, November 26-28, 2007
[I I] Webster E., Mackey, 0,, Wania, F. I 998, Evaluating environmental persistence, Environ Toxicol Chem , 21 48-21 58.
[12] Webster, E., Hubbarde, J, Mackay, 0,, Swanston, L, Hodge, A., 2003, Development of Tools to improve Exposure estimation for use in ecological Risk Assessment: The TaPL3 upgrade. Report to environment Canada. CEMC Report 2003xx, Trent