Linnaeus ECO-TECH ´10 Kalmar, Sweden, November 22-24, 2010
BIODEGRADATION OF BPA AND HHCB FROM
WASTE WATER BY MULTI-STAGE BIOFILM
PROCESSES
Tiina Mononen
1Sebastián Coloma
1Anna Lehtonen
2Anu Kapanen
2Minna Vikman
2Merja Itävaara
2Martin Romantschuk
1University of Helsinki, Finland
1VTT Technical Research Centre of Finland
2 ABSTRACTThe removal of bisphenol A and 1,3,4,6,7,8-hexahydro-4,6,6,7,8,8-hexamethyl-cyclopenta[γ]2-benzopyran (HHCB), which both are widely used chemicals and known endocrine disrupters, was studied applying two biofilm processes. One of the processes was a rotating bed biofilm process (RBBR) in which waste water and small plastic pieces were rotated in cylindrical reactors by air supply. The plastic pieces served as a carrier material for biofilm as the other process, fixed bed reactor (FBR) applied wood chips. RBBR was fed with municipal waste water and FBR with artificial gray water. Preliminary results show that both experiment setups remove efficiently BOD, COD and suspended solids from waste water. BPA and HHCB were added to municipal waste water and artificial gray water to study their removal in RBBR and FBR. In RBBR, BPA removal was 10 – 29 % in the first stage and 68 – 83 % in the second stage. HHCB was removed 3 – 4 % in the first stage and 70 – 79 % in the second stage of RBBR. In FBR, the first stage removed 31 – 97 % of BPA and the second stage 80 – 100 %. 84 – 95 % and 96 – 99 % of HHCB was removed in the first and second stage, respectively. However, the percentage of removed BPA and HHCB decreased over the course of time, which refers to adsorption and saturation of BPA and HHCB to wood chips at the beginning of BPA and HHCB addition. The experiments will be continued and adaptation of microbial is expected in the latter stages of the setups. Denaturing gradient gel electrophoresis is applied to study differences in bacteria and fungi diversities in different steps of the multi-stage RBBR and FBR. In future, also 454 pyrosequencing will be applied.
KEYWORDS
Waste water; BPA; HHCB; Biofilm processes;
1 INTRODUCTION
Conventional waste water treatment focuses on removal of organic material that causes oxygen demand in the water environment, and the nutrients nitrogen and and phosphorus that
chemicals that are introduced to the aqueous environment [1][2]. Many of them have a potential to affect the ecosystem by, for example, affecting hormonal systems of animals and humans.
Bisphenol A (BPA) is the raw material of widely used carbonate plastic and epoxy resins. Articles containing BPA are ubiquitous: due to its durability, shock resistance, lightness and transparency polycarbonate plastic is used for electrical devices, vehicles, architectural glazing, optical media, medical equipment, packaging materials and in almost any article of everyday use. Epoxy resins are used as components of composites and furthermore, as coating for pipings and food cans. 1,3,4,6,7,8-hexahydro-4,6,6,7,8,8-hexamethyl-cyclopenta[γ]2-benzopyran (HHCB) is a synthetic musk and is commonly used as a fragrance in cleaning and washing products, cosmetics and personal care products.
Due to the extremely common use of materials containing BPA and HHCB, it is expectable that they end up in waste water. HHCB has been found in waste water influent 1780 – 12700 ng/l and effluent 2360 – 3660 ng/l [3] and 42 – 451 ng/l in effluent [4]. 25 – 83 % removals on HHCB has been detected at waste water treatment plants [5]. However, < 3 – 600 ng/l HHCB has been detected in river water [4]. In treated effluent < 250 – 380 ng/l BPA has been detected [6]. BPA has been detected also in river water 43,5 – 639,1 ng/l [7].
The aim of the study is to enhance waste water treatment regarding micropollutants. The hypothesis is that a multi-stage waste water treatment is capable of biodegrading pollutants that exist in minor concentrations in waste water. According to the hypothesis, the first stage purifies the organic material that is easily biodegraded and microbes capable of biodegradation of BPA and HHCB will occupy the latter stage(s) since there are no other sources of carbon. This paper will describe the experiment setup and introduce preliminary results.
2 EXPERIMENT SETUP 2.1 Rotating bed biofilm reactor
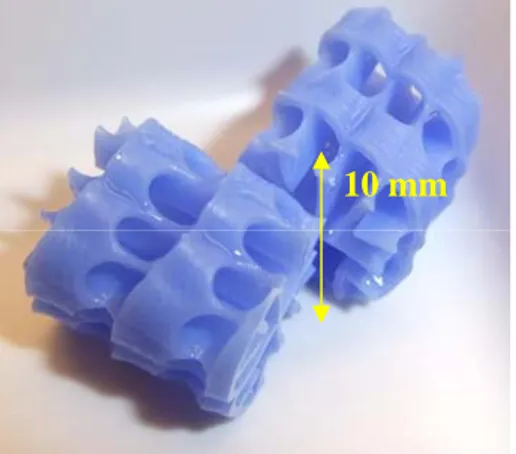
The experiment setup of rotating bed biofilm reactor (RBBR) consisted of a series of three cylindrical reactors made of plastic, volume of each was 4.3 – 4.45 liters. 75 % of the reactor volume was filled with plastic carrier material that has an optimized surface area for the biofilm to attach (Error! Reference source not
found.).
10 mm
Figure 1. Two pieces of plastic carrier material of RBBR with optimized surface area.
Linnaeus ECO-TECH ´10 Kalmar, Sweden, November 22-24, 2010
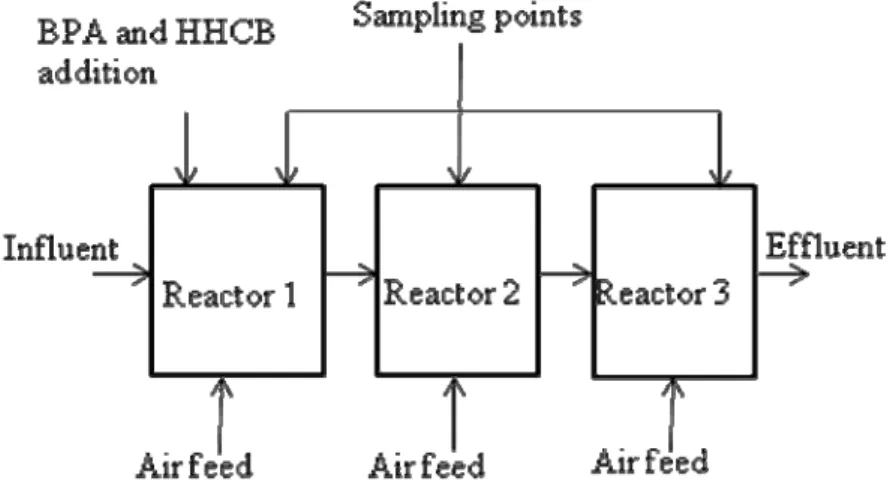
Figure 2. A schematic diagram of the series of three rotating
The content of the reactors was rotated by directing an air feed to the bottom of each reactor. The rotational movement of water and plastic pieces ensured a sufficient oxygen supply and an optimal contact between the biofilm growing on the surface of the pieces and the substances in waste water. See Figure 2 for a schematic diagram of RBBR experiment setup. Pre-settled municipal waste water was fetched from a local waste water treatment plant at intervals of 1 – 2 weeks. Waste water was pumped continuously to the reactors at flow 1.5 mL/min which computationally lead to hydraulic retention times of 11 h, 11.8 h and 11.8 h, respectively, in the reactors and 1.4 d in the series of reactors. The system was introduced to use by feeding it with municipal waste water for four months. After the introduction period, addition of BPA and HHCB to the waste water was started. Stock solutions of HHCB (50 %, in diethyl phthalate, Sigma-Aldrich) and BPA (≥99%, Sigma-Aldrich) were prepared in acetone and were diluted in sterilized tap water. The solution of BPA and HHCB was pumped continuously to Reactor 1. Samples were taken weekly, directly from each reactor with glass pipettes and were kept frozen in glass bottles until analyses of BPA and HHCB. BOD and suspended solids were analyzed immediately after sampling.
2.2 Fixed bed reactor
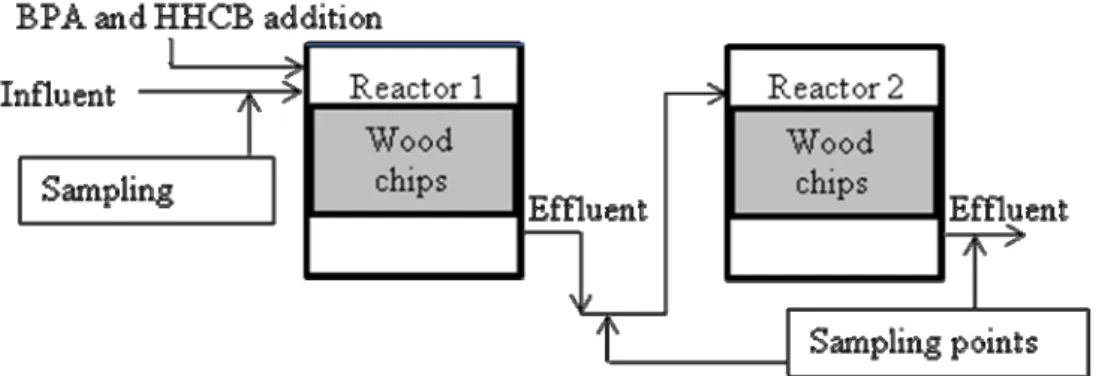
The experiment setup of fixed bed reactor (FBR) consisted of a series of two steel reactors containing wood chips (Figure
3Figure 3) and a tank for the preparation
of synthetic gray water. Figure 3 illustrates the setup as well as sampling points for influent and effluent from Reactor 1 and Reactor 2. Artificial gray water was prepared by mixing shampoo, dishwashing liquid, washing powder, purée soup and sour milk to tap water twice a
week. pH of freshly prepared gray water was 9.7 – 9.3 and it
lowered to 6.8 – 7.1 over the course of time as it was prepared for 2 – 3 days.
25 mm
Figure 4. A schematic diagram of the series of two fixed bed reactors. Artificial gray water influent was prepared in a separate tank.
The system was run by pumping the artificial gray water to the reactors twice a day, in the morning and in the afternoon, to simulate a typical pattern of water use of a household. The flow of the gray water was 5 l/min for 10 minutes, so total of 100 liters of gray water was pumped to the reactors for five days a week.
There was an introduction period of four months prior to the start of BPA and HHCB addition. Solution of BPA and HHCB was prepared in a separate glass bottle immediately prior to use and mixed to gray water within the pumping of gray water. Stock solutions of BPA and HHCB were the same than for RBBR. Samples were taken weekly by collecting 5 l composite samples over one pumping period of ten minutes. For BPA and HHCB analyses the samples were kept frozen in glass bottles, and BOD and suspended solids were analyzed on the sampling day.
2.3 Analytical procedures
BOD was measured by applying OxiTop equipment that is based on respirometric manometric measurement of carbon dioxide. COD was measured by applying commercial cuvette tests of Hach-Lange that correspond to dichromate COD.
BPA and HHCB were analyzed by gas chromatograph-time of flight-mass spectrometer (GC-TOF-MS). Samples were extracted using Strata-X solid phase extraction cartridges (Phenomenex) and eluted with ethyl acetate (Prolabo) and dichloromethane (Merck). Eluates were evaporated to remove dichloromethane and concentrate the final sample. Samples were divided into two subsamples and one of them was derivatized by adding N-methyl-N-TMS-trifluoroacetamide (MSTFA, Fluka) to enhance the performance of BPA analysis.
3 RESULTS AND DISCUSSION
Preliminary results about the overall function of the experiment setups as well as the succession in removal of BPA and HHCB will be introduced and discussed.
3.1 Purification of waste water
As expected, majority of easily biodegradable material that is measured as biochemical oxygen demand (BOD) was removed in the first stage of waste water treatment in both RBBR and FBR. (See Figure 5) This created favorable conditions for BPA and HHCB
Linnaeus ECO-TECH ´10 Kalmar, Sweden, November 22-24, 2010
0 50 100 150 200 250
BOD COD Suspended
solids
(mg
/l
)
WW influent Reactor 1 effluent Reactor 2 effluent Reactor 3 effluent
Figure 5. BOD, COD and suspended solids in municipal waste water (A) and in artificial gray water (B). Averages over the introduction period.
Removal in chemical oxygen demand (COD) approximates to removal of BOD and the remaining COD refers to the presence of non-biodegradable substances, including micropollutants such as BPA and HHCB, in waste water. Some of COD was probably carried out of the reactors attached to suspended solids.
3.2 Removal of BPA and HHCB
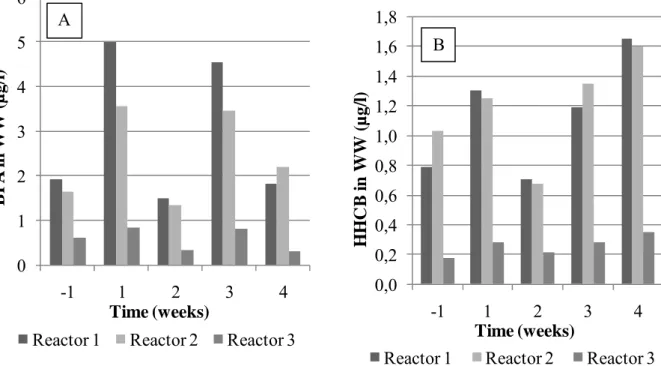
Due to the experiment setup in RBBR (Figure 2), in which BPA and HHCB addition was done continuously to Reactor 1, there was not a value for BPA and HHCB concentration in municipal waste water influent right before the addition of BPA and HHCB. Instead, the concentrations in Reactor 1, 2 and 3 refer to the situation 5.5, 16 and 28 hours after chemical addition, respectively, due to the hydraulic retention time of the system. However, Figure 6 illustrates that remarkable removals of BPA and HHCB occur when effluent concentrations of Reactor 1 and Reactor 3 (5.5 hours and 28 hours) are compared. See also Table 1 for concentrations of BPA and HHCB in municipal waste water in the different stages of RBBR.
Table 1. Concentratios of BPA and HHCB (µg/l) in municipal waste water 1 week prior to the start of chemical addition and 1, 2, 3 and 4 weeks after. Removals (%) in Reactor 2 and 3 compared to Reactor 1 are presented in parentheses.
BPA HHCB
Time
(weeks) Reactor 1 Reactor 2 Reactor 3 Reactor 1 Reactor 2 Reactor 3 -1 1.92 1.66 (14) 0.61 (68) 0.79 1.03 0.18 (78) 1 5.00 3.55 (29) 0.84 (83) 1.30 1.25 (4) 0.28 (78) 2 1.50 1.35 (10) 0.34 (78) 0.70 0.68 (3) 0.21 (70) 0 20 40 60 80 100 120 140 160 180
BOD COD Suspended
solids
(m
g
/l)
GW influent Reactor 1 effluent
Reactor 2 effluent
0 1 2 3 4 5 6 -1 1 2 3 4 B P A in W W (µ g /l) Time (weeks)
Reactor 1 Reactor 2 Reactor 3
A
Figure 6. BPA (A) and HHCB (B) in municipal waste water 1 week prior to the start of BPA and HHCB addition and 1, 2, 3 and 4 weeks after.
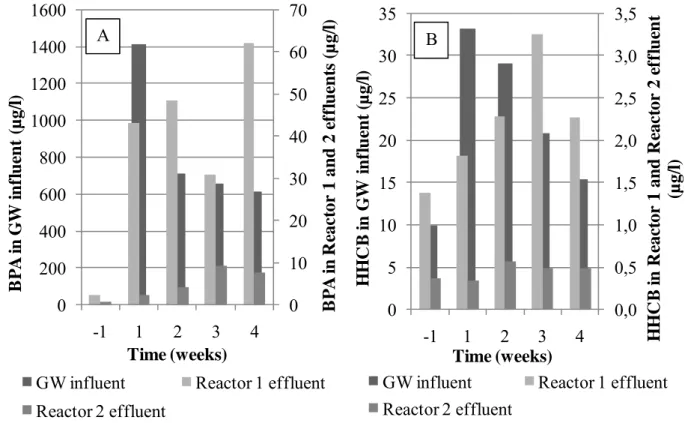
The goal was to sustain an equal concentration of BPA and HHCB in the gray water influent, but the concentration of both chemicals varied substantially. As it is shown in Table 2 and
Figure 7, removal of both BPA and HHCB in Reactor 2 lowered in the course time. Hence, it
is propable that removal was due to adsorpion of the chemicals to the wood chips that served as carrier material in the reactors. As the chemical addition was continued, the content of Reactor 1 got saturated with the chemicals and excess of them was flown out. Since only a small proportion of added chemicals reach Reactor 2, its saturation will take more time. Nevertheless, bound BPA and HHCB are now in contact with microbes living on the wood chips. A rise in removal percentage caused by biological degradation is expected as the experiment is continued and microbial population is adapted.
Table 2. Concentratios of BPA and HHCB (µg/l) in artificial gray water 1 week prior to the start of chemical addition and 1, 2, 3 and 4 weeks after. Removal (%) from influent are presented in parentheses.
BPA HHCB
Time
(weeks) GW influent Reactor 1 effluent Reactor 2 effluent GW Influent Reactor 1 effluent Reactor 2 effluent -1 3.41 2.37 (31) 0.68 (80) 9.96 1.38 (86) 0.36 (96) 1 1413.90 43.05 (97) 2.44 (100) 33.24 1.82 (95) 0.34 (99) 2 709.25 48.40 (93) 4.14 (99) 29.05 2.29 (92) 0.57 (98) 3 659.40 30.74(95) 9.28 (99) 20.80 3.25 (84) 0.48 (98) 4 615.45 62.03 (88) 7.67 (98) 15.39 2.27 (85) 0.49 (97) 0,0 0,2 0,4 0,6 0,8 1,0 1,2 1,4 1,6 1,8 -1 1 2 3 4 HHC B in W W (µ g /l) Time (weeks)
Reactor 1 Reactor 2 Reactor 3
Linnaeus ECO-TECH ´10 Kalmar, Sweden, November 22-24, 2010
0 10 20 30 40 50 60 70 0 200 400 600 800 1000 1200 1400 1600 -1 1 2 3 4 B P A in R eact o r 1 and 2 e ff luent s ( µ g/ l) B P A in GW in fl u en t (µ g /l) Time (weeks)
GW influent Reactor 1 effluent
Reactor 2 effluent A
Figure 7. BPA (A) and HHCB (B) in artificial gray water 1 week prior to the start of BPA and HHCB addition and 1, 2, 3 and 4 weeks after.
4 CONCLUSIONS
Valuable information about the function of the experiment setups have been reached so far. The experiments will be continued to let the microbial communities to adapt in biodegradation of BPA and HHCB. A study of differences in microbial communities in each stage of RBBR and FBR by denaturing gradient gel electrophoresis (DGGE) is under way. In future, microbiology of waste water treatment and biodegradation of chosen micropollutants in the multi-stage waste water treatment systems will be studied by applying 454 pyrosequencing to the characterization of bacteria and fungi.
AKNOWLEDGEMENTS
This study is funded by Tekes – the Finnish Funding agency for Technology and Innovation.
REFERENCES
[1] Kolpin, Furlong, Meyer, et al. 2002. Pharmaceuticals, hormones, and other organic wastewater contaminants in US streams, 1999-2000: A national reconnaissance.
Environ.Sci.Technol. 36, 1202-1211.
[2] Rowsell, Tangney, Hunt and Voulvoulis. 2010. Estimating Levels of Micropollutants in Municipal Wastewater. Water Air and Soil Pollution 206, 357-368.
[3] Reiner, Berset and Kannan. 2007. Mass flow of polycyclic musks in two wastewater treatment plants. Arch.Environ.Contam.Toxicol. 52, 451-457.
0,0 0,5 1,0 1,5 2,0 2,5 3,0 3,5 0 5 10 15 20 25 30 35 -1 1 2 3 4 HH C B in R eac to r 1 and R eact o r 2 e ff lu en t (µ g /l) HHC B in GW in fl u en t (µ g /l) Time (weeks)
GW influent Reactor 1 effluent
Reactor 2 effluent
[4] Bester. 2005. Polycyclic musks in the Ruhr catchment area - transport, discharges of waste water, and transformations of HHCB, AHTN and HHCB-lactone. Journal of Environmental
Monitoring 7, 43-51.
[5] Bester. 2004. Retention characteristics and balance assessment for two polycyclic musk fragrances (HHCB and AHTN) in a typical German sewage treatment plant. Chemosphere 57, 863-870.
[6] Jackson and Sutton. 2008. Sources of endocrine-disrupting chemicals in urban wastewater, Oakland, CA. Sci.Total Environ. 405, 153-160.
[7] Gong, Ran, Chen, Yang and Ma. 2009. Occurrence and environmental risk of endocrine-disrupting chemicals in surface waters of the Pearl River, South China. Environ. Monit.