Research
PROSIR - Probabilistic Structural
Integrity of a PWR Reactor
Pressure Vessel
2015:09
SSM perspective Background
Following an OCDE round robin proposal, 16 participants from 9 countries (USA, Japan, Korea (6 participants), Sweden, Germany, Czech Republic, Spain, EC and France (3 participants)) have been involved in a round robin study called PROSIR, Probabilistic Structural Integrity of a PWR Reactor Pressure Vessel. The PROSIR project started already in 2003 and a final draft version of the main report of the project was is-sued in 2011.
Objectives
The primary objective has been to issue recommendations of best prac-tices when performing probabilistic analysis of a reactor pressure vessel containing flaws for obtaining the failure probability. Another objective has been to understand what the key parameters are in this type of approach.
Results
1. The chosen K-solution is an important part of fracture mechanic analysis for different stress distributions and different defect locations. The used K-solutions should be verified since this will influence the probabilistic results considerably.
2. Special care should be taken when analysing cracks in the cladding area because of the stress discontinuity due to the different thermal expansion coefficients in the stainless steel cladding and the reactor pressure vessel material.
3. For analysing thermal transients, it is recommended to use material property variations with temperature.
4. To understand and verify the probabilistic results, it is recommended to perform sensitivity studies.
5. The sensitivity study presented in the report indicates that the standard deviation of the fracture toughness and RTNDT shift curve are the largest contributor to the probability of crack initiation in the reactor pressure vessel.
Need for further research
There is a need to further compare different probabilistic tools to ana-lyse the failure probability of a reactor pressure vessel. One example is to explore the role of warm pre-stressing and constraint effects.
Project information
Contact person SSM: Björn Brickstad Reference: SSM 2008/39
2015:09
Author: Peter Dillström
Inspecta Technology AB
PROSIR - Probabilistic Structural
Integrity of a PWR Reactor
SSM 2015:09
This report concerns a study which has been conducted for the Swedish Radiation Safety Authority, SSM. The conclusions and view-points presented in the report are those of the author/authors and do not necessarily coincide with those of the SSM.
Table of content
Page
1
INTRODUCTION ... 3
2
SUMMARY OF THE PROSIR FINAL DRAFT REPORT ... 3
2.1
Introduction ... 3
2.2
Phase 0 – General problem definition ... 3
2.2.1
RPV geometry and material data ... 3
2.2.2
Defect assumptions ... 4
2.2.3
Transients and other assumptions regarding loads and stresses ... 5
2.2.4
Assumptions regarding parameters that are considered to be probabilistic ... 6
2.3
Phase 1 – Deterministic analysis ... 7
2.3.1
Analysis of the thermal transients ... 7
2.3.2
Calculation of the stress intensity factor for a surface defect ... 8
2.3.3
Calculation of the stress intensity factor for an internal defect ... 9
2.3.4
Calculation of crack initiation as a function of aging for a surface defect ... 11
2.3.5
Calculation of crack initiation as a function of aging for an internal defect ... 11
2.4
Phase 2 – Probabilistic analysis ... 12
2.4.1
Toughness property distribution versus aging ... 12
2.4.2
Probability of crack initiation for a surface defect with a given size ... 13
2.4.3
Probability of crack initiation for an internal defect with a given size ... 14
2.4.4
Probability of crack initiation using a surface defect distribution ... 15
2.5
Phase 3 – Crack arrest ... 16
2.5.1
Probability of crack arrest for a surface defect with a given size ... 16
2.6
Project conclusions and recommendations ... 17
2.6.1
Major conclusions ... 17
2.6.2
Recommendations for best practices ... 17
3
THE PROSIR FINAL DRAFT REPORT – REMARKS FROM INSPECTA ... 19
3.1
Remarks on the general problem definition ... 19
3.2
Remarks on the analysis of the thermal transients ... 20
3.7
Remarks on the probability of crack arrest for a surface defect with a given size ... 26
3.8
Remarks on the project conclusions and recommendations ... 26
4
SENSITIVITY ANALYSIS PERFORMED BY INSPECTA... 27
4.1
Identification of key parameters and their influence on the resulting probabilities ... 27
4.2
Sensitivity study – defect size ... 30
4.3
Sensitivity study – defect orientation ... 32
4.4
Sensitivity study – residual stresses ... 33
4.5
Sensitivity study – fracture toughness representation ... 34
5
SUMMARY ... 36
6
ACKNOWLEDGEMENT ... 36
1
INTRODUCTION
PROSIR (Probabilistic Structural Integrity of a PWR Reactor Pressure Vessel) was a round robin exercise with the primary objective to issue some recommendations of best practices when performing probabilistic analysis of RPV. Another objective was to try to understand what the key parameters are in this type of approach.
Following an OCDE round robin proposal, 16 participants from 9 countries (USA, Japan, Korea 6 participants, Sweden, Germany, Czech Republic, Spain, EC and France 3 participants) was involved in the round robin. The PROSIR project then started in 2003 and the calculations were finalized in 2007. A final draft version of the main report of the project was sent out in 2011 [1].
In this report a summary of the PROSIR round robin is presented together with additional remarks from Inspecta (participant number 8). Finally, a sensitivity analysis performed by Inspecta is also summarized in this report.
2
SUMMARY OF THE PROSIR FINAL DRAFT REPORT
2.1
Introduction
As mentioned above, PROSIR was a round robin exercise with the primary objective to issue some recommendations of best practices when performing probabilistic analysis of RPV. Another objective was to try to understand what the key parameters are in this type of approach.
The project was divided into four steps (phases) starting with a definition of the different parameters that should be considered when performing a probabilistic analysis of RPV. In the next step several deterministic analyses were performed to ensure that all the participants had understood the problem definition from the previous step. Then the probabilistic part of the project, related to initiation of crack growth, was performed. Finally one tried to perform a probabilistic analysis of crack arrest.
2.2
Phase 0 – General problem definition
2.2.1 RPV geometry and material data
For the baseline case a PWR Reactor Pressure Vessel was chosen for the analysis, it had an internal radius of 1994 mm, a total wall thickness of 207.5 mm (with a cladding thickness of 7.5 mm). All the relevant material data were defined (for the base metal, weld metal and the cladding). In [1] typical data for thermal expansion coefficient, conductivity, diffusivity, density, yield strength, Young modulus, Poisson ratio, stress strain curve, fracture toughness KIc (ASME curve or upper shelf
toughness) can be found. Also relevant for this analysis [1] are data for initial RTNDT (the Reference Temperature for Nil Ductility Transition), copper content, nickel content, phosphorus content, fluence on the inner surface (as a function of time) and a definition of the shift of the ASME curve as a function of fluence.
Ic36.5 3.1exp 0.036
NDT55.5
K
T RT
(2.1)
2 0.35 17.3 1537 0.008 238 0.08 191 NDT RT P Cu Ni Cu
(2.2) 2.2.2 Defect assumptionsFor the baseline case, surface and internal (underclad) defects orientated in the axial direction are included in the analysis. Three different defect assumptions are used in the probabilistic analysis: 1) A semi-elliptical surface defect with a fixed size according to Fig. 2.1 (depth = 19.5 mm, total
length = 117 mm).
2) An elliptical internal defect with a fixed size according to Fig. 2.2 (total depth = 12 mm, total length = 72 mm). This defect is also called an underclad defect because it touches the interface between the cladding and the base/weld material.
3) A semi-elliptical surface defect depth distribution. It is assumed that this defect is only present in base/weld material (and not in the cladding). This defect distribution is (within PROSIR) called the Marshall/PNNL-distribution and can be found in Fig. 2.3.
Fig. 2.1. A semi-elliptical surface defect (a’ = 19.5 mm, 2l = 117 mm).
flaw depth (inches) 0.0 0.2 0.4 0.6 0.8 1.0 1.2 1.4 1.6 1.8 2.0 pr ob ability d ensity (no rmalize d to 1.0 ) 1e-6 1e-5 1e-4 1e-3 1e-2 1e-1 1e+0 Marshall flaw-size PDF
Figure 3(a). Illustration of flaw depth PDF generated during PFM analysis for embedded flaws in welded material. Postulated flaw depths are considerably more shallow than those postulated by Marshall flaw-depth PDF.
Fig. 2.3. The Marshall/PNNL defect depth distribution compared with the original Marshall distribution.
2.2.3 Transients and other assumptions regarding loads and stresses For the baseline cases, three different transients were considered:
Tr1 Close to a typical SBLOCA (Small-Break Loss-Of-Coolant Accident). Tr2 Close to a typical SLB (Steam Line Break).
Tr3 Close to a typical PTS (Pressurized Thermal Shock).
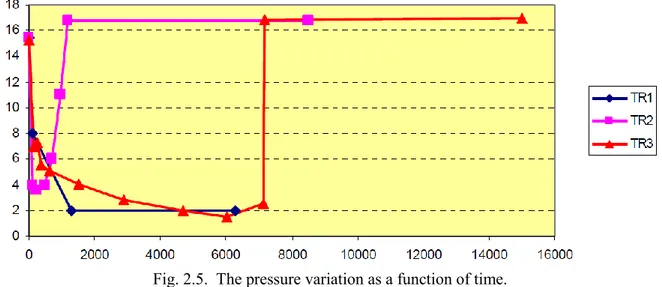
The temperature variation as a function of time in the transients is found in Fig. 2.4. The pressure variation as a function of time in the transients is found in Fig. 2.5.
Fig. 2.5. The pressure variation as a function of time. For the baseline case, no residual stresses were included in the analysis. 2.2.4 Assumptions regarding parameters that are considered to be probabilistic
Below is a short description regarding the parameters that are considered to be probabilistic (for the baseline cases). Please note that there are 20 probabilistic parameters in the analysis.
- The mean value of the fluence (on the inner surface) is given as a function of time. The standard deviation is 10% of the mean value.
- The defect depth distribution is given in Fig. 2.3.
- The mean value of the yield strength is given as a function of temperature (for the base and weld material). The standard deviation is 30 MPa (base material) or 40 MPa (weld material). - The mean value of the Young modulus is given as a function of temperature (for the base and
weld material). The standard deviation is 10 GPa (base/weld material).
- The mean value of the fracture toughness (in the transition region) is given by the ASME initiation curve (see Eq. 2.1). The standard deviation is 15% of the mean value. The fracture toughness distribution is truncated between -3 sta.dev and +3 sta.dev.
- The mean value of the fracture toughness (at the upper shelf) is 220 MPa
m
. The standard deviation is 15 MPam
. The fracture toughness distribution is truncated between -3 sta.dev and +3 sta.dev.- Similar data are given for the fracture toughness at arrest (ASME arrest curve etc.).
- The mean value of the initial RTNDT is -20°C (base material) or -30°C (weld material). The standard deviation is 9°C (base material) or 16°C (weld material).
- The mean value of the copper content is 0.086 (base material) or 0.120 (weld material). The standard deviation is 0.01 (base/weld material).
- The mean value of the nickel content is 0.72 (base material) or 0.17 (weld material). The standard deviation is 0.05 (base/weld material).
- The mean value of the phosphorus content is 0.0137 (base material) or 0.0180 (weld material). The standard deviation is 0.001 (base/weld material).
- The mean value of the RTNDT shift is given by the shift curve (see Eq. 2.2, for the base material). The standard deviation is 10°C. The shift distribution is truncated between -3 sta.dev and +3 sta.dev.
2.3
Phase 1 – Deterministic analysis
A deterministic approach based of mean value of each random parameter has been done as a pre-requisite to assure a perfect fitting at this level of all the methods used by all the participants. The defect is considered axial, located in a longitudinal weld, 2 types of defects are considered (surface and internal (underclad), see Fig. 2.1-2.2).
2.3.1 Analysis of the thermal transients
First an analysis of all the transients was performed and temperatures and stresses through the thickness were calculated (see Fig. 2.6).
Fig. 2.6. Temperature as a function of time in transient Tr1 (at a position equal to the crack tip). In general there were a good agreement regarding temperature and stresses between all the participants. Some differences that could be found, see participant 4_2 in Fig. 2.6, were mainly related to the handling of the stress free temperature or the handling of the temperature dependence of the material data.
2.3.2 Calculation of the stress intensity factor for a surface defect
Then, all the participants calculated the stress intensity factor (KI) for a surface defect (see Fig. 2.7).
Fig. 2.7. KI as a function of time in transient Tr1 (a surface defect).
For a surface defect, there were large differences in the calculation of KI (see the example in Fig. 2.7).
This difference was mainly related to the chosen KI-solution [1], especially how the different solutions
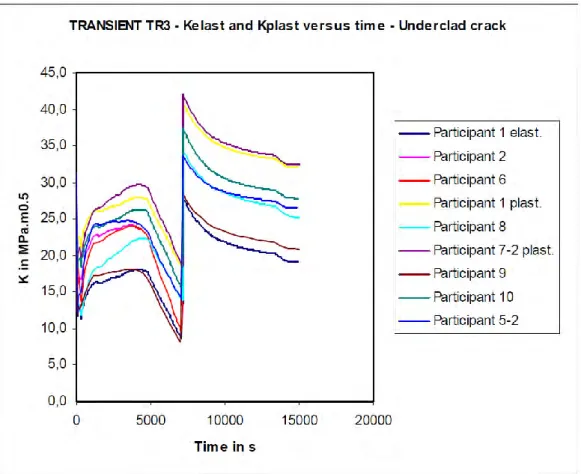
2.3.3 Calculation of the stress intensity factor for an internal defect
Then, all the participants calculated the stress intensity factor (KI) for an internal defect (see Fig.
2.8-2.9).
Fig. 2.9. KI as a function of time in transient Tr3 (an internal defect).
For an internal defect (i.e. an underclad defect, evaluated at the deepest point B), there were also large differences in the calculation of KI (see the examples in Fig. 2.8-2.9). This difference was mainly
related to the chosen KI-solution, how the stresses were evaluated and if a plastic zone correction were
used (see the example in Fig. 2.9, which shows that the highest KI-values corresponds to the
2.3.4 Calculation of crack initiation as a function of aging for a surface defect
Then, all the participants did a direct comparison between the stress intensity factor (KI) and the
calculated fracture toughness for a surface defect (see Fig. 2.10). This comparison was made with an increasing amount of aging (i.e. increasing amount of irradiation embrittlement).
Fig. 2.10. Comparison between the stress intensity factor (KI) and the calculated fracture toughness
for a surface defect (transient Tr1).
Because of the large differences in the calculation of KI (see the example in Fig. 2.7) there was also a
large difference in the estimation of initiation of crack growth (when it should occur). For the transient Tr1 crack initiation occurred for a crack tip temperature between 35°C and 90°C or without initiation for some participants (dependent of aging, see an example in Fig. 2.10). Also, several participants had misunderstood how to evaluate RTNDT at the crack tip (because the problem statement was unclear). 2.3.5 Calculation of crack initiation as a function of aging for an internal defect
Then, all the participants did a direct comparison between the stress intensity factor (KI) and the
calculated fracture toughness for an internal defect. The results and the conclusions were similar to the case with a surface defect.
2.4
Phase 2 – Probabilistic analysis
2.4.1 Toughness property distribution versus aging
First, a check was made to see if the different participants have understood the definition of toughness property distribution versus aging (checked the mean value of RTNDT). In this analysis the initial RTNDT, chemical composition (Cu, Ni, P), shift curve, fluence level (fixed or probabilistic) was considered to be probabilistic parameters.
Fig. 2.11. The mean value of RTNDT versus aging (for the weld material).
As can be seen in Fig. 2.11 there where an excellent agreement between the different participants (except two participants).
2.4.2 Probability of crack initiation for a surface defect with a given size
Then, the probability of crack initiation for a surface defect (with a given size) was evaluated. A typical result can be found in Fig. 2.12 (using transient Tr3 and weld material).
Fig. 2.12. Conditional probability of crack initiation (PCI) versus aging (surface defect, transient Tr3 and weld material).
Figures 2.12 shows that there are quite good agreement between the different participants except for some participants that are one or two decades in difference (mainly related to differences in the calculation of KI). The agreement seems better for high RTNDT level (or fluence level) or for higher probability of crack initiation level.
2.4.3 Probability of crack initiation for an internal defect with a given size
Then, the probability of crack initiation for an internal defect (with a given size) was evaluated. A typical result can be found in Fig. 2.13 (using transient Tr3 and base material).
Fig. 2.13. Conditional probability of crack initiation (PCI) versus years of operation (internal defect, transient Tr3 and base material).
The figure above shows quite good agreement between some participants. One of the participants has larger values independent of the number of years in operation, the reason being that that this participant evaluated the results at point A instead of point B (larger KI closer to the surface and also
2.4.4 Probability of crack initiation using a surface defect distribution
Then, the probability of crack initiation for a surface defect (using a surface defect distribution) was evaluated. Some results can be found in Fig. 2.14-2.15 (using transient Tr3 and base material).
Fig. 2.14. Conditional probability of crack initiation (PCI) versus aging (surface defect distribution, transient Tr3, base material and crack initiation in the cladding).
Fig. 2.15. Conditional probability of crack initiation (PCI) versus aging (surface defect distribution, transient Tr3, base material and no crack initiation in the cladding).
Fig. 2.14-2.15 shows that there is a large difference between the participants related to crack initiation using a defect distribution. A particular difference is connected to the defect distribution origin: some consider the inner surface (with small defects in the cladding), some others consider the defect
2.5
Phase 3 – Crack arrest
2.5.1 Probability of crack arrest for a surface defect with a given size
A few participants analyzed the probability of crack arrest after initiation. The procedure used is generally the ASME Code procedure. Some results can be found in Fig. 2.16.
Fig. 2.16. Probability of crack arrest (PCA) versus aging (surface defect, transient Tr3 and base material).
Due to large misunderstanding of the round robin definition by different participants, big scatter in the results was observed and the round robin was cancelled.
2.6
Project conclusions and recommendations
2.6.1 Major conclusions
Below are some of the major conclusions reported in [1]:
- The link between deterministic sensitivity studies and different probabilistic analysis is essential. - Intermediate validation of the PFM analysis is important for verification of the result validity. - Using the same data and the same models and criteria the results are in a good agreement for
crack initiation of a single crack, but not perfect for the for a flaw distribution. - User error or un-precise specification can lead to major final result errors. 2.6.2 Recommendations for best practices
Recommendations regarding temperature and stress analysis
Many partners use all the material property variations with temperature in their temperature analysis and in their stress analysis. Comparison made within the project confirms that this is a recommended practice, in particular for high amplitude thermal shock stress analysis and consequently for fracture mechanic parameter evaluation (K or J).
Recommendations regarding K-solutions
The chosen K-solution is an important part of fracture mechanic analysis for different stress distributions and different defect locations: through clad surface defect, no clad surface defect, internal (underclad) defect and internal (embedded) defect.
One difficulty in any K-solution is connected to the stress profile in the cladding area with discontinuity due thermal expansion coefficients; it needs a specific development to consider this in the influence function method.
One other important factor is connected to plasticity considerations. In many applications plasticity correction factors are not used.
The reference values for K-solution are:
- For elastic approaches: finite element method from NRI, FAVOR from ORNL, EDF using RCCM-RSEM values and CEA for surface breaking cladding.
- For J approach or elastic plus plasticity correction: finite element method from NRI, EDF-CEA using RCCM-RSEM values.
Recommendations regarding fracture criteria
In term of fracture criteria all the partners use the tangency between the load history (K versus time) and the corresponding material resistance (KIC versus time, temperature and fluence). The influence of
Recommendations regarding the calculation of probabilistic crack initiation
In order to perform probabilistic crack initiation analysis a few recommendations are suggested: - Use a precise deterministic fracture mechanic model.
- Clear specifications in all the data: from inner surface, from base metal/cladding interface. - Particular attention to the cladding transition to base metal: stresses, K, toughness, defect
definition.
- Probabilistic fracture mechanic tools needs a lot of sensitivity studies, associated to a large number of deterministic analysis in order to confirm the effects of different data or models. - A formal validation-verification program has to be developed/performed for each computer
program.
- Some complementary works are needed in different directions: - Low conditional probability less than 10-7 per reactor per year.
- Sum of each probability along the transient or maximum during the transient. - Effect of each cut-off (truncation): on data or defect distribution.
3
THE PROSIR FINAL DRAFT REPORT – REMARKS FROM INSPECTA
3.1
Remarks on the general problem definition
The fracture toughness (in the transition region), the fracture toughness (at the upper shelf), the fracture toughness at arrest and the RTNDT shift curve are truncated between -3 sta.dev. and +3sta.dev. Using truncation in the parameter distributions may lead to error in the results. Inspecta did a test and treating these parameters as not being truncated may give a difference of 1-2 decades (using simple Monte Carlo Simulation). Also there is the possibility of incorrect treatment of the transition from upper shelf toughness to toughness in the transition region.
In sect. 2.2.2 a semi-elliptical surface defect depth distribution is defined. As mentioned earlier, some participants considered the inner surface as the start of the distribution and other started the distribution at the base metal/cladding interface. Another difference was that some used both an upper and a lower truncation of the distribution. And finally some used a bi-linear approximation (see Fig. 3.1) while other used tabulated values (see Fig. 2.3) or a linear approximation. Inspecta did a test and this could give a difference of approximately 1 decade (larger if upper shelf toughness dominates the analysis). y = e-17.508x y = 0.02001e-5.90382x 1.E-08 1.E-07 1.E-06 1.E-05 1.E-04 1.E-03 1.E-02 1.E-01 1.E+00 0.00 0.25 0.50 0.75 1.00 1.25 1.50 1.75 2.00 Flaw Depth (inch)
P( >a ) Marshall Distribution PNNL Flaw Studies y = e-4.06x C:\FLAWDATA\PROSIR FDEPTH1.XLS 0.337 inch
Fig. 3.1. The PNNL defect depth distribution (used in PROSIR) compared with the original Marshall distribution.
3.2
Remarks on the analysis of the thermal transients
The conclusion, that the three transients considered in this project are similar in term of probability of crack initiation, is given in [1]. To check this, Inspecta plotted a comparison between the different transients (see Fig. 3.2).
Fig. 3.2. Probability of crack initiation, comparison between the three transients. SC = surface crack, UCC = underclad crack, SC.. = surface crack distribution.
In Fig. 3.2 the results are given for 40 years of operation, the difference between the three transients was more pronounced at 10 years of operation. Also Inspecta only did an analysis using the transient Tr3 in the case of a surface defect distribution (the baseline case within PROSIR).
3.3
Remarks on the calculation of the stress intensity factors
For a surface defect, there were large differences in the calculation of KI (see the example in Fig. 2.7).
According to [1], this difference was mainly related to the chosen KI-solution. Inspecta investigated
this further and noticed that this was perhaps more related to error in the implementation of the KI
-solutions (and not the chosen KI-solution) from the different Korean participants (4-1 to 4-6). Also a
quite large difference in how the cladding induced stresses were transferred to the KI-solutions was
found.
For an internal defect (i.e. an underclad defect), there were also a large difference in the calculation of
KI (see the examples in Fig. 2.8-2.9). This difference was mainly related to the chosen KI-solution,
how the stresses were evaluated and if a plastic zone correction were used [1]. Inspecta investigated this further and came to the same conclusion (and noticed that the participants 4-1 to 4-6 were unable to get satisfactory results). The plasticity correction can increase the KI-values up to 60% for the
In [1] a recommendation was made regarding KI-solutions:
- For elastic approaches: finite element method from NRI, FAVOR from ORNL, EDF using RCCM-RSEM values and CEA for surface breaking cladding.
- For J approach or elastic plus plasticity correction: finite element method from NRI, EDF-CEA using RCCM-RSEM values.
Inspecta investigated this further and noticed that the KI-solution for a surface defect, as given in
ProSACC, gives similar results as the recommendation above. Also the cladding induced stresses were transferred correctly to the KI-solutions. However, the KI-solution for an internal defect, as given in
ProSACC, cannot treat defects close to the cladding interface and also cannot handle the cladding induced stresses sufficiently correct. (Inspecta has recently implemented a new solution in ProSACC). During the PROSIR project, several participants had difficulties treating the case with an internal defect close to the cladding interface. Also, there were discussions regarding the correct treatment of the plasticity correction. Because of this, there were several projects started to develop new KI
-solutions for an internal defect [2].
3.4
Remarks on the probability of crack initiation for a surface defect with a given
size
Looking at Fig. 2.12 (from [1]) one can see that there are quite good agreement between the different participants except for some participants that are one or two decades in difference. However, if one includes all the participants from Korea (which is not included in the report [1]) the difference is much larger (see Fig. 3.3).
PCI for TR3 weld metal in RR2-a
1.0E-06 1.0E-05 1.0E-04 1.0E-03 1.0E-02 1.0E-01 1.0E+00 3 5 7.5 10 Fluence in 10^23 n/m² PC I Participant 1 Participant 2 Participant 3 Participant 4-1 Participant 4-2 Participant 4-3 Participant 4-4 Participant 4-5 Participant 4-6 Participant 6 Participant 9 Participant 10 Participant 8
Fig. 3.3. Conditional probability of crack initiation (PCI) versus aging (surface defect, transient Tr3 and weld material). This is not the final results, since the comparison was made early in the project.
0,001 0,01 0,1
0 5000 10000 15000
Base
Pinit Base 10y Pinit Base 20y Pinit Base 40y Pinit Base 60y
Pi
ni
t B
ase
Time [s]
Fig. 3.4. Conditional probability of crack initiation versus time in the transient (surface defect, transient Tr3 and base material).
As can be seen in Fig. 3.4, there is a maximum after 7185 seconds in the transient (related to re-pressurization that occurs in the PTS transient).
When we compare the mean KI-values and the mean fracture toughness during the transient (see Fig.
3.5) we notice that the maximum KI and the minimum fracture toughness coincide in time. This
comparison must be made using the mean values from the probabilistic analysis; since the mean values from a deterministic analysis are different (the difference could be very large, up to 40 MPa m at the end of transient Tr3).
0 50 100 150 200 250 0 5000 10000 15000 KI KIc [10 years] KIc [20 years] KIc [40 years] KIc [60 years] KI or K Ic Time [s]
Fig. 3.5. Comparison between the mean KI-values and the mean fracture toughness during the transient Tr3 (surface defect and base material).
Now the conditional probability of crack initiation versus time in the transient can be plotted in Fig. 3.6 (with consideration of the upper shelf toughness). Some participants did this incorrectly, without proper consideration of the upper shelf toughness, which could give very conservative results.
0,001 0,01 0,1
0 5000 10000 15000
RR2a - Tr3 - Base
Pinit Base 10y Pinit Base 20y Pinit Base 40y Pinit Base 60y
Pi ni t B ase Time [s] 10-40 10-38 10-36 10-34 10-32 10-30 10-28 10-26 0 5000 10000 15000 RR2a - Tr3 - Base
Pinit Base 10y Pinit Base 20y Pinit Base 40y Pinit Base 60y
Pi
ni
t B
ase
Time [s]
3.5
Remarks on the probability of crack initiation for an internal defect with a
given size
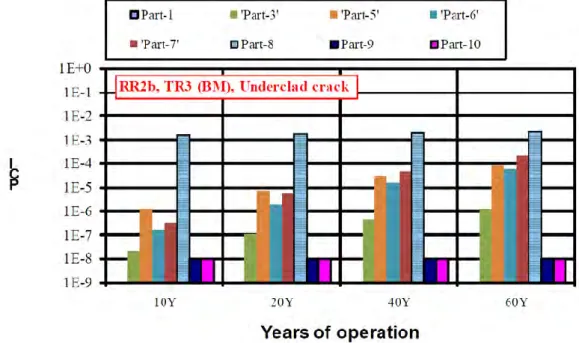
As mentioned earlier, several participants had difficulties treating the case with an internal defect close to the cladding interface. Because of this, there were several projects started to develop new KI
-solutions for an internal defect [2]. This is more clearly shown in Fig. 3.7 (not included in [1]), where one result is way above all the rest. This is the result from Inspecta, who evaluated the results at point A instead of point B (larger KI closer to the surface and also more irradiation embrittlement).
PCI for TR3 Base metal in RR2-b
1.00E-09 1.00E-08 1.00E-07 1.00E-06 1.00E-05 1.00E-04 1.00E-03 1.00E-02 3 5 7.5 10 Fluence in 10^23 n/m² PC I Participant 1 Participant 3 Participant 4-2 Participant 5 Participant 6 Participant 9 Participant 10 Participant 7 Participant 8
Fig. 3.7. Conditional probability of crack initiation (PCI) versus aging (internal defect, transient Tr3 and base material).
3.6
Remarks on the probability of crack initiation using a surface defect
distribution
In Fig. 3.8, the difference in the results using base or weld material can be found. With the data used in this project, cracks located in the Weld Metal gives somewhat larger probability of crack initiation than cracks located in the Base Metal. In this figure, a comparison between different defect assumption shows that there are quite small differences regarding the calculated probability of crack initiation (at 40 years of operation).
Fig. 3.8. Probability of crack initiation, comparison using base or weld material. SC = surface crack, UCC = underclad crack, SC PNLL = surface crack distribution.
3.7
Remarks on the probability of crack arrest for a surface defect with a given size
As mentioned in Sect. 2.5, due to large misunderstanding of the round robin definition by different participants, big scatter in the results was observed and the round robin was cancelled. This can be further seen in Fig. 3.9, where the probability of crack arrest (PCA) is plotted as a function of time in transient Tr3. Because of the weak definition, the maximum (and minimum) PCA-value occurred at different times in the transient. Also, the probability of re-initiation of crack growth together with the probability of a new arrest was not defined in the round robin.
RR3 - time variation of CPA (if crack initiates), for transient TR3, weld, 60 years
1,E-07 1,E-06 1,E-05 1,E-04 1,E-03 1,E-02 1,E-01 1,E+00 1,E+01 0 1000 2000 3000 4000 5000 6000 7000 8000 9000 10000 11000 12000 13000 14000 15000 16000 17000 time (s) P C A
Part 3 Part 4-1 Part 4-2 Part4-3 Part 5 (base mat!) Part 6
Fig. 3.9. Probability of crack arrest (PCA) versus time in the transient (surface defect, transient Tr3 and weld material).
3.8
Remarks on the project conclusions and recommendations
One of the major conclusions in [1] says that “Using the same data and the same models and criteria the results are in a good agreement for crack initiation of a single crack, but not perfect for the for a flaw distribution.”. This is not altogether true, looking closely at the results a maximum of 7 decades difference can be found. But this difference is actually related to a cut-off used when compiling all the results in an Excel table; the maximum difference without the cut-off was around 15-20 decades. Inspecta also did a comparison between different methods when doing the probabilistic analysis. The methods were FORM, simple Monte Carlo simulation (MCS) and MCS with importance sampling. The differences in the results were quite small (less than half decade).
4
SENSITIVITY ANALYSIS PERFORMED BY INSPECTA
4.1
Identification of key parameters and their influence on the resulting
probabilities
One of the major objectives in the PROSIR project was to try to understand what the key parameters are in this type of approach. This was never achieved within the project, but Inspecta has done several analyses to identify the key parameters.
Firstly, we try to identify what parameter that contributes the most to the calculated conditional initiation probability. To do this, we use a simple approach to investigate on the relative importance of the basic standard normal random variables that is given in a FORM analysis. These can be given be means of the vector * defined as:
* * *
y
y
(4.1)where y* denotes the coordinates of the design point in the standard normal space. The ordering of the
elements in * indicates the relative importance of the random variables in the standard normal space.
Since y* is the coordinate of the design point (or the most probable point of fracture), then ‖y*‖ is
equivalent to the design point and related to the conditional probability of initiation via Pi = Φ(-) (when using a FORM approximation). This means that there is nonlinear relation between the importance factors given below and how they contribute to the calculated conditional fracture probability. These importance factors should therefore be used to get a qualitative understanding of the different parameters/variables relative importance in a probabilistic analysis.
The study below therefore shows the importance factors, i.e. what parameter that contributes the most to the calculated conditional initiation probability.
0 0,2 0,4 0,6 0,8 1 KI c( AS ME ) = 15 % R Tn dt = 1 0° C In iti al R Tn dt = 9° C % C u % P Fl ue nc e = 10 % % N i
Fig. 4.1. Importance factors for the case with a surface defect, transient Tr3, base material and 60 years of operation.
As can be seen in Fig. 4.1, the 15% standard deviation on KIc (the ASME curve) is the largest
contributor to the probability of crack initiation. There are also quite large contributions from the
RTNDT shift curve and the initial value of RTNDT.
Above, the importance factors were given for one of the baseline cases. The purpose was to show what parameter that contributes the most to the calculated conditional initiation probability. Another aspect of a probabilistic analysis is to define what happens to the calculated conditional initiation probability if we introduce a small change in the input data, i.e. what parameter change has the most influence on the calculated conditional initiation probability.
Of interest is therefore the sensitivity of the reliability index with respect to parameters entering the definition of the limit state function g . The sensitivity of is given by:
1
d dg
d G d
. (4.2)
When doing a FORM analysis, the probability of initiation is given as Pi
and differentiated with respect to :
1
i dP d d d d d d d d d d d . (4.3) The sensitivity of the probability of initiation P with respect to parameters i is then given by:
1i
dP dg
d G d , (4.4)
where G and dg d/ is easily computed in any FORM analysis.
The study below then tries to answer the question: What parameter change has the most influence on the calculated conditional initiation probability? Here we investigate a change in the given mean values (same analysis could be done to check the given standard deviation values). The results are normalised (against the conditional initiation probability) to get a better understanding of the interaction between the calculated sensitivities.
0 0,2 0,4 0,6 0,8 1 % P % C u KI c( AS ME c ur ve ) % N i Fl ue nc e In iti al R Tn dt R Tn dt
Fig. 4.2. Check regarding what parameter change has the most influence on the calculated conditional initiation probability (for the case with a surface defect, transient Tr3, base material and 60 years of operation).
4.2
Sensitivity study – defect size
The baseline case, when calculating the probability of crack initiation for a surface defect with a given size, is a defect with a depth = 19.5 mm and length/depth = 6. To check this assumption Inspecta did a sensitivity study with a defect depth that varied between 2 mm up to 100 mm, the results are given in Fig. 4.3 (with explanations as given in the figure).
0 0,02 0,04 0,06 0,08 0,1 0 20 40 60 80 100 Pinit [Tr3 - Base] Crack depth [mm] Increasing KIc Increasing KI Local KI,max Decreasing KI
Fig. 4.3. Sensitivity study with a defect depth that varied between 2 mm up to 100 mm (for the case with a surface defect, transient Tr3).
Given the results in Fig. 4.3, it would be interesting to check the influence of the main contributors to the probability of crack initiation. This could be done by changing the given data with a factor of ±20%. This sensitivity study is presented in Fig. 4.4.
0 0,05 0,1 0,15
0 20 40 60 80 100
Pinit [Baseline case]
Pinit [Kic Error = -20%] Pinit [Kic Error = +20%] Pinit [% P = -20%] Pinit [% P = +20%]
Crack depth [mm]
Fig. 4.4. Sensitivity study for the main contributors to the probability of crack initiation. In Fig. 4.4, the blue lines represent the parameter that contributes the most to the calculated conditional initiation probability (given all the chosen combinations of mean values and standard deviations for all parameters). This is the 15% standard deviation on KIc (the ASME curve). The red
lines represent the parameter with the maximum mean value contribution. This is the parameter Phosphorus content (used in the definition of the RTNDT shift curve).
4.3
Sensitivity study – defect orientation
The baseline case, when calculating the probability of crack initiation for a surface defect with a given size, is a defect with a depth = 19.5 mm and length/depth = 6 and oriented in the axial direction. To check this assumption Inspecta did a sensitivity study with a defect depth that varied between 2 mm up to 100 mm and oriented in the circumferential direction, the results are given in Fig. 4.5.
0,001 0,01 0,1
0 20 40 60 80 100
Pinit [Tr3 - Base - Axial crack]
Pinit [Tr3 - Base - Circumf. crack]
Crack depth [mm]
Fig. 4.5. Sensitivity study with different defect orientation.
As can be seen in Fig. 4.5, the resulting probabilities are of the same order (the maximum value), i.e. the stresses from the transient are dominating (together with the cladding induced stresses) over the stresses from the internal pressure.
4.4
Sensitivity study – residual stresses
The baseline case, when calculating the probability of crack initiation for a surface defect with a given size, is a defect with a depth = 19.5 mm and length/depth = 6 and without weld residual stresses. To check this assumption Inspecta did a sensitivity study with a defect depth that varied between 2 mm up to 100 mm and this time using weld residual stresses equal to 15% of the yield strength, the results are given in Fig. 4.6.
0,001 0,01 0,1 1
0 20 40 60 80 100
Pinit [Tr3 - Without weld res. str.]
Pinit [Tr3 - With weld res. str.]
Crack depth [mm]
Fig. 4.6. Sensitivity study with/without weld residual stresses.
As can be seen in Fig. 4.6, the resulting probabilities are of the same order (the maximum value), i.e. the stresses from the transient are dominating (together with the cladding induced stresses) over the stresses from the internal pressure.
4.5
Sensitivity study – fracture toughness representation
The fracture toughness representation in PROSIR uses the “mean value” version of the ASME reference curve. It would be interesting to compare the results using a Master Curve representation of the fracture toughness. Then the analysis should compare the following curves:
- The ASME Curve (mean value) which is equal to the reference curve divided by 0.7.
- The Master Curve that has been developed by doing a Master Curve analysis of the original data for the ASME reference curve (done by Kim Wallin at VTT).
The fracture toughness curves are summarized in Fig. 4.7 and the results from the sensitivity study is given in Fig. 4.8.
0,0001 0,001 0,01 0,1
0 20 40 60 80 100
Pinit [KIc - ASME]
Pinit [KIc - Master Curve]
Crack depth [mm]
Fig. 4.8. Sensitivity study using different fracture toughness representation.
As can be seen in Fig. 4.8, there are a difference in the resulting probabilities when using different fracture toughness representation. Obviously, using the “mean value” version of the ASME reference curve gives values that are 1 decade larger than using a Master Curve representation of the fracture toughness. This difference is not present in the data, but in the representation of the data. It is possible that the ASME reference curve, being quite complicated, has dependencies between different parameters that are not implemented in the methods used (to calculate probabilities) within the PROSIR project. Therefore, using a Master Curve representation of the fracture toughness is perhaps a better choice than using the “mean value” version of the ASME reference curve.
5
SUMMARY
PROSIR (Probabilistic Structural Integrity of a PWR Reactor Pressure Vessel) was a round robin exercise with the primary objective to issue some recommendations of best practices when performing probabilistic analysis of RPV. Another objective was to try to understand what the key parameters are in this type of approach.
Following an OCDE round robin proposal, 16 participants from 9 countries (USA, Japan, Korea 6 participants, Sweden, Germany, Czech Republic, Spain, EC and France 3 participants) was involved in the round robin. The PROSIR project then started in 2003 and the calculations were finalized in 2007. A final draft version of the main report of the project was sent out in 2011 [1].
The PROSIR project reveals a lot of useful technical information, but the final draft version of the report is still partly unstructured and unclear. Inspecta has tried to summarize the project in a structured way and also include additional remarks to emphasize some parts of the project. Finally, Inspecta has also included some new sensitivity analyses, which gives an understanding on what the key parameters are in the analysis and also discuss the effect of the assumed fracture toughness representation within PROSIR.
6
ACKNOWLEDGEMENT
This research project has been sponsored by Swedish Radiation Safety Authority (SSM) and the Swedish Power Plant Group (Forsmarks Kraftgrupp, OKG Aktiebolag, Ringhals AB and TVO). This support is greatly appreciated.
7
REFERENCES
[1] FAIDY, C., CHAPULIOT, S., DICKSON, T., PISTORA, V., and K. ONAZAWA, (2011), “PROSIR – Probabilistic Structural Integrity of a PWR Reactor Pressure Vessel”, Final Draft Report – Dec 2010.
[2] MARIE, S., and S. CHAPULIOT, (2008), “Improvement of the calculation of the stress intensity factors for underclad and through-clad defects in a reactor pressure vessel subjected to a pressurised thermal shock”, The International Journal of Pressure Vessels and Piping, Vol. 85, pp. 517-531.
Strålsäkerhetsmyndigheten Swedish Radiation Safety Authority
SE-171 16 Stockholm Tel: +46 8 799 40 00 E-mail: registrator@ssm.se Solna strandväg 96 Fax: +46 8 799 40 10 Web: stralsakerhetsmyndigheten.se
2015:09 The Swedish Radiation Safety Authority has a comprehensive responsibility to ensure that society is safe from the effects of radiation. The Authority works to achieve radiation safety in a number of areas: nuclear power, medical care as well as commercial products and services. The Authority also works to achieve protection from natural radiation and to increase the level of radiation safety internationally.
The Swedish Radiation Safety Authority works proactively and preventively to protect people and the environment from the harmful effects of radiation, now and in the future. The Authority issues regulations and supervises compliance, while also supporting research, providing training and information, and issuing advice. Often, activities involving radiation require licences issued by the Authority. The Swedish Radiation Safety Authority maintains emergency preparedness around the clock with the aim of limiting the aftermath of radiation accidents and the unintentional spreading of radioactive substances. The Authority participates in international co-operation in order to promote radiation safety and finances projects aiming to raise the level of radiation safety in certain Eastern European countries.
The Authority reports to the Ministry of the Environment and has around 315 employees with competencies in the fields of engineering, natural and behavioural sciences, law, economics and communications. We have received quality, environmental and working environment certification.