Proceedings of the conference Road Safety on Three Continents in Pretoria, South Africa, 20-22 September 2000
834
0
0
Full text
(2) Contents Opening session P Hendricks, Director, Transportek, CSIR, South Africa Günter Kroj, Professor Dr. BASt, Germany Session 1. Road Safety Problems and Solutions in Africa, Europe and The US Tor Atle Odberg, Public Roads Administration, Norway Adel Al-Yousifi, Sanderland University, Kuwait Gregor Bartl, Austrian Road Safety Board, Austria Maria Sakki, Ministry of Public Works, Greece Ilmar Pihlak, Dagov Antov, Tallin Technical University, Estonia E.L.van der Merwe, CENET, South Africa Session 2 Road Safety Audits Alfred Verweij, Ministry of Transport, The Netherlands Tomasz Szczuraszek, University of Technology and Agriculture, Poland Mr Lanalyawati, Institute of Road Engineering, Indonesia Kenneth Opiela, Transportation Consultants, USA Sesion 3 Modelling Driver Behavior for Roadway Design Rüdiger Lamm, University of Karlsruhe, Germany Richard van der Horst, Henry Stembord, Transportation Research Centre of Ministry of Transport, Weil Janssen, TNO Human Factors, The Netherlands Daniel S Turner, University of Alabama, USA Session 4 Human Performance, Attitudes, Values and Road Safety P.A. Koushiki, Kuwait University, Kuwait, Yousef Alhasan, Civil Eng. Dept. David Shinar, Ben Gurion University, Israel Truls Vaa, Institute of Transport Economics, Norway J, Wessel, V. Schneider, Freie Universität, Berlin, Germany Wendy Watson, Department of Transport, South Africa Torbjörn Falkmer, VTI, Sweden Don Jones, Oak Ridge National Laboratory, USA Lynn Vermaak, CSIR Transportek, South Africa C. Nkosi, CSIR Transportek, South Africa J.P. Assailly, INRETS, France Session 5. Road Safety Problems and Solutions in Africa, Europe and The US C.J. Mollett, University of Stellenbosch, South Africa B. K Yanney, University of Zimbabwe, Zimbabwe C J Bester, University of Stellenbosch, South Africa Shaibu Bawa, Building and road Research Institute, Ghana Tiese de Coning, CSIR Tranportek, South Africa Alvydas Pikünas, Vilnius Gediminas Technical University, Lithuania Nicole Muhlrad, INRETS, France.
(3) Session 6. Traffic Safety Policy, Traffic Safety Programmes and Traffic Safety Work on the National/Regional Level, and Safety Management Techniques and Innovations Daniel Heuchenne, Ministry of Euipment and Transport, Belgium Annie Canel, SETRA, France Trygve Solheim, Institute of Transport Economics, Norway Jos Spriel, CROW, The Netherlands Stefan Lötter, CSIR Transportek Division, South Africa Tapan Datta, Wayne State University, USA Session 7. Developments and Demonstration of Advanced Technology to Improve Road Safety Uwe Elmers, BASt, Germany D. Shinar, Ben Gurion University, Israel Eugene M. Wilson, University of Wyoming, USA Leif Beilinson, Finnish National Road Administration, Finland K. Opiela, Transportation Consultant, USA Session 8 Vulnerable Road Users e.g. Pedestrian and Bicycles Makghophe, Commissioner of Police, Botswana Helius Visser, City Council of Pretoria, South Africa Lars Ekman, University of Lund, Sweden Session 9 Designing and Operating Work Zones for Increased Safety Marieke Martens, TNO Human Factors, The Netherlands Pavel Tucka, CDV, Czech Republic Nicholas J. Garber, University of Virginia, USA Richard A. Cunard, TRB, USA Session 10 Traffic Engineering for Increased Mobility and Safety Jochen Korn, Werner Schnabel, Dresden University of Technology, Germany Joseph C Oppenlander, University of Vermont, USA Bhagwant Persaud, Ryerson Polytechnic University, Canada Uwe Frost, Dr Brenner & Münnish Consulting, Germany K. Opiela, Transportation consultant, USA Session 11. Graduated Licensing, and Other Driver Education and Control Techniques Nils-Petter Gregersen, VTI, Sweden Per Hermansen, Statens Vegvesen Telemark, Norway Hans Mattsson, Swedish National road Administration, Sweden Hans-Yngwe Berg, VTI, Sweden Melvin D Shipp, University of Alabama at Birmingham, USA Session 12 Road Accident Costs and Cost Benefit Evaluation Peep Sürje, Tallin Technical University, Estonia Guido Schuster, Civil Engineering Department of Hamburg, Germany. 2.
(4) Session 13. Traffic Safety Policy, Traffic Safety Programmes and Traffic Safety, Work on the National/Regional Level, and Safety Management Techniques and Innovation Thorsten Kathmann, Institut für Strassenwesen, Germany Pieter Venter, CSIR Transportek, South Africa B K Steinset, Norwegian Public Roads Administration, Norway Jeroen Kempen, Project Manager of the Dutch Traffic Safety Association – 3VO P E J van Vuuren, Technikon, Pretoria, South Africa Session 14 Traffic Laws, Traffic Control and Enforcement Techniques Victoria Gitelman, Transportation Research Institute, Israel Falk Kalus, Dresden University of Technology, Germany Rob Reid Smith, Victoria Police, Australia Session 15 Modelling of Road Safety Jodi L. Carson, Montana State University, USA Göran Tegnér, Transek AB, Sweden Iisakki Kosonen, The Royal Inst. of Technology/centre for traffic simulation research, Helsinki Univ. of Technology/Transportation engineering, Finland Ruth Bergel, INRETS, France Session 16 Traffic Calming and Speed Management C.J. Mollett, University of Stellenbosch, South Africa Dick Slater, NDOT, South Africa Helius Visser, City Council of Pretoria, South Africa Lena Smidfeldt-Rosqvist, University of Lund, Sweden Andre Frieslaar, Hawkins & Osborn, South Africa. 3.
(5)
(6)
(7)
(8)
(9)
(10)
(11)
(12)
(13)
(14)
(15)
(16)
(17)
(18)
(19)
(20)
(21)
(22)
(23)
(24) NEW APPROACHES TO ROAD TRAFFIC SAFETY IN GERMANY Direktor and Professor Dr. Günter Kroj Federal Highway Research Institute / Bundesanstalt für Strassenwesen Bergisch Gladbach / P. O. Box 10 01 50 / Germany Phone: 49-2204-43400 / Fax: 49-2204-43403 / e-mail: kroj@bast.de. 1.. INTRODUCTION. A BASt-project group of scientists and of practioneers elaborated during 1999 under commission of the German Federal Ministry of Transport programmatic proposals for new approaches to the improvement of road traffic safety in Germany [BREUER et al., 1999]. In this context it is important to take into account the federalistic structure of the Federal Republic of Germany with the political independence of the 16 Länder in many sensitive areas of road safety like police enforcement, school education as well as regional and local authorities investments for the road infrastructure. Federal government therefore has always to be aware, that bottom-up activities are unavoidable for a sustainable and strategic road safety work. In the last ten years of the 20th century, 95,000 people were killed on the roads of unified Germany and 5 million people injured. Happily, despite the fact that total travel is increasing, the number of fatalities is falling steadily and in 1999 totalled 7,750, the lowest figure since official road accident statistics were initiated in 1953. Despite this, however, improvement of road safety remains an on-going and extremely important task. The continual reduction in our quality of life caused by more than 2 million accidents each year compels us to concentrate even harder than before on improving road safety in the coming decade. Individual and communal awareness of responsibility must be heightened and a contribution demanded from everybody. The project group proposed to make each individual assume even more personal responsibility – particularly for vulnerable road users. In the age of global communication networks, rapid technological progress, more closely integrated economic and industrial areas and grave demographic change, it is a fact that well-established values, life-styles and demands are changing more quickly than in the past. In view of tight resources and increasing demands, this.
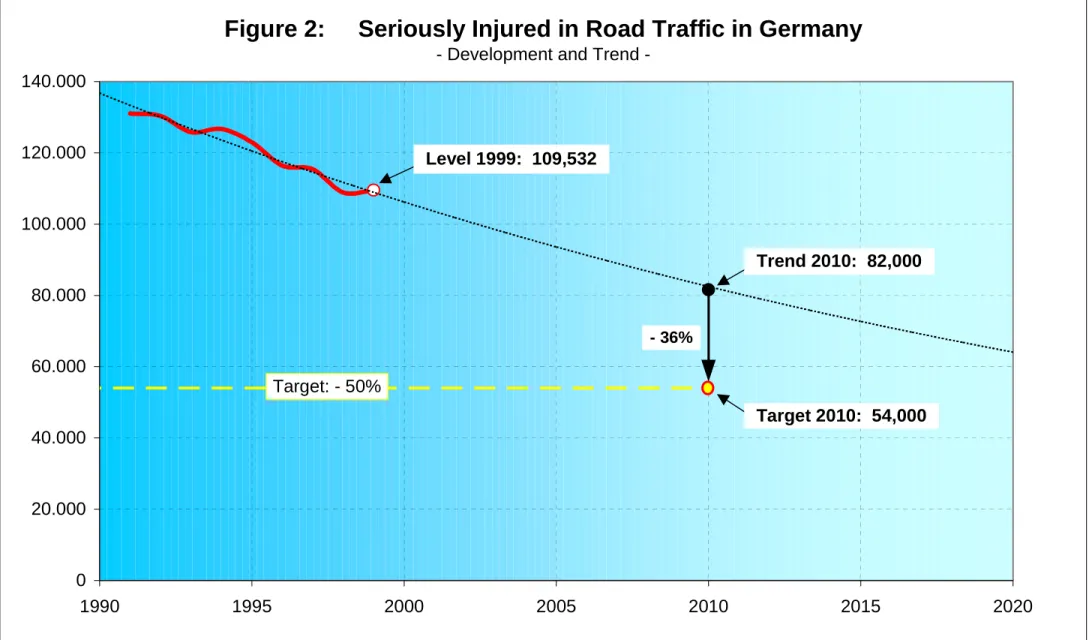
(25) 2. change in structures and values makes it necessary to use the synergy effects of closer collaboration between the health care sector, environmental protection and the technologically and economically supported increase in mobility in order to improve the standard of life and road safety. In an increasingly close-knit Europe, the call is becoming ever louder for accident costs to be carried to a greater extent by the party responsible for causing them in order to charge the costs fairly and to encourage safe behaviour in traffic. At the same time, the European Union emphasised in its most recent action programme that the social responsibility of state and of citizen to increase road safety were two sides of the same coin. In order not to lose orientation and speed in the continual improvement of road safety and also to keep step with the European neighbours, the project group proposed to make heavier demands on the responsibility of the community and of each individual. Clear goals for road safety work are necessary to make this a success and allow us all to profit. For the majority of road users contributing is a matter of course – but it is only when all contribute and accept the obligation for life-long learning that the highest possible level of safety will be reached. A constant reduction in the number of accidents and victims of these accidents, in particular fatalities and the severely injured, will serve as an indicator for the improvement of road safety. The aim is to reduce the number of both fatalities and severely-injured victims by half in the next ten years [figures 1 and 2]. The recommendations of the project group are based on the guiding principle that road accidents are not simply a fateful, unavoidable side-effect of road traffic and mobility but are in most cases result from avoidable human errors. Evaluation of accident consequences shows annual damages of approximately 70,000 million DM in Germany. Only part of the damage is carried by the parties responsible or by their vehicle insurance. More road safety for all can only be achieved if everybody contributes. For this reason all social forces, particularly the state, must work towards everybody making his contribution, the stronger assuming responsibility for the weaker and in this way creating road safety for all. The individual measures for improving road safety are orientated towards specific goals and selected according to efficiency criteria. The implementation of road safety measures and their effects on road safety should be observed and optimised continually. Police accident records are an important basis for objective and targeted road safety research. This basis must be maintained and improved for minor accidents..
(26) 3. Research carried out by the Federal Ministry of Transport, Building and Housing must include investigation of strategies, procedures and techniques for improving the safety, flow, guidance and management of traffic to better exploit existing capacities and must also look into the increased use of other modes of transport to satisfy mobility requirements and thereby reduce the load on road traffic. 2.. Safety Potential. The accident development in recent years and the development forecast to 2010 for Germany show obvious areas for initiating road safety measures. With a generally favourable development of accident occurrence the main problem areas in road safety are: – – –. accidents involving vulnerable road users; accidents involving young drivers; accidents on rural roads.. 2.1 Road Safety of Vulnerable Road Users Vulnerable road users include children, the elderly and the handicapped but also unprotected road users such as pedestrians, bicyclists and motorcyclists. Road safety has not by any means developed as well in recent years for unprotected road users as it has for car occupants. ! safety potential for pedestrians: children between 6 and 9 years of age and elderly people of over 65 years of age have accidents three times as often as 35-44 year-old pedestrians; accident consequences are particularly severe in the case of elderly pedestrians. Making residential areas safe, above all through traffic-calming construction and design measures which are friendly to children and the elderly are therefore of high priority. It is also of absolute necessity to inform drivers even more intensively about age-specific behaviour patterns and the physical and psychological restrictions of children and senior citizens and to be even more insistent in urging drivers to fulfil their responsibilities regarding vulnerable road users. ! safety potential for bicyclists: in the coming years, 15-18 year-old bicyclists, over 55-year-old bicyclists and particularly over 65-year-old bicyclists will have the highest population-related accident risk. Road safety work must therefore provide even more detailed information for and about these target groups and propose suitable measures. On the one hand the bicyclists must recognise their responsibilities and contribute to reducing risk by riding defensively. On the other hand car drivers must take into account, and adapt themselves to, the typical behavioural patterns and deficits of bicyclists..
(27) 4. ! safety potential for motorcyclists: today, the risk of a motorcycle user being killed in road traffic is seven times higher than that of other road users. Total motorcycle travel will increase greatly in the coming years. Road safety measures in this field (such as motorcycle safety training courses offered by the German Traffic Safety Council and his members) are therefore urgently required. As well as intensive education of the motorcyclists, such measures should also inform and motivate car drivers to a greater extent. 2.2 Road Safety of Young Drivers Young drivers present a particular road safety problem. Approximately 22% of road fatalities are made up by 18-24 year-olds; this figure is far higher than the 8% of the population which they make up. The risk of a young driver being killed in a traffic accident is almost three times as high as a driver from the 25-34 year-old age group and almost five times as high as a driver from the 35-54 year-old age-group. A significant reduction in the number of accident victims in this age group would considerably improve the overall balance. Forecasts lead us to expect that the group of 25-34 year-olds will gain in significance with regard to accident occurrence in the future. Measures to reduce the risk-taking and improve the road safety of young drivers should therefore if possible also bear this group in mind. 2.3 Road Safety on Rural Roads Accidents on rural roads have particularly serious consequences: two out of three fatally injured road users die on rural roads. Also, the favourable accident development on all other categories of roads has not been equalled by any means on rural roads. If nothing is done the percentage of fatalities made up by those occurring in accidents on rural roads will continue to increase. This constitutes a particular challenge for future road safety work. New accident analyses show that most attention should be devoted to avoiding accidents which occur: – – –. due to speeding; due to roadway runoffs; when overtaking.. An ecologically acceptable means of avoiding tree accidents with serious consequences would have great safety potential (30% of people killed on rural roads are the victims of tree accidents). A differentiation should therefore be made between.
(28) 5. measures on existing avenues and requirements for the construction of new avenues. It would exceed the scope of this paper if I listed all the measures. I have therefore restricted myself to giving an overview of the different areas in which measures are carried out..
(29) 6. 3.. Behavioural Influence. Road traffic regulations and acceptance and observance of these regulations are necessary for it to be possible to transport people and goods efficiently and safely. More than in other social areas, participation in road traffic requires of participants responsible behaviour and consideration for others. Measures aimed at behavioural influence must therefore make it clear that road traffic is not a matter of self-interest and pleasure but primarily a social task which can only bring benefits for individuals by improving safety for everybody. To a greater extent than in the past it is a matter of making “stronger” road users, as the parties which cause most of the road accidents, the central subject of road safety work in order to provide better protection for “weaker” road users (children, pedestrians, bicyclists). The main areas in road safety work for carrying out measures to influence behaviour are therefore in: – – – 4.. road safety education, safety publicity campaigns and driver training; the design and enforcement of traffic law and; the use of positive incentives. Traffic Infrastructure Design. With regard to traffic infrastructure design there are both traditional and newer measure areas with high potential for road safety. –. It is an on-going necessity to recognise local road construction and traffic management factors which are conducive to accidents and to carry out measures to make accident black-spots less dangerous.. –. In road design, it should not be the case that cross-sections, horizontal and vertical alignment, equipment and maintenance are orientated exclusively to the dictates of simplicity, traffic flow and the interests of the residents but must also guarantee safety. Safety potential is therefore also seen in the area of road design. In order to detect this potential it is intended that designs for new roads and road improvement should be subjected to a so-called safety audit. The work to draw up the safety audit has already begun in a special expert group.. –. Road network planning should also be used not only for regional planning aims such as traffic avoidance, traffic reduction in local authorities and good accessibility, but also for improving traffic safety..
(30) 7. 5.. Vehicle Safety and Telematics. Traffic safety is not conceivable without improvements in vehicle engineering. Many vehicle engineering innovations over the last 30 years were aimed at avoiding or reducing personal injury in accidents, so-called passive safety. Here considerable improvements have been achieved, both through obligatory equipment regulations (e.g. seat belts) and on a voluntary basis (e.g. airbags). It is intended in future to support and supplement this positive development by using vehicle engineering to a greater extent than previously to avoid accidents, i.e. to improve active safety. The use of telematics in traffic can also contribute to the avoidance of accidents. The project group therefore recommended to attach increasing significance to technical innovations which aim to avoid accidents. 6.. Emergency Medical Services. The emergency medical services constitute a public task to improve quality of life in the area of elementary care and life-saving protection against danger. This sector includes first-aid and emergency notification measures as well as the organised emergency medical services, clinical care and the post-care of accident victims and their relatives. 7.. Implementation and Funding of Sustainable Road Safety. The implementation of safety measures and their effects on a sustainable road safety must be constantly observed and optimised. It is therefore proposed to use the Accident Prevention Report, which has been presented to parliament by the Federal Government every two years since 1973, as an instrument for controlling the implementation and success of the road safety activities in Germany the call was made for the necessary federal funds to be make available in order to guarantee planning safety, continuity and consequently the success of a long termed road safety strategy.. 8.. REFERENCE. Breuer, B., Kroj, G., Krupp, R., Maginot, R., Meewes, V., Weich, G., Werber, S.: Mehr Verkehrssicherheit - mehr Lebensqualität. Projektgruppe der Bundesanstalt für Straßenwesen. Bergisch Gladbach, Oktober 1999..
(31) Figure 1:. Road Fatalities in Germany - Development and Trend -. 25.000. 20.000. 15.000. Level 1999: 7,750. 10.000. Trend 2010: 5,200 5.000. - 25%. Target: - 50%. Target 2010: 3,900 0 1970. 1975. 1980. 1985. 1990. 1995. 2000. 2005. 2010. 2015. 2020. BASt - U2p - 28/2000.
(32) 9. Figure 2:. Seriously Injured in Road Traffic in Germany - Development and Trend -. 140.000. 120.000. Level 1999: 109,532. 100.000 Trend 2010: 82,000 80.000 - 36%. 60.000 Target: - 50% Target 2010: 54,000 40.000. 20.000. 0 1990. 1995. 2000. 2005. 2010. 2015. 2020 BASt - U2p - 28/2000.
(33) Session 1. Road Safety Problems and Solutions in Africa, Europe and The US. Experiences with roundabouts in Vestfold county.Accidents, traffic behaviour and geometric design Tor Atle Odberg, Better signs for better road safety Adel Al-Yousifi Results of EU-project “DAN” (Measures for novice drivers) Gregor Bartl Road safety in Greece Maria Sakki Road safety differences in the Baltic-Nordic Region Ilmar Pihlak, Dagov Antov The empowerment of teachers in OBE through traffic safety education E.L.van der Merwe.
(34) July 2000. Experiences with Roundabouts in theVestfold Region Accidents Traffic Behaviour and Geometric Design Tor Atle Odberg, MSc. Public Roads Administration Vestfold Department of Traffic Postboks 2004 N-3103 Tønsberg, Norway Tel +47 33 37 17 00 e-mail: tor.odberg@vegvesen.no. Public Roads Administration Vestfold.
(35) Experiences with roundabouts in the Vestfold Region. Accidents, traffic behaviour and geometric design.. SUMMARY This paper has been prepared by the Public Roads Administration Vestfold. The contents of this paper discuss the results of a study concerning Roundabout safety in the Vestfold Region, Norway. The main subjects of study are as follows: A.. Before and after studies of constructing roundabouts and their effect on traffic safety.. B.. Accident risk studies for roundabouts during the period 1991 to 1995.. C.. Traffic behaviour studies within selected roundabouts and the study of their geometric design.. The main results for each area of study are mentioned below: A.. Before and After Studies (22 junctions) • The studies showed that the number of accidents resulting in injury were reduced by 34.5%. • The average accident rates were reduced from 0.25 to 0.12 • Reduced degree of severity in the present accidents. • There has been a tendency for bicycle accidents to increase whilst pedestrian accidents have decreased.. B.. Accident Risk Studies (33 roundabouts) • The studies showed that the average accident rates were 0.10, which is about double the normal values. • Low degree of accidents severity • 30% of the accidents occur at the entrance to a roundabout, and 20% occur during head to tail collisions.. C.. Traffic Behaviour Studies (6 roundabouts) • High speed at the entrance to the roundabouts • Poor sight lines in many roundabouts. • On average, 20% of the motorists don’t give way at the entrance to a roundabout. • A total of 37% of the motorists do not give way to pedestrians.. INTRODUCTION. Public Roads Administration Vestfold, Norway, July 2000. 1.
(36) Experiences with roundabouts in the Vestfold Region. Accidents, traffic behaviour and geometric design.. The following paper discusses the results of a study concerning the safety of roundabouts in the Vestfold Region in Norway, in the autumn of 1996. The aims for undertaking the study were to answer the following questions: 1. Has the construction of roundabouts led to less accidents and a reduced accident risk? 2. Traffic situation evaluation and risk of accidents occurring in roundabouts? The main areas studied were: • The consequence of constructing 22 roundabouts and the effect on traffic safety analysed through before and after studies. • The accident risk of 33 roundabouts. • The assessment of traffic behaviour and geometric design of six selected roundabouts. Almost all the roundabouts in Vestfold County have an annual average daily traffic (AADT) of between 2000 and 20,000 vehicles and are located in the city areas. The AADT is defined as all traffic entering the roundabout. Sixty five percent of all roundabouts have four junction legs and the remainder have three junction legs. Sixty five percent of the roundabouts are of medium size.. METHODOLOGY Methodology for the Before and After Study The chosen method for the Before and after Study is called "Before and After Study with Control Material". The development of the control material was used to make assumptions about how the development would have been in the future without changing the geometry of the junction. The diagram below describes the process of the Before and after study.. Defining the project. The results are summarised and evaluated. Correction of registered accidents from before situation. Calculation of especially dangerous junctions. Statistically testing of changes in number of accidents. Calculating accident rate. Figure 1: Diagram of the Before and After Study. 1. Defining population number, length of evaluation periods and accident statistics.. Public Roads Administration Vestfold, Norway, July 2000. 2.
(37) Experiences with roundabouts in the Vestfold Region. Accidents, traffic behaviour and geometric design.. 2. Correction of registered number of accidents in the Before Period to make them comparable to the number of accidents in the After Period. The corrections include: a) b) c) d). The regression effect (UCR) General traffic changes (Ct) General accident changes (Cu) Unequal length of time periods (Cp) The corrected number of accidents for the Before Period, Uk is calculated as follows: Uk=UCR·Ct·Cu·Cp. a) The regression effect in accident numbers, which means to correct the data for a possibly abnormal high accident number in the Before Period; The formula for correcting the number of accidents for the regression effect is: α* U1 + (1-α α)*U UCR=α where α=U1/( U1+( U12/k)) ,U is recorded number of accidents and k=0.5 for junctions on main roads in Norway. The formula for calculating the normal expected number of accidents is: U1 =AADT*365*UfN*10-6 where UfN is the normal accident rate which is calculated from the average accident rates for similar junctions. b) General traffic changes from the Before Period to the After Period; Ct=AADTa/AADTb AADTa is the annual average daily traffic in the After Period AADTb is the annual average daily traffic in the Before Period c) General accident changes from the Before Period to the After Period Cu=Ua/Ub Ua is the number of accidents in the After Period Ub is the number of accidents in the Before Period d) Possible unequal length of time of Before and After Period. Cp=Ya/Yb Ya is the number of years in the After Period Yb is the number of years in the Before Period 3. Statistically testing of the changes in accident numbers from Before and After situations. Statistically testing is used to check if the changes are statistically real or just caused by casual variation. The aim of the test is to determine if the change. Public Roads Administration Vestfold, Norway, July 2000. 3.
(38) Experiences with roundabouts in the Vestfold Region. Accidents, traffic behaviour and geometric design.. in the number of likely accidents are caused by the construction of the roundabout. The test is meant to determine the level of significance, or the probability of a real change occurring. The figure below shows how large the reduction in number of accidents must be (% of given number of accidents from Before Period) to be statistically significant for 5% level of significans (P < 0.005). This means that there is 95% probability that the reduction of number of accidents is real. The graph below is based on χ 2 -testing. %. Number of accidents (Before Period) 4. Accident rates are calculated to estimate the probability of being involved in an accident. A high number of accidents can be due to heavy traffic and the accident rate should also be calculated to describe the traffic safety in the junction. The formula for calculating accident rates in the Before and After Periods for each junction: Uf=U·106/AADT·365·t The accident rate, Uf, is defined as the number of accidents per 106 passing vehicles through the junction. U is the number of accidents and t is the number of years in the period. The calculation of the average accident rate with concern on the AADT for a group of junctions: Uf=Σ(U·106)/ Σ(AADT·365·t). The standard deviation (spread around the middle value) tells something about how much the values for each junction deviate from the average value:. Public Roads Administration Vestfold, Norway, July 2000. 4.
(39) Experiences with roundabouts in the Vestfold Region. Accidents, traffic behaviour and geometric design.. S=√(((∑ ∑(Uf-Ufgj)2)/(n-1)) S Uf Ufgj n. is the accident rate spread inside each group of junctions is the calculated accident risk for each junction is the calculated average accident risk the number of observations. 5. A calculation method built on average values from a large number of known junctions in Norway, is used to classify the junction as especially dangerous in the Before or After situation. The number of accidents will most likely follow a Normal distribution as shown in the figure below. Probability density Probability 95%. Accidents Average number of accidents. It can be shown that if the junction has a normal level of accidents compared to other junctions of the same type, the number of accidents over a period of a number of years should with 95% probability be lower than U95: U95=Un+1,65*√Un Un. is the expected number of accidents that can be calculated from: Un=365*AADT*t*Ufn*106. Ufn. is normal accident rate for this type of junction.. The criteria is that if U>U95, the junction can be classified as especially dangerous. The formula for the U95 is empiric and should not be used for small number of accidents. 6. The results of the study are summarised and evaluated. Please note that in this study the length of the "Before" and "After" Periods are from 1 to 5 years. The study is based on personal injury accident numbers from the police. Public Roads Administration Vestfold, Norway, July 2000. 5.
(40) Experiences with roundabouts in the Vestfold Region. Accidents, traffic behaviour and geometric design.. authorities which are registered according to the internationally accepted definition of a traffic accident.. Methodology for the Accident Risk Analysis The junctions in the Before and After Study have various "After" periods depending on when the roundabout was built. To describe the accident risk situation, an accident risk analysis was carried out of 33 roundabouts for the period 1991 to 1995. The accident risk analysis includes: • The annual accidents for each of the roundabouts. • The accident rate for each junction and the average accident rate for groups of junctions. • Evaluation of the roundabouts to determine if any number can be described as especially dangerous. Methodology for Traffic behaviour studies and study of geometric design The Traffic behaviour study has the benefit of fieldwork assessment. This gives a good impression of the total traffic situation and can supply the accident studies to get a better picture of the different conditions of importance. The roundabouts are all within the city areas and are all described as especially dangerous and therefore not representative of all roundabouts. Behaviour recorded for the study : • Vehicle travel speed chosen to travel into and through the roundabout. • Vehicles giving way to other vehicles and roundabout users. The vehicle travel speed was measured in situations with no queue, and over a distance of 30 metres before and 20 metres through the roundabout and the junction leg with the easiest curve to pass. A minimum of 40 observations was carried out for each junction leg. A recording of vehicles giving way to pedestrians and bicyclists was carried out in junction legs with a minimum number of 100 crossings each day for each roundabout.. The recorded geometric design includes: • The radius for the car lane straight through the roundabout • The radius for the central island. • The location of zebra crossing compared to the give way line • Free sight in the roundabout. Public Roads Administration Vestfold, Norway, July 2000. 6.
(41) Experiences with roundabouts in the Vestfold Region. Accidents, traffic behaviour and geometric design.. These registrations are in accordance with the manuals for geometric design and free sight given by the Public Roads Administration.. RESULTS Before and After Study For the total of 22 junctions the results show a reduction in the number of accidents of 34.5% as a consequence of constructing roundabouts in the period 1991 to 1995 being statistically significant. The construction of roundabouts shows a good effect for this region. The junctions had an average accident risk of 0.25 before changing to roundabouts. After constructing roundabouts the accident risk is reduced to 0.12 being a reduction of 50%. However, the accident risk of 0.12 is more than the double of the normal value for roundabouts in Norway. Before roundabouts were in place, 6% of the accidents in the junctions were fatal or very serious accidents. After the construction of roundabouts, no fatalities or very serious accidents have occurred. There has been a reduction of nearly 50% of crossing drive direction accidents (statistically significant). The material also shows that there has been a reduction of pedestrian related accidents by nearly 70%. Head-to-tail accidents are reduced by over 30% and the accidents where cars crash outside the road has increased with 50%, but none of these results are statistically significant. Accidents including non-motorised road users have led to the increase of bicycle accidents and a decrease in pedestrian accidents (not statistically significant). Accident risk analysis For the entire 33 roundabouts there is an average accident rate of 0.10 in the period from 1991 to 1995 being twice as high as the normal value for Norwegian roundabouts. This pattern does not change when one looks at 3 or 4 legged roundabouts in groups. The seriousness of the accidents are low, and there have been no fatalities or very serious accidents. The distribution of accident types shows that 30% of accidents happen at the entrance of the roundabout, 20% of accidents occur during head-to-tail collision or single accidents, and the number of accidents involving pedestrians are few.. Public Roads Administration Vestfold, Norway, July 2000. 7.
(42) Experiences with roundabouts in the Vestfold Region. Accidents, traffic behaviour and geometric design.. Traffic Behaviour and Geometric Design About 70% of the entrances to the roundabouts have an average speed of 40 km per hour or more. This indicates too little deflection in the curve through the roundabout. Three of the six checked roundabouts are not built in accordance with the manuals for geometric design concerning deflection. Free sight conditions are not satisfied in more than 50% of the controlled junction legs with the main problem being vegetation in the central area. On the average, 20% of vehicles do not give way to other vehicles at the entrance to the roundabout. In some of the entrances over 30% of vehicles do not give way. The share of motorists who do not give way to pedestrians varies between the various pedestrian crossings. For the checked junction legs, 30% of vehicles do not give way at the entrance and 40% do not give way at the exit. In situations of conflict between motorists and pedestrians a total 37 % of the motorists did not give way.. ACTIONS Two levels of actions aimed to improve traffic safety in roundabouts are given: 1. General Actions 2. Special actions for each roundabout General Actions are as follows: • Road safety education to be made more readily available for school students and during driving courses. • The dissemination of information related to correct road behaviour. • Assure that facilities are built in accordance with the manual for geometric design. • Assure that vegetation does not hinder free sight. • Leading lines should be marked from roundabout entrances and through the roundabout area. • Reduce driver distraction by minimal use of advertising and traffic signposting. • Enforce speed reduction campaigns. • Clearly mark pedestrian crossings.. Public Roads Administration Vestfold, Norway, July 2000. 8.
(43) Experiences with roundabouts in the Vestfold Region. Accidents, traffic behaviour and geometric design.. The study suggests special actions for each of the 6 roundabouts in the study of traffic behaviour and geometric design. The main solutions are as follows: • To increase the deflection in accordance with the standards of geometric manuals by enlarging or reshaping the central island. • To reshape the canalisation at roundabout entrances • To line mark leading lines from the entrance and through the roundabout area • To install speed bumps before the pedestrian crossing, forcing for reduced vehicle speed in anticipation of pedestrian movements. • To install rumble strips prior to road junctions. • To reduce the amount of landscaping in the centre of roundabouts with the future use of appropriate vegetation such as lawns and shrubs rather than trees.. CONCLUSION The Before and after study shows a good effect of building roundabouts. After the construction of roundabouts there have been no fatalities or accidents of a very serious nature. The Accident risk analysis shows that the average accident risk for roundabouts in the Vestfold Region is double the normal value for Norway. The severity of the accidents is low with no fatalities nor very serious accidents. Traffic behaviour studies show high speed at the entrance of the roundabouts. On average, 20% of the motorists do not give way at the entrance and a total of 37% of vehicles do not give way to pedestrians. There is poor sight distance and deflection in many roundabouts. Several actions are suggested to improve traffic safety in general and particularly for each of the 6 roundabouts included in the study of Traffic behaviour and geometric design.. FUTURE DIRECTIONS There have been limitations in this paper due to the lack of time to clearly elaborate on specific areas. The goal of this section is to discuss topics that could assist with continuing future research and assessment. The survey could be redone in a few years time in order to have results for the same junctions to make conclusions for a longer After Period. For this thesis it would be interesting to look at topics such as the size of the roundabout, the speed limits and AADT. The bicycle accidents have not been analysed in depth, due to the limitations on time. However it would be worthwhile for future analysis to combine behaviour studies and. Public Roads Administration Vestfold, Norway, July 2000. 9.
(44) Experiences with roundabouts in the Vestfold Region. Accidents, traffic behaviour and geometric design.. the hospital reports of injured cyclists to get a better picture of the real situation facing bicyclists and possible remedies. The in depth accident analysis for each roundabout is a natural consequence of the results shown in this thesis. A standardised way of doing a Before and After Study and also an Accident Risk Study would ensure the possibility of comparing the results from different studies that result in better data for empiric values. The behavioural study can be carried out in both dangerous and safe junctions to determine any different types of behaviour. This could also explain something about the usefulness of the methods used.. Public Roads Administration Vestfold, Norway, July 2000. 10.
(45) Experiences with roundabouts in the Vestfold Region. Accidents, traffic behaviour and geometric design.. REFERENCES Blakstad, Finn Statistics for traffic engineers Norwegian University of Science and technology. 1994 Blakstad, Finn Traffic technology Norwegian University of Science and technology. 1993 Elvik, Rune Traffic safety handbook Institute of Traffic Economics, Norway. 1996 Giæver, Terje Accident rates in roundabouts and signal junctions SINTEF. 1990 Giæver, Terje Risk in junctions SINTEF. 1986 Johannessen, Stein Roundabouts SINTEF. 1985. Public Roads Administration Vestfold, Norway, July 2000. 11.
(46) BETTER SIGNS FOR BETTER ROAD SAFETY. Mr. Adel. AL-Yousifi, Easa H. Al- Yousifi Est., Kuwait Affiliated with: University of Sunderland, UK. International Conference “Traffic Safety on Three Continents” Pretoria - September 20-22, 2000.
(47) 2. Abstract This study investigates the effectiveness of traffic signs, as described in the Vienna Convention, in sending information, warnings, and orders to drivers to create a safe driving environment. This study assumes signage affects the driver’s mind and consequently driving behaviour. Confusing signage therefore increases traffic accidents and traffic disturbances. This paper hypothesizes that: a) Some symbols and signs are ambiguous and not easily understood. b) Some symbols give a meaning different from design intentions. c) Some symbols give more than one meaning. d) Some signs give drivers the impression they are allowed to take actions that are dangerous. The methodology used is based on field research, interviews, and surveys. Traffic signs and their usage were observed, documented, and photographed in 23 countries around the world. Drivers and other interested parties were interviewed. The survey included questions about sixteen traffic signs which need review and reconsideration. The surveys were conducted at random to 6,000 drivers in England, France, Iran, Kuwait, Bahrain, and Ukraine, i.e., 1,000 forms to each country. Then the survey forms were numbered and entered into the computer using SPSS statistical analysis. The results of this basic statistical analysis validate the assumptions, e.g., that perceptions and understandings of some traffic signs are very low (29.07% in the case of (A,7a) sign), and that the ambiguity of such signs can give drivers wrong and dangerous information. This confirms the need to review and change certain signs in the context of the technological, geographical, social, and psychological developments of mankind, and to standardize signage in view of increasing globalization..
(48) 3. Introduction The international community lays great emphasis on traffic safety as it is considered a priority concern, due to the great number of traffic accidents. This interest is shared by government authorities, universities, some public associations, engineering bureau, vehicle manufacturers as well as manufacturers of materials used in road construction. All such parties are engaged in conducting studies, research, and applied experiments in order to find the best solutions for road problems and consequently improve traffic safety. Those who follow such studies and research find that these stress three aspects: - The human element and the factors which influence his driving ability. - Improvement of road engineering and materials used in road construction. - Development of safety devices in vehicles. However, the above-mentioned parties do not give due attention to the importance of traffic signs which provide communication means for transmitting messages and information from traffic departments to drivers. Perhaps such parties presume that the currently used shapes and symbols of traffic signs are adequate designwise, and sufficient to convey accurate and clear messages to drivers, as well as advise them of required actions in order to avoid all types of risks that may exist on roads. In this study, we doubt such presumption and attempt to prove the contrary. This attitude rests on the belief that traffic signs need reconsideration by the international community. The numerous developments in road quality, vehicle design, as well as driver psychology within the last thirty years (since the Vienna Convention was approved), were not matched by any changes in traffic signs to make them conform with such developments. Hence, some signs have lost their significance, while others were found to give more than one meaning or convey messages conflicting with traffic safety rules and regulations. In this paper, certain aspects of the negative impact of some traffic signs as well as proposed rectifying solutions are highlighted However, the main objective of this research paper does not aim at persuading the international community to adopt the proposed solutions, but rather, to convince them that the problem exists. Thereafter, we hope to persuade them to discuss the general system governing traffic signs and introduce improvements thereto. The final step would be to lay down integrated standards for traffic signs which could serve as a worldwide reference. In this pursuit, we should consider not only the developments that affected roads and their users during the past thirty years, since the introduction of Vienna Convention, but also the probable changes that may occur within the next three decades..
(49) 4. Previous Analysis of Signage Understanding Last year at the Malmo (Sweden) conference, discussion centered around three traffic signs covered by Vienna Convention which need to be either reconsidered or cancelled altogether. The first was the “Descent”, warning sign (A, 2a). We have pointed out how most drivers misunderstood 10 % the meaning of this sign particularly in the A, 2a countries where reading and writing are done from right to left. In these countries, many drivers look at the sign from right to left, thus (A, 2a) is understood to be warning of an upcoming ascent, instead of a descent. In order to solve this problem, addition of an arrow within the triangle was proposed and the merits of this suggestion were elaborated. The ratio of those who could recognize the sign without the existence of the percentage in the upper part of the triangle was (45.80%), while those who recognized it with the existence of the percentage amounted to (72.50%). However, when the arrow was added, the ratio increased to (95.00%), which is a good outcome resulting from just adding a simple arrow to the sign (table no.1). Table No. 1 1. 2. 3 % 10. Average % of the right answers in the six countries. 45.80. 72.50. 10. %. 95.00. The second sign was a warning sign indicating narrowness in the lane (A, 4b, R). We have. explained the fact that most traffic departments use this sign to indicate a warning against the termination of one lane of carriageway, and that majority drivers (82.74%) understand this sign to be conveying such message. Then we A, 4b, R proved that the original meaning of the symbol namely to warn against narrowness in lanes, shoulders or the end of shoulders, but not warnings of an end of lane. A new symbol was suggested to indicate warnings against the end of carriageway lanes and in table (2) we see the proposed a new symbol Table No. 2 1. Average % of the six countries. 2. 8.92. 3. 24.10. 42.57. 4. 24.13. 0.28% Gave No Opinion (sign No.3) which was the choice of most drivers, when they were asked which sign gave them clear message of end of a lane. The third and last sign was (A, 7a) which warns against uneven roads, but the majority of drivers (66.20%) understand it to be a warning sign against a A, 7a bump due to resemblance of the shape of the sign’s symbol with a bump. A proposal was made for cancellation of the sign’s symbol from Vienna Convention together with the introduction of a.
(50) 5 substitute symbol having quite a different appearance from a bump shape but giving the desired message indicating uneven road. In table (3) we see the sign with the symbol that was selected by most drivers (Sign no.3) as alternative for the sign’s symbol (A, 7a). This paper introduces two other signs which need to be redesigned or, replaced to improve road traffic safety.. Table No. 3 1. Average % of the six countries. 2. 5.8. 3. 32.5. 47.3. 4. 14.3. 0.10% Gave No Opinion.
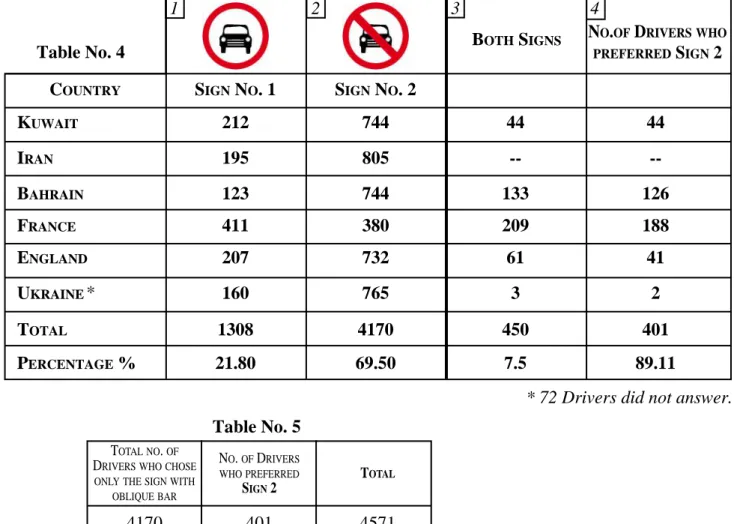
(51) 6. Prohibitory and Restrictive Signs The Vienna Convention lists 30 prohibitory and restrictive traffic signs: “Prohibitory and restrictive signs shall be circular.... unless otherwise specified, where the signs in question are described, prohibitory or restrictive signs shall have a white or yellow background with a wide red border: the symbols and the inscription, if any, shall be black or dark blue and the oblique bars, if any, shall be red and shall slope downwards from left to right.” This definition and the study of the design of actual signs show that prohibitory traffic signs have no uniform specification. The Convention allows a white or yellow background and black or dark blue symbols or writing, yet it does not state when each colour may be used. The Convention also allows the presence or absence of oblique bars. In addition to these differences in design, all prohibitory signs guide drivers of different type of vehicles - and a few guide pedestrians (figure 1). Some signs carry pictorial symbols (figure 2), others are abstract (figure 3), and one sign has no symbol (figure 4). Our main concern here is with the absence (figure 2) of the oblique bar in most of the prohibitory signs, even though the bar’s presence (figure 5) improves drivers’ recognition of the prohibitory signs’ message.. C, 3g Figure 1. C, 3a Figure 2. C, 1a Figure 3 There are several reasons for associating the. oblique bar with the prohibitory message. The major reason is the “no smoking” sign (figure 6), which may be seen in large numbers by everyone daily in schools, government buildings, hospitals, private companies, airports, train stations, etc., in all countries of the world. This sign’s meaning is recognized by nearly everyone, including drivers, even so it is not a traffic sign. Therefore, when drivers see a prohibitory traffic sign without the oblique bar, the sign’s meaning may seen unclear or recognition may take longer.. C, 2 Figure 4. C, 4a Figure 5. Figure 6. We conducted a survey where the sign (C, 3a) that prohibits vehicle entry was displayed in two ways. 1) without the oblique bar, as described in the convention, and 2) with the bar added. Survey participants were asked which sign prohibited vehicle entry (table 4). Almost 70% of the participants chose only the sign with the oblique bar. 450 of the 6,000 survey respondents (7.5% of the total) said both signs meant no entry for vehicles. When asked which sign delivers the stronger impact, 401 of the 450 respondents (89.11%) favoured the sign with the oblique bar. The positive effect of the oblique bar on the sign’s message can be seen clearly, since in Britain and France, where that sign is used without the oblique bar, respondents still chose only the sign with the oblique bar by 73% and 38% respectively. If the numbers in column 4 (table 4) are added to the total number of respondents.
(52) 7 who chose only sign 2 (column 2), these percentage will become 77% and 57% respectively. Accordingly, 76% (table 5) of the total respondents understand or prefer the sign carrying the oblique bar as the one giving the clearer message.. oblique bar mandatory. On page 43 of the amendments, it allowed traffic regulators to omit the oblique bar when “appropriate”. The amendments also gave no reason for adding or omitting the oblique bar. We see it as necessary that the Convention make the oblique bar mandatory based on our survey, which proved that most drivers prefer the oblique bar because it enhances the recognition of the prohibitory signs’ meaning. This can only improve traffic safety. All that has been said above about adding the oblique bar applies only to prohibitory signs and not restrictive signs. The later should remain as they are in Vienna Convention. The addition of the oblique bar to prohibitory signs will divide the two group of signs, and so, help drivers to understand which signs are prohibitory and which are restrictive. The message will be delivered quickly and clearly.. We believe this large percentage applies to all prohibitory signs. Most traffic regulators in the world must have reached this same conclusion because they started adding the oblique bar to prohibitory signs in their countries. This action contravened the sign specifications set in the Convention. As a result, the Convention officials decide to follow this trend-not out of conviction, but rather to keep up with the change. The oblique bar therefore was added to the prohibitory signs in the amendments made to the Convention in 1995. However, the Convention did not make the. 1. 2. 3. Table No. 4 COUNTRY. BOTH SIGNS. 4 NO.OF DRIVERS WHO PREFERRED SIGN 2. SIGN NO. 1. SIGN NO. 2. KUWAIT. 212. 744. 44. 44. IRAN. 195. 805. --. --. BAHRAIN. 123. 744. 133. 126. FRANCE. 411. 380. 209. 188. ENGLAND. 207. 732. 61. 41. UKRAINE *. 160. 765. 3. 2. TOTAL. 1308. 4170. 450. 401. PERCENTAGE %. 21.80. 69.50. 7.5. 89.11. * 72 Drivers did not answer. Table No. 5 TOTAL NO. OF DRIVERS WHO CHOSE. WHO PREFERRED SIGN 2. TOTAL. 4170. 401. 4571. 69.5. 6.68. 76.18. ONLY THE SIGN WITH OBLIQUE BAR. PERCENTAGE %. NO. OF DRIVERS.
(53) 8. Traffic Warning Signs That Protect Children Protecting children against danger is the responsibility of their parents and society. Among life’s dangers to children are traffic accidents. Their parents are responsible for driving safely and obeying traffic rules to set a good example for their children and so provide them with a sound driving education. The community is responsible for enacting traffic laws that protect children in the street and in areas where the are concentrated, such as schools and playgrounds. These laws include provision of adequate lighting at street-crossings, a sufficient number of traffic signals, and signage to regulate children’s streetcrossing and warn drivers of their presence.. response to the warning sign used near playgrounds would expose children at playgrounds to greater danger. Another reason why warning signs for school area and playground area should be different, is children attend school at times that differ from play times and they behave differently when going to and from school than they behave when playing games. We therefore propose creating a separate warning sign for playground areas (figure 8). This symbol is taken from the American sign W14.1 (photo 1).. The Vienna Convention has only one traffic sign, A-12 (figure 7), that specifically protects children. This sign warns drivers of road sections that children frequent, such as streets near school exits and A, 12 playgrounds. Figure 7 Having one sign is not only inadequate for regulating children’s street-crossing, but it may also increase risks because the same sign will be used near schools as well as near playgrounds and other areas. This constitutes wrong usage because the principle of any standard requires it to be clear and have only one meaning to avoid causing confusion. The use of sign A-12 at areas other than near school will endanger children, because our survey has show that most drivers see it as a warning for school street-crossing. Of the drivers we questioned in six countries, 96.65% identified sign A-12 as a school warning sign (table 6). These drivers, at times when schools are closed (late afternoon, holidays, semester breaks, or summer vacation), may believe increasing attention and slowing down are unnecessary because no children should be around. This non-. Photo 1 Another sign needing creation is one to warn of children playing in the street. This would be used in narrow streets, particularly in cities, where no dedicated playground areas exist and where children tend to play in the streets near their homes. Also, vehicles parked on both sides of such streets obscure the sight of children playing.
(54) 9 or crossing the street. The symbol for this sign (figure 9), a child chasing a ball from behind a standing vehicle, is based on a Canadian sign (photo 2).. Figure 8. Photo 2 These symbols are easy to understand. Our survey asked “which of the warning signs (table 6) indicate: 1) a school, 2) children possibly at play, and 3) a playground?”.. Figure 9. Correct responses were high. 92.42% of those surveyed identified figure 9 as a warning that children playing in the street. 90.33% of those surveyed identified E, 11a figure 8 as a warning of a Figure 11 playground area. These percentages prove drivers would easily understand the proposed new signs. We also recommend creating a sign that specifies street-crossings for children near schools 1 area (figure 10). Such a sign would Table No. 6 resemble sign E, 11a SIGN NO. 1 COUNTRY (figure 11) in the KUWAIT 988 Vienna Convention for use at pedestrian IRAN 917 street-crossing places. BAHRAIN 988 This sign would be important not only for FRANCE 985 drivers, but also for ENGLAND 882 children, whose UKRAINE 785 safety would be enhanced by showing TOTAL 5545 them where to cross PERCENTAGE % 92.42 the street.. Figure 10 2. 3. SIGN NO. 2. SIGN NO. 3. 984. 993. 912. 991. 988. 1000. 984. 996. 874. 989. 673. 830. 5420. 5799. 90.33. 96.65.
(55) 10. Summary We conclude that this primary study on the efficiency of traffic signs, as a means of transferring a clear, precise and understandable information and messages from the traffic departments to the drivers, numerous remarks and facts arise which call for attention and concern of Government officials and Researchers in this field. The key facts are: a) The symbols and signs are ambiguous in their meanings and are not easily understood, so they need to be corrected. b) The symbols in the signs which give a different meanings apart from what they have been designed for, should be changed. c) There are some symbols used in signs which are confusing for the drivers, so should be avoided and replaced with new ones. Needless to say these problems in the system of traffic signs as described in Vienna Convention will have effects on driver’s understanding of the changes in road situations which affect driving behaviour and attitudes in a way that will increase the road accident rate. This study aims to reduce this effect by achieving the highest level of accuracy and transparency of messages, and to reach a uniformity of signs, which helps the drivers to respond appropriately to any type of message by establishing a level of familiarity with and prior knowledge of the meaning and use of signs in various situations. Finally, the results of this initial study ascertain the needs for serious and rapid reconsideration and amendments to be done on Vienna convention to match the technical developments and changes in roads, and for the personal and psychological changes in users.. References 1) European Rules concerning Road Traffic signs and signals - European Conference of Ministers of Transport - 1974. 2) European Rules concerning Road Traffic signs and signals - Amendments (1) - 1995. 3) Mac Donald, W. A. and Hoffmann, E.R. Driver’s comprehension of traffic sign Information. The 2nd Informational Pacific conference Nov. 1983 Volume 2, Tokyo, Japan. 4) ITE Traffic Signing Handbook - 1997. 5) Making Traffic Signs Work - An Overview of Design and Testing Procedures D. Donald - Australian RRB - 1995.
(56) Dr. Gregor BARTL Austrian Road Safety Board Ölzeltgasse 3, A-1030 Vienna. Results of EU-Project “DAN” (Measures for Novice Drivers) 11th International Conference “Traffic Safety on three Continents” 20-22 September, 2000 Pretoria, South Africa Novice drivers are involved in road accidents to a great extend. The objective of the EU-Project “DAN” (Description and Analysis of Post Licensing Measures for Novice Drivers) was to elaborate recommendations to solve this problem. The project, focussing on the situation in EU-countries, was partly financially supported by the Commission of the European Unions. In a first step a recent inventory of Post Licensing Measures applied in the EU was established. In a second step a qualitative analysis of advantages and disadvantages of the different measures was elaborated based on results of evaluation studies where available, on opinions of experts participating in an international workshop and on theoretical background. As a result of this project, carried out in 1999 and published early in the year 2000, recommendations were addressed to experts as well as to national and EUpoliticians for possible future implementation of certain measures in order to save lives of novice drivers. The main results of the DAN-analysis are summarised in form of recommendations. 1. An extended supported learning period for novice drivers regardless of age should be implemented on mandatory basis at least stepwise. The disproportionate accident risk of novices indicates that the present driver education in the EU can still be improved. Driver education and the following phases should be harmonised and form a continuum. Post licensing measures should not rely on single components, but they should form a net of elements that supports safe beginning of driver’s career. 2.The measures of the extended supported learning period for novice drivers should be sufficiently differentiated. Novice drivers and their problems are different. Two approaches are required: •. General prevention for all novice drivers: A general preventive multiphase education which also makes use of the intermediate phase including in-car training as well as psychological elements concerning personal attitudes..
(57) •. Individual rehabilitation for violators only: Driver improvement courses in the sense of rehabilitation focussing on personal characteristics and attitudes lead by psychologists or driving teachers. The more precisely the offence is a symptom of a socially problematic character the more rehabilitation courses shall be carried out by psychologists. At least in case of alcohol- or drug-abuse in traffic and repeated other serious traffic violations a psychologist shall be entrusted with the course. (Alcohol- or drug-abuse does not affect all novice drivers and cannot be solved with general preventive measures.) 3. A probation period with demerit point systems and feedback of about two to five years for novice drivers as well as a central index of traffic offenders should be implemented. These are frame conditions to support an optimal execution of the measures of the extended supported learning period and to provide a comprehensive data basis for evaluation. Additionally, it can be assumed that this period “under observation” itself has a general preventive effect. 4. Safe driving courses have to avoid that participants over-estimate their own skills after participation or get a misinterpretation of drivers task only as a task for mastery of vehicle manoeuvring or single emergency situations. Demonstration of risk should be rather emphasised than purely training. Although skidding is attractive to young people the course intention is to develop safety attitudes. Safe strategy should be emphasised: to keep out of dangerous situations rather than to cope with those. 5. Individual feedback is an important element of any post licensing measure. It can also be given in group sessions with maximal 10 participants. Additional driving lessons in real traffic for evaluation of driving skills and styles are a recommendable method to realise an individual approach. 6. A zero-Alcohol limit for novice drivers should be introduced. 7. Specific speed limits for novice drivers or mandatory curfews shall not be applied. Specific speed limits obviously bear additional risk factors. Late-night or weekend curfews shall only be promoted on a voluntary basis. At the same time subsidiary mode of transportation (e.g. “Disco Busses”) have to be organised. 8. Quality assurance systems for post licensing measures have to be implemented. A standardised quality system assures a regulated conduction of post licensing measures and a transparency for the client, who is not able to judge whether a measure is appropriate or not. And it is the basis for further development of the measure. A quality assurance system must also include periodical further education and supervision of the staff..
(58) ROAD SAFETY IN GREECE Maria Sakki, Civil & Traffic Engineer Head of Road Safety Equipment Division Road Maintenance Directorate, Gen.Secretariat of Public Works Ministry of Environment, Planning & Public Works ( E.P.& P.W ) July 2000 1. Background Data Greece has an area of 131.957 sq.km and a population of 10.264.156 inhabitants ( last census in 1991), of which approximately 1/3 lives in the greater Athens Area ( FIG.1, FIG.2 ). The country has a dense road network - its length covers 115.000 km - , split in three categories as follows : 10.000 km of National Roads ( of which approx. 500 km are Motorways ) 30.000 km of Departmental Roads and 75.000 km of Municipal and Local Roads There are about 4 million motorvehicles in Greece. On 31.12.1996 there were: - 2.349.099 passenger cars - 910.557 trucks - 518.500 motorcycles over 50 c.c. - 25.120 buses and, - more than 1.500.000 mopeds , used widely especially in the Athens area, because of the car circulation restrictions during the working days of the week. In 1998 , a total of 24.862 road accidents occurred in Greece , in which 2.195 persons were instantly killed and 33.450 were injured ( 4.831 very seriously ). These are the usual accident rates almost every year. As in most countries, road accidents are registered by the Statistic Service of the Traffic Police ( only where human damages- deaths and injuries- are involved ) . Road Accidents are also registered by the Statistic Service of the Insurance Companies Union which also includes material damages. The total distance travelled in Greece has not been calculated since many years, but it is based on rough estimates. It may be noticed that this value ( vehicles x Km ), estimated in a FERSI / ETSC Report for 1998 without taking into account the number of mopeds ( which are very much involved in the correlated number of road accidents ) presented a higher accident rate for Greece. Unfortunately the absolute values of annual accidents and victims are increasing in Greece (FIG.3), however much less than the annual increase of the number of vehicles , which is among the highest in Europe (FIG.4).So, there is a constant decrease of accidents rates per 1000 motor vehicles(FIG5) 2. History: road safety situation , policies, plans and programmes The first road safety measures after the 2nd World War were practically taken in Greece by the Highway Circulation Code published in 1959 ( which became a law in 1962), as well as by the establishment of the new traffic signalling and signing system in Athens . After the Vienna (1968) and Geneva ( 1971&1973) Conventions for the Road Signalization and Circulation signed also by Greece, the above mentioned Code was replaced by a new law in 1977. 1.
(59) The Code was the base for the road safety in Greece for many years, but road accidents continued to increase, especially during the days with traffic peaks ( holidays,long week-ends etc). As in most countries, the authorities blamed road users as responsible for the 90% of the accidents, due mainly to their high speeding, wrong behaviour, abstraction etc. and the recommended remedy has almost always been the strict «punishment» of the driver! Still it is considered that the main responsibility for the road accidents belongs to the drivers. The first scientific analysis of the road accident problem was elaborated by the Ministry of E.P. & P.W. in the early 80’s. The product of this analysis was the determination of black spots on the national road network and the proposed short term interventions, realised in the frame of the Road Maintenance Programmes (1985 ). In general, there were no special safety budgets.. In 1986 , the Year of Road Safety, Greece participated actively in the campaign initiated by the European Commission . The results of the above mentioned actions became evident in the relevant diagrams, showing the decrease of road accidents in the years that followed ( 1987, 1988). Unfortunately, this systematic policy for the national road infrastructure initiated by the Ministry of E.P. & P.W did not find imitators among the partners and Authorities responsible for the rest of the road networks (regional and local ones), as well as the other accidents’ factors ( drivers, pedestrians, vehicles , enforcement procedures etc. ) Therefore, no systematic road safety policy was carried out in the late 80s and in the early 90s. The main co-ordination among the authorities and “third parties” competent for the road safety responsible in Greece, was achieved during the elaboration of the new code of 1992 and during the interministerial meetings aiming at the measures to be taken for the prevention of road accidents during holidays, when traffic flows are very high. 3. Today: characteristics of road safety policy in the mid 90s The main objective of the Ministry of Environment, Planning & Public Works (E.P & P.W. ) for reducing the road accidents in Greece is the transformation of the important road axes with high traffic flows into Motorways (approx. 3000 km of highways, FIG.6).The Annual Maintenace Programmes of the Ministry ( about 1 million EUROs) include also the low cost interventions on the national road network. Only in some cases there are special safety budgets available.The regional bodies are responsible for the rest of the road network. Besides the above mentioned objectives, there has been a number of other actions, less costly but more dedicated to the Road Safety. In 1994, with the initiative of the Ministry of E.P & P.W. , THE WHITE BOOK on Road Safety was published by an appropriate committee of experts. At the same time the Technical Chamber of Greece (T.E.E.) financed a similar Study on Road Safety and the 1st Congress of Road Safety was held in Greece , co-organised by the Aristotelian University of Thessaloniki ( A. U. TH ) and the Ministry of E.P. & P.W These actions were the preliminary steps of another more important and mature action, which was the establishment of a parliamentary committee, reinforced with experts of the Administration, Universities and non profit “ third parties”. The product of the above mentioned committee’s work was the report in depth on Road Safety with conclusions and concrete proposals, which were adopted by the Greek Parliament, for the first time in the road safety’s history. The 2nd Road Safety Congress was held in Greece last year and a new Traffic Code has just been published, replacing the old one of 1992.. 2.
(60) During the last 5 years of the struggle against road accidents increase, the following were achieved: • Better co-ordination among the authorities and bodies involved and responsible for the road safety factors . ( It is worth mentioning the organisations involved, which are : The Ministries of Transport, of E.P.& P.W., of Public Order, of Interior, of Justice, The Regional and Local Authorities, Mass Media, Universities and Researchers, Technical Associations as well as The Automobile, Insurance and Medical Sectors ) • The foundation by law of a National Interministerial Council for Road Safety • The establishment of a new Road Safety Bureau within the Ministry E.P.& P.W. , having as objectives the elaboration of the road accident data and the determination of the black spots in order to ensure the continuous improvement of the national roads ( There remains a lack of similar actions on the other levels, responsible for the departmental and municipal roads ) • The development of the Police Statistics and the connection with the European Data Base C.A.R.E • Better awareness of the citizens on the road accidents’ problem • Better information by the Mass Media . • Introduction of the road safety items in education of children and young people • Greater interest by the Authorities ( central, regional and local ones ), especially by the Government and the Parliament, towards an effective road safety policy . • Stronger enforcement and control carried out by the Traffic Police • Better publicity and campaigns on Road Safety by the parties involved • Major improvement of the national road infrastructure 4. Future : further development The basic steps have been taken and the foundations have been set for a more effective policy towards decreasing of the road accidents in Greece. However, the problem is still very much present and there is a strong need for more cost effective measures, taken not only by the central authorities but also by all interested parties on every level. The persons and experts involved should be as many as possible, dedicated to this aim and engaged voluntarily in the road safety operations. The creation of Working Groups of private initiative interested in road safety, gives many hopes that the minimization –if not the elimination – of the road accidents, will be achieved finally in the near future.. Greek Publications consulted : Studies on road accident analysis and improvement of road safety (1985) Highway Codes of Circulation ( 1977, 1992,1999), Greece The White Book on Road Safety, Ministry of E.P.&P.W. (1994) Parliamentary Committee Report and Proposals ( 1996 ) The National Statistic Service publications, Greece The National Technical University of Athens ( 1999 ) and the Hellenic Institute of Transportation Engineers ( 1998 ) Researches on Road Safety. The Insurance Companies Publication on Road Accident Data ( 1998 ) The Proceedings of the 1st and 2nd Congress on Road Safety in Greece( 1994 & 1998 ). Maria SAKKI, Traffic Engineer, Ministry of Public Works of GREECE, Eressou 52, 106 81 Athens Greece ( Tel.: +301/ 6430612 or / 3807341Fax: +301 / 6434128 or / 3824540 ) e-mail: jamasak@otenet.gr 3.
(61) 4.
(62) 5.
(63) 6.
(64) 7.
(65) 8.
Figure


+7


Related documents
För att man lättare skall kunna överskåda problemets olika sidor, har jäm förelsen grundats på kapitalvärdet år 1930 (nuvarande värdet). En beläggning, som
The National Road Administration currently measures speeds on the Swedish road network in order to monitor speed trends, but there is uncertainty about how its measuring
The electricity production is calculated for the two heat market scenarios giving the highest and lowest electricity consumption: SD-LSEL (slow development and a large share of
The Swedish National Council for Crime Prevention (2019) explains that there is a need to enhance knowledge among crime prevention stakeholders and highlight that both
Till värdet med Sundelis bok hör vidare att han vinnlagt sig om att inte endast redovisa pla- ner utan också de faktiska utfallen och att han valt
I Sverige upplever den sjuke maktlöshet inför de stora sjukhuskomplexen, föräld- rarna inför det stora barnomsorgskom- plexet, eleverna inför det stora skolkom- plexet och
Samhället bör inte garantera existensminimum för den som använder sina barn som förevändning för att slippa jobbet,. Man måste vilja arbeta för att få stöd av
An empirical investigation of international research relating to special educational needs is reported. Two international arenas were identified: a North American and a
