I Akademin för Innovation, Design och Teknik
HOW A MANUFACTURING
ORGANISATION EVALUATE
EFFECTIVNESS OF PERFORMANCE
MEASURES;
A Case study in cooperation with Volvo
Construction Equipment in Eskilstuna
Master Thesis Work, Innovation, production and
logistics
Advanced Level, 30 hp
Master of Science in Engineering Product- and Process DevelopmentMathias Agocs
Report Nr:
Supervisor (Company): Dr. Mohammed Salloum Supervisor (University): Dr. Mohammed Salloum Examinator: Prof. Sabah Audo
II
ABSTRACT
The purpose of this thesis is to point out how a company can gain a better process by using PM in an effective way. The report concludes that the existence in practice of theoretically important aspects are different, also that the most correct way of leading the aspects are through the creation of a PM process.
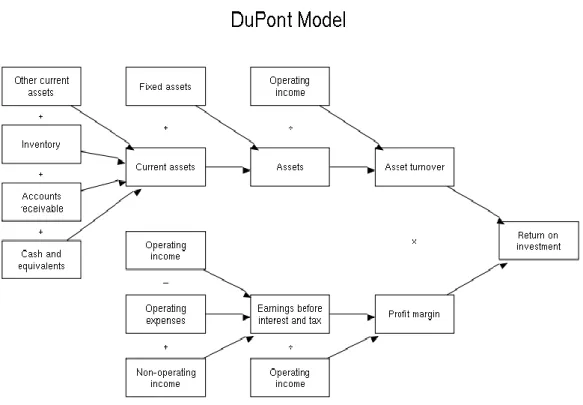
During this thesis work the benefits with performance measurements have been analyzed. Since the genesis of the industrialisation there have been growing needs to identify ways of understanding how a company functions. One of the main events historically leading to the broad adoption of PM was the introduction of the DuPont model. The DuPont model developed by DuPont and General Motors during the beginning of the 20th century quickly became the industry standard in the US for financial analysis. The Dupont model gave PM a central role in evaluating the performance of a company.
Companies are today driven towards a higher level of responsiveness and flexibility in order to remain competitive. In order to measure the advancement towards these objectives, an increasingly complex set of activities collection of PM to monitor performance satisfactorily. Often however, PM are still developed around traditional, functional metrics focusing on departmental issues, rather than on the whole value stream.
There has also been analyzed how a manufacturing company can use PM in an effective way. Under this thesis it emerged that the most crucial factor affecting the companies PM was that it was hard to understand how to use it correctly. When a company use it correctly it determines where the company stands, if they want to be competitive in the future and a method to maintain a good value stream flow. The economical factors for the company are at least important because all decisions always include costly investments. At the same time a company’s PM must be as efficient as possible and generate a good investment. Also other factors have been presented in this thesis but do not affect the effectiveness of the PM. The most important factors found to a more effective PM were; does the PM fulfil its purpose, is the performance attained, to make the purpose explicit and at last boost the education around the subject.
The whole research has been carried out over a twenty-week period, during that period data collection has been performed via case studies. The rest of the data collection has been collected through a literature review by examining relevant data to answer the two research questions.
This thesis have led to a better understanding regarding how to use PM and the benefits of it. This are based on the collected data from the case studies and from the theoretical findings, the empirical data were analyzed in a way that the company understood what was wrong with today´s PM.
III
Keyword: performance measurements, lean, production, balance sheet, kpi, value
stream flow, process, performance, strategy, continuous improvements.
IV
SAMMANFATTNING
Syftet med den här uppsatsen är att peka på hur ett företag kan få en bättre process med hjälp av att använda PM på ett effektivt sätt . I rapporten dras slutsatsen att förekomsten i praktiken av teoretiskt viktiga aspekter är olika, även att det mest korrekta sättet att leda de aspekterna är genom skapandet av en PM process. Under detta examensarbete har fördelarna med PM analyserats. Sedan uppkomsten av industrialiseringen har det vuxit behov att identifiera ett sätt att förstå hur ett företag fungerar . En av de viktigaste händelserna historiskt leder till en bred användning av PM var införandet av DuPont modellen . DuPont -modellen som utvecklats av DuPont och General Motors under början av 20-talet blev snabbt branschstandard i USA för finansiell analys . The Dupont -modellen gav PM en central roll i att utvärdera prestanda hos ett företag. Företagen i dag drivs mot en högre grad av flexibilitet och lyhördhet för att förbli konkurrenskraftiga på marknaden. För att mäta framsteg mot dessa mål behövs, en alltmer komplex uppsättning aktiviteter insamling av PM för att övervaka att prestandan är tillfredsställande. Ofta fungerar det så att PM fortfarande utvecklas kring traditionella, funktionella mått som fokuserar på avdelningens frågor och fokus, snarare än på hela värdeflödet .
Det har också analyserat hur ett tillverkande företag kan använda PM på ett effektivt sätt . Enligt denna avhandling framkom det att den mest avgörande faktorn som påverkar företagens PM var att det var svårt att förstå hur man använder den på rätt sätt . När ett företag använder det på rätt sätt avgör det ofta var företaget står, om de vill vara konkurrenskraftiga i framtiden och en metod för att upprätthålla ett bra värdeflöde. De ekonomiska faktorerna för bolaget är viktigt eftersom alla beslut alltid inkluderar kostsamma investeringar . Samtidigt måste ett företags PM vara så effektiv som möjligt och generera en god investering. Även andra faktorer har presenterats i denna avhandling, men påverkar inte effektiviteten i PM .
De viktigaste faktorerna som uppkom för strävan att få ett effektivare PM var följande; tänker PM uppfylla sitt syfte, är resultatet uppnått, att syftet är fastställt och till sist öka utbildningen kring ämnet .
Hela forskningen har genomförts under en tjugo-veckors period, under denna period har datainsamlingen utförts via fallstudier. Resten av datainsamlingen har samlats in genom en litteraturstudie där man undersökte relevant information för att besvara de två forskningsfrågorna .
Denna avhandling har lett till en bättre förståelse om hur man använder PM och fördelarna med det . Detta bygger på insamlade data från fallstudierna och från de teoretiska resultaten, även att empirisk data analyserats på ett sådant sätt att företaget fick en bättre förståelse vad som var fel med dagens PM.
V
Nyckelord: mätdata, lean, produktion, balansräkning, KPI, värde flöde, process,
VI
PREFACE
The author of this thesis work would like to thank Volvo Construction Equipment in Eskilstuna, the company that gave the possibility for this thesis work. It also gave the opportunity to get a greater knowledge concerning manufacturing industry and the better understanding of the whole process line. The subject was very exciting because in these times of hard competitions on the world market, it´s important for a big company to have a good performance measurements in the company’s operations.
The author would further like to give a special thank to Dr. Mohammed Salloum the supervisor on the company, for all the help with the valuable knowledge and his expertise in the area of performance measurements. In addition to Prof. Sabah Audo the examiner and all the other persons involved providing with important information that helped out to finish this thesis.
VII
TABLE OF CONTENTS
1 INTRODUCTION ... IX
1.1 Background ... 1
1.2 Research problem and purpose ... 3
1.3 Research questions ... 3
1.4 Research limitations ... 3
1.5 Outline of thesis ... 4
2 RESEARCH METHOLOGY ... 5
2.1 Scientific approach ... 5
2.2 Qualitative versus quantitative research ... 6
2.3 Data collection ... 7
2.3.1 The literature study ... 7
2.3.2 Observations and documentation ... 8
2.3.3 Interviews ... 8
2.4 Data analysis ... Fel! Bokmärket är inte definierat. 2.5 Validity and reliability ... 10
3 THEORATICAL FRAMEWORK ... 12
3.1 Definitions ... 12
3.2 The development of the field ... 13
3.3 The balanced scorecard ... 14
3.4 Lean production and the impact on performance measures ... 16
3.5 How to evaluate the effectiveness of a PMS ... 18
3.6 Descriptions of terms within the area ... 21
3.7 Reflection ... 24 4. EMPIRICAL FINDINGS ... 25 4.1 Case company ... 25 4.2 The PMS ... 27 4.3 PM management ... 28 4.4 PM effectiveness evaluation ... 30 4.4.1 Structural aspect ... 30 4.4.2 Behavioural aspect ... 32
VIII
4.5 Summary ... 34
5. DISCUSSION ... 35
5.1 Volvo production system ... 35
5.2 SEQDCH and the balanced scorecard ... 36
5.3 PM Management ... 37
5.4 How the PM effectiveness is evaluated at Operations Eskilstuna ... 40
5.5 The improvement potentials of the PM effectiveness evaluation ... 41
5.6 The PM effectiveness recommendations ... 42
5.7 A potential way forward for the case company ... 44
6. CONCLUSIONS AND CONTRIBUTIONS ... 45
6.1 Concluding the thesis ... 45
6.2 Contributions and future research ... 46
REFERENCES ... 47
APPENDIXES ... 51
APPENDIX 1 - Case study, interview questions ... 52
IX
ABBREVIATIONS
Balance sheet - It can be explained as a summary of the financial balances of a company (Salloum, 2013).
KPI - Key performance indicator, a variety of performance
measurements.
Lead-time - It is the time between the beginning and execution of a process (Liker, 2009).
Mass production - It is production of large amounts of standardized products (Liker, 2009).
PM - Are a short term for Performance Measurements. It is a
tool for evaluating performance in a company (Salloum, 2013).
SWOT - Strength, weakness, opportunity and threats. Used as a
method to analyze the market.
TPS - Toyota production system, it consists of 14 fourteen
principles for an organizational improvement (Womack et al., 1990).
VSP - Value stream mapping, it is a method for analyze the
flow of material and information required to bring the product/service to the customer (Liker, 2009).
White-collar - A person that often work in an office with administrated tasks and no manual labor.
1
INTRODUCTION
In this chapter the reader will get a better understanding of the project and the framework in which it was carried out. The chapter contains a description of the background for this project and also the aim, the chosen research questions. The limitations were also set for the project and at the end of the introduction there is a short outline of the thesis.
1.1 Background
Since the genesis of the industrialisation there have been growing needs to identify ways of understanding how a company functions. One of the main events historically leading to the broad adoption of PM was the introduction of the DuPont model (Tangen, 2004). The DuPont model developed by DuPont and General Motors during the beginning of the 20th century quickly became the industry standard in the US for financial analysis (Neely, 1999). The DuPont model purposes to analyse the profitability of a company through combining components of the income statement and the balance sheet (Salloum, 2013). Due to the penetrating power that the model had when it was introduced the financial measures that it was consisted of became were widely adopted (Neely and Bourne, 2000). The Dupont model gave PM a central role in evaluating the performance of a company. By 1910 the Dupont company had almost all of the basic methods for managing big businesses in place (Chandler, 1962).
However, the widely adopted PM due to the success of the DuPont model became challenged in the 1970s as the unquestioned position of the American management style was pressured by stiff competition from Japan (Radnor and Barnes, 2007).Consumers realised that foreign goods (mostly Japanese) were of better quality, variety and competitively priced. Western companies were forced to scrutinize their ways of working and realised that the increased complexity of organisations and markets entailed by globalisation made solely financial PM as performance indicators obsolete (Salloum, 2013). The widely adopted financial measures that realised strong penetrating power after the DuPont model was introduced had hardly been modified since the beginning of the 20th century (Neely and Bourne, 2000). The most distinct difference between Western and Japanese companies was that the former solely focused on efficiency while the latter focused on both efficiency and effectiveness. In order to recapture the cutting edge, western companies re-evaluated their priorities from solely cost to delivery precision, lead time, built-in quality and flexibility (Ghalayini and Noble, 1996). The trend of integrating several different aspects into PM was also fuelled by increased competition that firms face on a global basis (Rolstadås, 1998).
2
Further, from an operations management perspective, the widespread acceptance of lean production (Womack et al., 1990) has driven the search for increased efficiency and effectiveness of operations (Monden 1981). This was a major development within the field of performance measurement and set the scene for an explosion of concepts, frameworks and models that focused on measuring in a balanced manner (Salloum, 2013). Neely (1999) argues that today the idea of a balanced scorecard (Kaplan and Norton, 1992) seems to have been added to the general management vocabulary.
Despite the shift in mentality and philosophy regarding the need for a balanced approach of measuring performance research indicates that companies fail to adopt non-financial PM even though they claim to use balanced scorecards (Gosselin, 2005; Debusk and Crabtree, 2006; Banker et al., 2010). Thus, despite the advocating of diversification the PM often seem to be still focusing on discrete elements of an organisation, monitoring isolated numbers. At the same time, PM become more and more important and are used to manage the organisation rather than just controlling (Slack et al., 2004; Spitzer, 2007).
3
1.2 Research problem and purpose
Companies are today driven towards a higher level of responsiveness and flexibility in order to remain competitive. In order to measure the advancement towards these objectives, an increasingly complex set of activities collection of PM to monitor performance satisfactorily. Often however, PM are still developed around traditional, functional metrics focusing on departmental issues, rather than on the whole value stream. As a consequence, the alignment of PM is not known and many organisations struggle also with too many PM in place. A considerable portion of these PM are in turn obsolete and not consistent (Keegan et al., 1989). Moreover, the contemporary research regarding the effectiveness of PM is limited (Bititci et al., 2005). With this introduction and research problem in mind, the purpose of this research is to contribute to the existing body of knowledge regarding the effectiveness of performance measures within a manufacturing setting. The research will be concluded through a set of recommendations regarding how to ensure that the deployed PM are effective.
1.3 Research questions
In order to fulfil the purpose two research questions have been formulated:
RQ1 – How is the effectiveness of PM evaluated in practice?
RQ2 – What are the improvement potentials of the PM effectiveness evaluation?
1.4 Research limitations
The research presented in this thesis is limited from several aspects. Firstly, the empirical data is collected through a single case study. Thus, the ability to generalise from the findings are limited (Yin, 1994). The case study has been conducted at Volvo Construction Equipment (Operations Eskilstuna). Thus, the findings presented in this thesis are limited to a manufacturing setting. The Operations Eskilstuna plant employs around 600 employees. Further, as the case study was executed within a short time-frame, the scope has been decided upon between the company, supervisor and researcher. This is a limitation as a longer time-frame and more resources would have provided a more in-depth study at the case company.
4
1.5 Outline of thesis
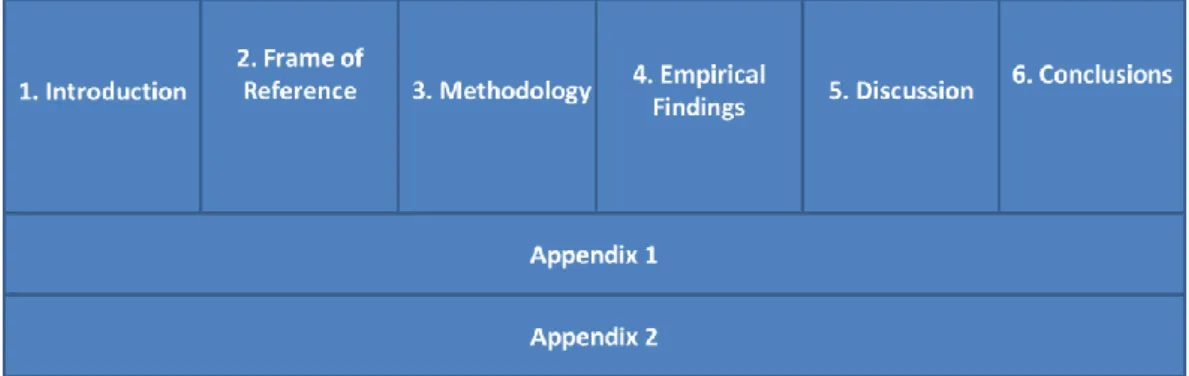
This thesis consists of six chapters, Figure 1.1 illustrates how the chapters relate to one another.
Figur 1.1: Outline of thesis
This chapter has justified the chosen subject by presenting an introduction, research problem and purpose, research questions and delimitations. Chapter two will present the theoretical development within the field of performance measurement and how PM effectiveness ought to be evaluated from a theoretical perspective. The third chapter will present the methodological considerations and how the research has been conducted. Chapter four will introduce the empirical data. Chapter five discusses the empirical and theoretical findings and presents the recommendations. Finally, chapter six discusses the research contribution and concludes the thesis. Appendix 1 supports the thesis by providing the interview template deployed in the case study. Appendix 2 provides a more extensive company presentation.
5
2 RESEARCH METHOLOGY
The second chapter describes the research methods that are used throughout the project and it also describe how the different research methods was performed in this thesis. The method chapter purposes to outline how the research has been conducted. The initiating point is to present the adopted view of science. The way the research has been performed, the chosen data collection and analysis strategies are then introduced in order to amplify the understanding of how the research has been conducted. The method chapter is then concluded by a discussion of the research quality.
2.1 Scientific approach
This thesis has adopted a qualitative approach to science. Qualitative research produces descriptive data through spoken and written words and observable behaviour (Taylor and Bogden, 1998). The strength of this type of research is that it puts forward the detailed reality of everyday life viewed through a different analytical lens (Silverman, 2002). Furthermore, the data presented within the frame of this thesis has been collected through a case study. A case study, unlike a conventional statistical analysis, allows proximity to the examination object rather than the spacer (Merriam, 1994). Further, case studies ensure that rich empirical data is generated (Voss et al., 2002). Furthermore, deploying case studies gives the advantage of investigating a contemporary phenomenon within its real-time context (Yin, 1994).
It is of utmost importance that performance measurement research is conducted within its real-time context. As argued by Salloum (2013), due to the high level of contingency surrounding PM in practice (Bauer et al., 2004), the context that the PM exist within a plays a distinguished role in shaping the PM. Thus, it was believed that deploying an empirical data collection strategy that could not potentially provide rich data and capture the context of the phenomenon would have been a futile exercise. For instance, a PM itself delivers little value until the data generated is analysed and acted upon (Neely, 2007). Further, without a systematic review mechanism, PM will lose relevance as context and opportunities change (Gregory, 1993). Thus, the value and relevance of the PM within a PMS is dependent on the functionality and interaction of other components within the same system. Moreover, the array of factors that affect the functionality and applicability of a PMS is extensive and ranges from structural to behavioural (Franco and Bourne, 2003; Waal, 2003). For instance, the content of an isolated PM can be studied from a deterministic and explanatory point of view. At the same time, a PMS works in an open management system, strongly influenced by its temporal, cultural and social context. Its final applicability and functionality can depend upon a number of non-analytic factors not considered from a deterministic and objective point of view.
6
2.2 Qualitative versus quantitative research
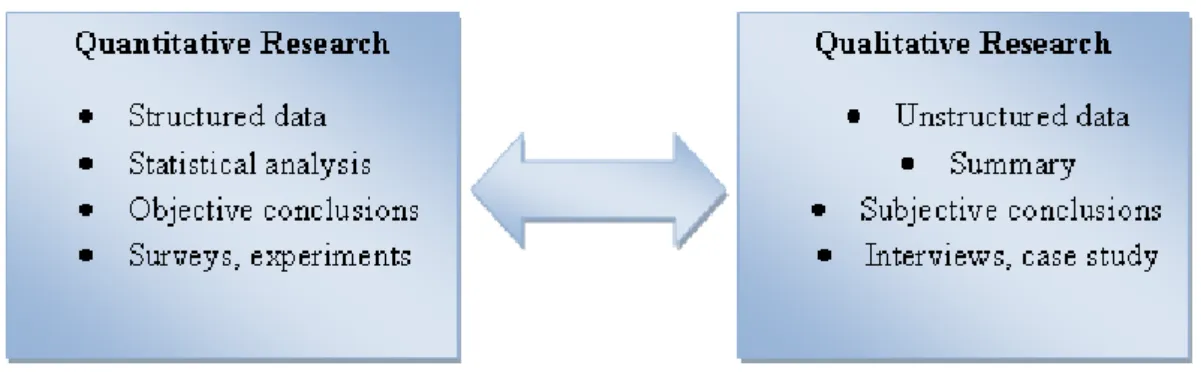
The choice of method should be based on the type of data and research that is to be conducted, thus based on the need that is to be satisfied. There are two different methodological approaches in research methodology, the quantitative and the qualitative methods. It is important to understand the difference between these two methods and when they ought to be applied. One can say that the qualitative method mainly has a purpose to understand the significance of a particular event or experience. Researchers who work with qualitative methods are more interested in the process than the result or product (Silverman, 2002). In contrast, a quantitative research method is more result focused and picks apart an event into little sections that are sub-sequentially analysed in small portions (Merriam, 1994).
The perception of information as concept differs depending on the chosen methodological approach. In qualitative research, information or data, is collected through written and spoken words and observations. The information discussed is qualitative information that describes in detail a variety of situations, people, interactions and events that have been cited by people and their experiences and thoughts. Although various writings and excerpts from letters, minutes and records describing qualitative information. It is the empirical reality depicted and descriptions form the basis of the information going into depth and illustrates in detail. In contrast, the information or data collected within a quantitative approach is numerical. As quantitative data is dominated by numbers, greater emphasis is placed on measuring various events or behaviours. The data that can effectively be generated through quantitative data collection is how much, how many and how it should be distributed (Merriam, 1994).
It has been underlined in the previous section that the research presented in this thesis has taken a qualitative approach.
7
2.3 Data collection
As made evident earlier, a qualitative case-study based approach has been used in this thesis. A case study can be divided into three techniques, direct observations, collection of documentation and systematic interviews (Yin, 1994). This gives the case-study method and advantage as it can handle many different kinds of empirical material such as interviews, documents, and contemporary observations (Merriam, 1994). The data collection in this thesis is ought to be perceived in two steps. The first step was constituted of a literature study, thus the theoretical data collection. The second step consisted of the case study, thus the empirical data collection. The empirical data collection was based on three components; direct observations, interviews and documentation. In the sections below each step is presented more thoroughly.
2.3.1 The literature study
According to Merriam (1994), research need to take into account the previous work done in that specific field of research. Furthermore, Yin (1994) argues, that literature is central for developing sharper and more profound research questions. Moreover, the theoretical data collection serves as a first guide to the design of the case study (Eisenhardt, 1989). According to Neely (2005), the top-cited researchers within the field of PM are from different academic disciplines: accounting (Kaplan), management (Neely), operations research (Banker) and mathematics (Charnes). When performing a literature study within a research field with such dissemination the need for a systematic approach becomes even more important. Further, when conducting a literature study, it is important that the researcher is relatively familiar with the subject area and have a somewhat clear understanding of the research objective. Thus, the first step was to amplify the understanding of the research objective and goal. After gaining familiarity with the subject area, the literature study was initiated by searching through dissertation, academic databases and books.
The first step of the literature study was to search through the dissertation of Tangen (2005) and Salloum (2013) for appropriate literature. The choice of these two dissertations is justified by the fact that the research objectives and goals are aligned and relevant to this thesis. The second step was to expand the literature study to databases and journals. The choice of journals was based on the reviews conducted by Marr and Schiuma (2003) and Taticchi et al. (2012). This search was conducted through keyword search. The databases and journals included in the search are:
8
Proquest
Emerald Insight
International Journal of Operations and Production Management Production Planning and Control
Measuring Business Excellence
International Journal of Productivity and Performance Management International Journal of Production Economics
Harvard Business Review
The final step was then to expand the literature search to books and other reference material. After the information was gathered, the researcher determined the important and accuracy of the theoretical sources (Merriam, 1994). This was done through citing-analysis done by other researchers within the field (Neely, 2005; Marr and Schuma, 2003; Taticchi et al., 2012), through own analysis and discussions with the supervisor.
2.3.2 Observations and documentation
Direct observations have been an important as a source of data. What distinguishes an observation from an interview is the direct experience in the field as opposed to an interview, which is a second hand account of something (Merriam, 1994). The very purpose of the observation is to record everything takes place within a time interval that is determined in advance for the selected object being observed (Yin, 1994). In total, observations were made at nine occurrences: (3) factory tours, (2) PM meetings, (3) reporting meetings and (1) production department meetings. The data obtained during these observations was written words and company documentation. Further, documentation was collected throughout the case study. The collected documentation took the shape of system manuals, process manuals, PM data sheets and PM scoresheets.
2.3.3 Interviews
When doing qualitative research, one of the main methods of data collection is interviews as they create a deeper understanding of the subject being studied (Yin, 1994; Silverman, 2002). Facts, opinions, experiences and desires are derived by the interviews. There are different types of interviews, interviews range from well-prepared questions and follow-up questions to unstructured questions which have not been decided in advance (Lantz, 1993). The interview form applied in this thesis is semi-structured. The semi-structured interview form is partially structured interview with the issues affecting the area and which are predetermined (Lantz, 1993). Thus, interview questions had been prepared in a chronological order but space was given for the researcher to deviate from the interview template based on the interviewee responses and intuition.
9
Interviews are a method to collect data and even this method has its positive aspects and its negative sides. The trick is to remove the negative during an interview phase and reinforce the benefits that one will get the right information. In order to capitalise on the benefits and mitigate the negatives several precautions were taken. In line with what is argued by Taylor and Bodgen (1998), when introducing the interview it was formulated vaguely (but frankly). Further, as recommended by Lantz (1993), the interviews started with presenting the research area, the researcher, the use of the research, confidentiality and ethical considerations. All interviews were recorded and the interview questions are described in Appendix 1. In total, ten interviews were conducted (Figure 2.1). All the interviews were recorded in order to increase the preciseness of the data analysis.
10
2.4 Data Analysus
After the data collection phase the data analysis phase was started. Empirical and theoretical data was analysed at the same time in order to ensure that the research results would have industrial and theoretical credibility. The findings were clustered into themes and categories as argued by Merriam (1994). After the clustering, the themes and categories were conceptualised in order to identify trends. The data analysis phase was visualised throughout the process in order to allow the researcher to further identify trends in the data.
2.5 Validity and reliability
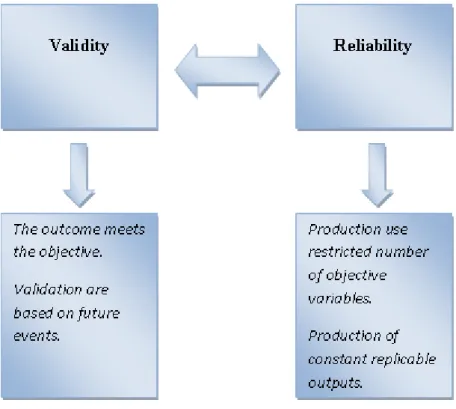
Researchers want to be able to provide data and knowledge that is credible and reliable. When doing qualitative research, it is important to use specific criteria when assessing research. Validity and reliability are two central components of research quality (Yin, 1994).
Validity is concerned with ensuring that the research has been able to focus on what was initially intended (Yin, 1994; Arbnor and Bjerke, 1994). Thus, validity focuses on the precision of the deployed data collection components. Moreover, validity is considered to be high when the measurements are within the scope of the subject area and follow the research problem that forms the basis of the research. In order to establish validity and confidence in the presented research, triangulation between data sources have been done recurrently. Also, in the findings and discussion chapters a chain of evidence has been visualised. The researcher has also appended the research questions in order to further increase the validity. Finally, the research results have been presented to the case company. Reliability can be viewed as the ability to do a test in several ways (Arbnor and Bjerke, 1994). Also, reliability can be perceived as to what extent the research output can be repeated (Merriam, 1994). The conducted case study has been documented from the planning to the closing phase (including the data analysis phase). A file was created on the researcher´s computer for the case study and all documentation was saved there. In order to increase the reliability, the interview template has been appended (Appendix 1). These precautions are aligned to what is emphasised by Yin (1994).
11
12
3 THEORATICAL FRAMEWORK
In this chapter, readers will gain insight into the field of PM and get an
understanding of the results obtained during the work. In essence, the chapter will focus on the areas of PM and lean production because they are fundamental to the focus area of this thesis. The chapter starts will a description of the
development of the PM Field. Then, the most cited and implemented PM framework is introduced, the balanced scorecard. The third part of the thesis introduces and highlights the impact of lean production on the design and use of measures. Then, the tools and frameworks for the effectiveness evaluation of PM are presented. Finally, a reflection sums up the chapter.
3.1 Definitions
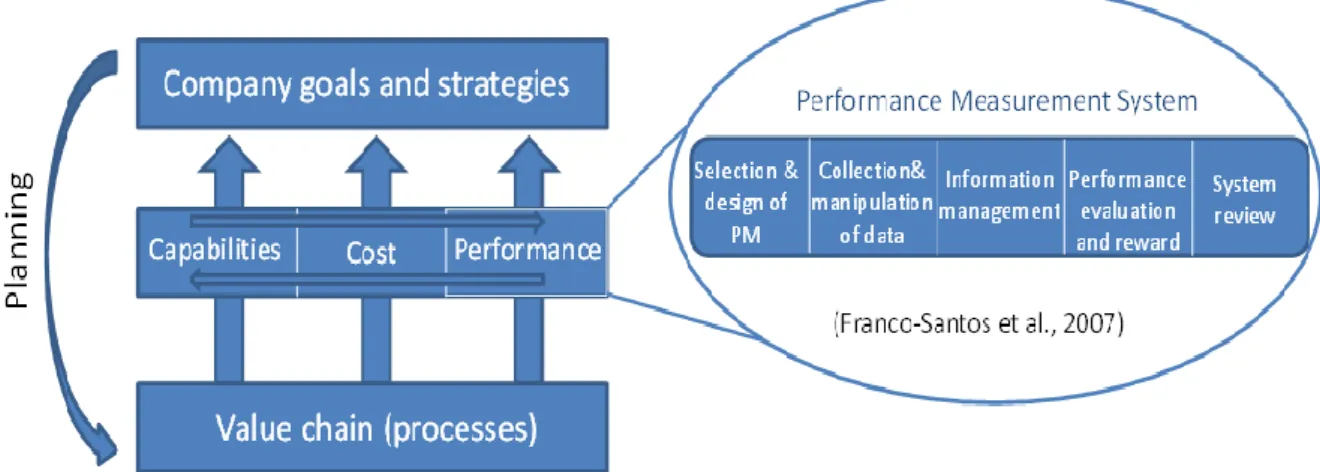
The definition of a performance measurement system (PMS) is adopted from Salloum (2013). A PMS consists of several different components (Figure 3.1).
13
The set of PM, the collection and manipulation of data, information provision, interpretation and decision making, evaluating performance and linking it to rewards, and finally, different review procedures that also ensures there is a feedback loop within the system (Salloum, 2013). Moreover, the PMS exists in a bigger context, interacting with other processes and systems. The value chain processes play an integral role in highlighting the activities and drivers that will increase the understanding of the business. The PMS is intended to make available process measurements of relevance to the business. Thus, in a manufacturing context the value chains would be a part of the production system. The capability evaluation system makes information from the PMS useful for making. Information from the cost system is also important for decision-making and can be essential in resolving trade-offs between the capability and PMS (Salloum, 2013). Further, the information from the PMS and capability systems should be analysed in relation to the goals and strategies of the company in order to ensure alignment of the overall structure. Planning should be undertaken to identify new goals (Salloum, 2013). Moreover, a performance measure (PM) is defined as a metric used to quantify the efficiency and/or effectiveness of an action (Neely et al., 2005). Performance management is to be seen as the process by which the company manages its performance in line with its corporate and functional strategies and objectives (Bititci et al., 1997). Finally, performance measurement is defined as the process of quantifying the efficiency and effectiveness of action (Neely et al., 2005).
3.2 The development of the field
According to Salloum (2013), no universal narrative exists explaining the evolution of the field of PM, however researchers classified it into time periods and phases. Radnor and Barnes (2007) underline three phases: the 20th century, WWII and 1970s/80s. Ghalayini and Noble (1996) and Neely (1999) emphasis two phases, 1890s and 1970s. Regardless, the field of PM has without doubt evolved from finance centric to multi-balanced, thus from focusing on efficiency and financial measures to balanced approaches with both efficiency and effectiveness as focal points (Salloum, 2013).
Several events have affected the PM application during the course of history. Firstly, when the principles of scientific management were introduced they advanced the behaviour of management. By devising the most efficient methods of work increased efficiency and output of individual workers would be derived. New and improved methods were derived via analysis of existing work methods through metrics and observations and the new methods was then closely monitored through the use of PM (Salloum 2013; Radnor and Barnes, 2007). Secondly, when the DuPont model was introduced during the beginning of the 20th century it became the broad standard for financial analysis in North America (Neely, 1999). The model purposed to scrutinize company profitability via the profit and loss and the balance sheets. Also, the separation of management and ownership of a firm and the release of the tableau de bord, which was a French early version of the balanced scorecard, also influenced the application of PM (Salloum, 2013).
14
One of the main events triggering a massive change within the field of PM was the challenge posed to American manufacturing companies and management styles by their Japanese dittos (Radnor and Barnes, 2007). Globalisation had changed the business rules, trade barriers were lowered and companies started to compete in a global context (Rolstadås, 1998). Customers experienced that Eastern products were superior in quality, variety and competitively priced. Western manufacturers were forced to overlook their practices. They realised that the increased complexity of organisations and markets entailed by globalisation made solely financial measures as performance indicators obsolete (Salloum, 2013).
The widely adopted financial PM that had strong penetrating power due to the DuPont model had hardly been modified since the beginning of the 20th century (Neely and Bourne, 2000). The most apparent difference between American and Japanese manufacturers was that the former solely focused on efficiency while the latter equally emphasised both efficiency and effectiveness (Salloum, 2013). In order to regain the initiative, American companies evaluated their priorities from solely finance to softer measures such as delivery precision, lead time and quality (Ghalayini and Noble, 1996). The competition from Japan changed the field of PM by putting the focus of what to measure on non-financial parameters (Kennerley and Neely, 2003). However, a knowledge gap was revealed as most frameworks in theory focused on financial measures but at the same time the practitioners demanded new improved frameworks with non-financial focus (Salloum, 2013). As a consequence, a wide range of frameworks were introduced for the new, non-financial, age of PM (Bourne et al., 2000).
3.3 The balanced scorecard
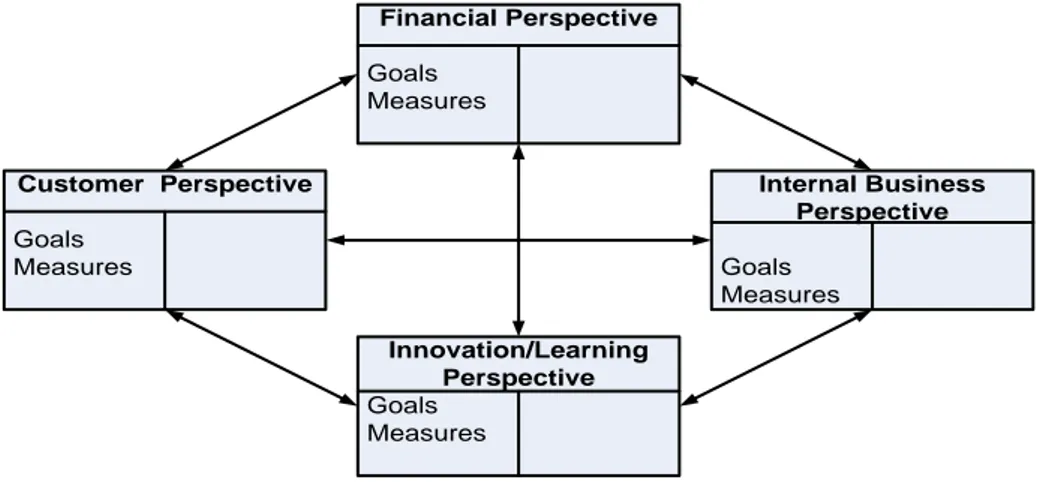
It stands clear without doubt that the balanced scorecard (BSC) framework is the most dominant PM framework available today (Neely, 2005). It was developed because it was not enough to measure financially alone (Figure 3.1). The idea is to use a balanced amount of measures to from four aspects of business (Kaplan and Norton, 1992):
How do we look to our shareholders? (Financial) What must we excel at? (Internal business) How do our customers see us? (Customer)
How can we continue to improve and create value? (Innovation & Learning)
15
The framework uses financial PM to display results of taken actions. It then deploys non-financial PM to identify the triggers of future financial performance. The purpose of obtaining information from several perspectives in combination with a few PM is to guard against information overflow, sub-optimisation and enhance transparency and focus (Kaplan and Norton, 1992). Further, the BSC strived to strengthen the relationship between strategy and PM (Kaplan and Norton, 1996). The BSC wanted to develop is visualise casual relationships between strategy and PM through a tool called strategy maps (Kaplan and Norton, 2000). Strategy maps helps to create a clear line regarding how jobs are linked to overall objectives of the organisation, provides a visual representation of critical objectives and the relationship among them that drive organisational performance, show cause and effect relationships (Salloum, 2013).
Financial Perspective Goals Measures Internal Business Perspective Goals Measures Innovation/Learning Perspective Goals Measures Customer Perspective Goals Measures
Figure 3.2: The BSC (Kaplan & Norton, 1992).
However, even though the BSC is popular, it has been criticized. Ghalayini et al. (1997) argue that the BSC is weak as it is a tool of control and not applicable at an operational level. Neely et al. (2001) argues that the world has moved on to new challenges that have made the BSC redundant. Further, Brignall (2002) underlines that the linear nature of the strategy maps is a problem as it assumes rationality between factors of organisational performance when those relationships are irrational.
16
3.4 Lean production and the impact on performance measures
The philosophy of lean production has had an effect on the application of PM. The focus on minimising the use of resources and eliminating waste and thus enhance value has put new demands on the PM deployed by firms (Womack et al., 1990; Liker, 2004). The focus of lean production and the Toyota production system on non-financial focal points such as process improvements, quality, employee empowerment and problem-solving has affected how PM ought to be designed within operations management (Nightingale and Srinivasan, 2011). Lean production has evolved from the advancements made by American manufacturers. It all began in the U.S. in the early 1900s with the industrial revolution. There was a man by the name of Henry Ford who was the first to form the basic methods of lean production. He wanted to create an efficient production system through eliminating every second of unnecessary movements. The method was to yield a fast and high production of cars at a reduced cost. This type of production required large inventories to compensate for variations in customer demand and uncertainty in material sales. The name of this mode of production was mass production (Liker, 2009).
Then, another man went on to greatly impact the way manufacturing was managed. Kijchiro Toyoda started manufacturing cars within a unit of his father's loom business around year 1926 in Japan. Toyoda then created the lean production approach with the basics of the mass production philosophy. The exception was that the customer need decided the way and rate goods were produced. After World War II, Japan close to going bankrupt. The country had a poor infrastructure and had run out of capital. This put greater demand on flexibility, fast lead times and a network-approach to conducting business (Liker, 2009). These necessities were factored in to the production philosophy that today is dominant and known as either lean production of Toyota Production System (TPS).
TPS has several reasons to why it has become so powerful. One of the biggest reasons is that it applies stringent quality controls at each production step. In mass production, almost every manufactured car had a defect due to the high volumes produced. Further, these problems were addressed outside of the production context. What distinguishes lean from mass production is the ambition to complete work by deploying as few resources as possible and redeem all quality issues directly in production.
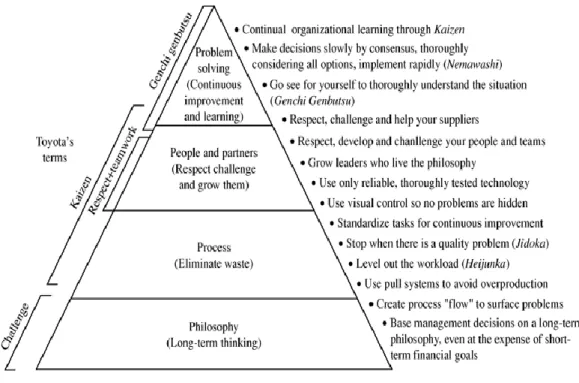
When a company is trying to strive for lean, it is about putting the customer first and creating thinking people. This makes the company an efficient workplace where business prevents wastage in production and first of all forms a culture where you want to see all employees' participation (Womack et al., 1990; Liker, 2009). The Toyota production system that Toyoda initiated and that has been evolving over time but it consists of fourteen principles further divided into four categories (Figure 3.3):
17
Philosophy is all about sustainability. It describes that even if you are financially affected short term, it's about creating value for customers, society and the economy in the long run. Every function in the business should be valued according to their potential to create a sense of responsibility that is one of the key words.
Process is about having the right process that creates the results you want. It creates a good design of value streams without waste that is pulled forward by internal and customers. Further, it creates a culture of doing things right from the start by standardizing, visualizing and making processes transparent.
Employees/partners is about to put a focus on developing staff. TPS wants to develop leaders who understand the nature of work and philosophy, who teaches and guides others to develop exceptional individuals and teams who live their culture. It will also work with its partners and suppliers so that everyone is part of the same team that help each other in downturns and develop together.
Problem solving is about the need to constantly be working to resolve the root causes of problems and thus exert organizational learning. You'll go out in organizations where there are different problems to better understand the whole situation. Having to make a decision quickly, but that one should consider several solutions. One should constantly learn new things through relentless reflection and continuous improvement.
18
3.5 How to evaluate the effectiveness of a PMS
Due to the focus on creating new, more balanced, approaches to designing PM, the field is now well-filled with models addressing this challenge (Paranjape et al., 2006). However, there is still a gap regarding the effectiveness of PM. With that in mind, several researchers have tried to narrow the gap by providing thoughts and frameworks. Kennerley and Neely (2003) states that for a PM to be effective, it has to be managed properly.
Neely et al. (2002) has developed a process for designing PM that fits strategy and production system (The Cambridge performance measurement design process). The process is in essence a ten-step process that highlights the important aspects of designing and implementing a PM (Figure 3.4). The approach results in a detailed map of ten steps that illustrate the essential phases of the process. The process links the PM to a higher purpose that then becomes central to the effectiveness evaluation.
In another framework labelled the performance measurement tool (PMQ) the effectiveness of a PM is highlighted. The PMQ is a tool that allows the organisation to assess the effectiveness and relevance through a questionnaire. The questionnaire is divided into four sections and compares results across the organisation in order to highlight problems regarding the PM fit and opportunities. The comparison is done through the several tools (alignment, congruence, consensus & confusion). For instance, congruent measures are kept because they are in line with the overall targets of the company whilst divergent PM are deemed no longer relevant whilst gaps are PM that are important to the success of the company but are currently not being deployed (Dixon et al., 1990). The framework emphasises a structure for a PM to exist within and the need for a purpose of the measurement.
19
Figure 3.4: The ten-step process (Neely et al., 2002).
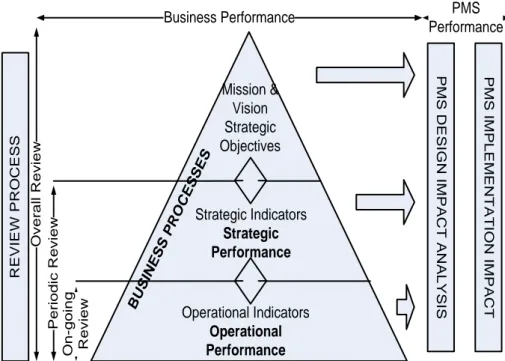
The PMS review framework has been established by Najmi et al. (2005) and purposes to outline how effective and up-to-date the PM are (Figure 3.5) The PMS review framework consists of two aspects, the business performance review and the PMS performance review.
20 Business Performance PMS Performance O v e ra ll R e v ie w P M S D E S IG N I M P A C T A N A L Y S IS P M S I M P L E M E N T A T IO N I M P A C T R E V IE W P R O C E S S P e ri o d ic R e v ie w O n -g o in g R e v ie w Mission & Vision Strategic Objectives Strategic Indicators Strategic Performance Operational Indicators Operational Performance BU SIN ES S P RO CE SS ES
Figure 3.5: The PMS review framework (Najmi et al., 2005).
The first aspect is further divided into three levels; on-going, periodic and overall. The on-going review is on a day-to-day basis and ensures that organisational processes are achieving expected performance. This category deals with operational performance, operational indicators and their alignment to strategy. Any changes on this level must take into consideration the impact of the data collection and IT-systems. The periodic review evaluates the overall performance of the organisation at a strategic level. This review is performed by the executive team and the main considerations should be the effectiveness of achieving strategic objectives, the validity of any hypothesis regarding organizational performance and the validity of possible relationships among performance indicators. The overall review assesses the validity of the mission and vision statements and whether the strategic objectives still support these statements. This review level takes into account all internal and external factors (SWOT analysis) affecting the overall strategic direction of the organization (Salloum, 2013). Further, the all the PM are reviewed systematically to ensure effectiveness and efficiency. The second review category, the PMS performance, deals with the efficiency and effectiveness of the PMS. It also assesses the accuracy of the mapping of the business onto the PMS and the efficiency of the PMS process. The originators argue that the review should maintain alignment between top-level and operational measures. The framework emphasis the relationship between PM across the organization and the effectiveness and efficiency related to the overall goals of the organization.
21
3.6 Descriptions of terms within the area
As in a number of other fields in the society, there is no generally accepted terminology in the field of performance measurement. Even though the majority of different definitions are, similar they need to be accurately defined for this thesis.
Productivity and Continuous Improvement
Productivity and continuous improvement (CI) are two terms often reoccurring as arguments when discussing why different organisations should deploy performance measures in there processes. Productivity can be defined both mathematically and verbally, it is very necessary to separate these two definitions according to Tangen (2005). When you seek to improve productively the mathematical definitions are applicable and the verbal definition simply seeks to explain what productivity stands for.
As Chew distinguished in (1988) a considerable amount of people with decision power over different company´s efficiencies do not understand what productivity really is. Actually there are no universal definition of the word exists and most definitions of productivity touches the input and output of the process.
For this thesis CI will be explained as suggested by Sörqvist (1994); a major amount of incremental improvements that accumulated leads to a large improvement.
Figure 3.6: A visualization of Sörqvist (2004) key factors for continuous improvements.
22
Strategy
This term are one of business dictionary’s most used and over-used term, there is no consensus in regards to what the word really translates to. According to Hayes and Wheelwright (1984) the over consumption of the term has lost much of its exclusivity when applied to the practice of management. The term however has its origins from the military and was used by commanders to organise their troops in different ways in order to accomplish missions (Barnes, 2008; Hayes and Wheelwright, 1984). Here follows five definitions of the term strategy by Henry Mintzberg:
Plan – Strategy is a plan or something comparable such as a plan, a course of direction or a way to get from one place to another.
Pattern – Not many strategies are worked out in a way that they are formulated for that reason strategy arises from a pattern of consistency in behaviour over time.
Position –A place of a explicit product on a explicit market Perspective – An organisation’s original way of exploit things. Ploy – Movements intended to outwit opponents or competitors.
Figure 3.7: A strategy model by Henry Mintzberg.
Olhager (2000) means that strategy is created by an integrated pattern of different actions in the direction of goals and objectives, with the aim to create a clear path to what way the organisation is heading. In this thesis, strategy is defined by Chandler (1962):
The determination of the basic long-term goals and objectives for an enterprise, and the adoption of courses of action and the allocation of resources necessary for carrying out these goals.
23
Performance
As Lebas (1995) suggested the definition of the term performance will be applied in this thesis, the potential for future successful implementation of actions in order to reach the objectives and targets.
Efficiency and Effectiveness
Other terms also exists when discussing why companies should use performance measurements, namely efficiency and effectiveness. The definitions of the term developed by Jackson (2000) are relevant to the operational approach of the research presented in this thesis:
Efficiency means how much cost is spent compared to the minimum cost level that is theoretical required to run the desired operations in a given system. Effectiveness in manufacturing can be viewed as to what extent the cost is used to create revenues.
Measurement, Measures, Measurement Systems and Management There are many different terms surrounding the field that are sometimes applied sloppy and without consideration. In order to be transparent and enhance the communication of the research results the terminology defined by Neely et al (2005) will be adopted:
Performance measurement is defined as the process of quantifying the efficiency and effectiveness of action.
A performance measure is defined as a metric used to quantify the efficiency and/or effectiveness of an action.
A performance measurement system can be defined as the set of metrics used to quantify both the efficiency and effectiveness of actions.
During the thesis the terms measure, metric and performance measure will be used interchangeably. Further, the term measurement system is synonymous in this research with performance measurement system. Moreover, the definition outlined by Bititci et al (1997) for performance management will be applied in this thesis:
The performance management process is the process by which the company manages its performance in line with its corporate and functional strategies and objectives.
24
3.7 Reflection
The field of PM has evolved from being focused around the principles of mass production to embracing the lean production philosophy. The change in production system dominance within operations management has impacted considerably on the field of PM as outlined earlier. The introduction of the BSC came as a direct response to the new focus points of the field. Even though little has been written regarding the effectiveness of a PM, there are several aspects that needs to be considered when assessing if a PM is effective or not. The purpose of the PM needs to be addressed. Also, the relation of the purpose to the relevance of the PM should also be highlighted. The purpose is important as it establishes how well the PM actually relates to its own justification of existence. Moreover, the structure that the PM is introduced within is important to scrutinize. The structure is important as it sheds light on how mature and methodical the organisation is in its PM management. Further, the alignment between the PM and the overall goals of the company is also important to highlight. The alignment highlights to what extent that PM across the organisation is related to one another and the overall purpose. These three aspects (purpose, structure and alignment) are pivotal for assessing how effective a PM is.
25
4. EMPIRICAL FINDINGS
This chapter outlines the findings made in the case study executed. Firstly, the case study is presented. Then, the data from the case study is presented. The data presentation is divided into two steps. The initial step outlines the PMS of the company and how the case company works with PM in general. The second part focuses on how the case company evaluates the effectiveness of its PMS. The chapter is closed through a conclusion.
4.1 Case company
The data presented within this master thesis is collected at Volvo Construction Equipment (VCE) in Eskilstuna. More specifically, the data was collected at Operations Eskilstuna (which constitutes the VCE factory in Eskilstuna). Operations Eskilstuna manufactures axles and transmissions for articulated haulers, loaders and road machinery. The axles and transmissions are shipped to other assembly factories around the world for final assembly (most notably Operations Arvika and Operations Braås).
Operations Eskilstuna employs around 800 persons (estimate provided by HR-partner and controller). The overall product-line of VCE is illustrated in Figure 4.1. VCE belongs to the Volvo Group that also boosts will companies like Volvo Trucks, Mack Trucks, Nissan Trucks, Volvo Buses and Volvo Penta. The Volvo Group operates world-wide with an industrial footprint that stretches over all continents.
According to several interviewees, VCE´s main competitors are Caterpillar, Komatsu, Terex, Liebherr, John Deere, JCB, Atlas Copco, Sandvik, Doosan infracore and CNH. Caterpillar is widely regarded to be number one and Komatsu number two while VCE rounds up as number three.
26
27
4.2 The PMS
Analysis of process and system documentation reveals that Operations Eskilstuna deployed a PMS labelled SEQDCH (Safety, environment, quality, delivery, cost and HR) (Figure 4.2).
Figure 4.2: The outline of the SEQDCH system.
The six perspectives were measured throughout the organisation and were meant to be prioritised in the order they are outlined. Thus, safety was the most important thing to secure, then to respect the environment. After that, focus was put on the quality and delivery of the products. The cost of the products and employee development followed after. Throughout the interviews, the PMS was referred to as the SEQDCH. However, several production interview persons said that at the production departments lowest within the organisation, only SQDC was measured.
Moreover, it was showed by archived data that the PMS had been developed incrementally over time and not through a specific project. The production manager remembered that the idea of the SEQDCH came over 15 years ago (before year 2000), when the former CEO of the company wanted to create a homogenous PMS that would measure the same perspectives across the Volvo Group. This alignment was needed in order to create a responsive organisation and to facilitate communication more easily. Further, during the last years an extensive project with the purpose of implementing Volvo Production System (VPS) and transforming the factory from functional to lean has been executed at the site. The project was estimated to a staggering 1.1 billion SEK and is the largest investment ever made at a production site by the Volvo Group. Within VPS, goal and result orientation is highly rated and therefore focus has been
28
concentrated on generating a culture that embraces and enhances PM results. The production manager said:
“We have not had a consulting company or internal consultants here to create the SEQDCH, we have established it ourselves and we make sure to make it better every year through our own experiences. The re-loop is important as it creates a closed system that gets better by the day and boosts the performance culture of the factory.”
Several interviewees said that the PM used were connected from the top to the bottom of the organisation. The production related PM were also reported from the bottom to the top of the organisation at every morning-meeting (every day) in order to ensure that problems and opportunities are escalated for important decision-making. The team-leader said:
“Every morning we report our SQD PM to our first-line managers, they will in turn report to the second-line. The second-line will report to the functional management [which includes the GM]…Also, we do sit every month and go through all our PM and discuss result, actions and what to do if we are not doing as good as we should you know.”
This is further strengthened by the obtained documentation which showed what frequency each PM should be measured. The production PM had lower frequencies of measuring that for instance the cost and HR related PM. The business controller said that the cost and HR PM cannot be measured on a frequency less than a month because they were collected from the accounting system (cost) or came from external providers (HR). The HR partner also said that the HR PM were not as important as the other PM and therefore they were measured not so often.
4.3 PM management
Observations at PM meetings, documentation and interview material shows that Operations Eskilstuna had deployed a tool they called result plans (RP) for the PM management. The purpose of the RP was to create PM, update PM, ensure that goals and objectives are met within an organisation and enhance PM culture. The RP is designed to follow up organisational and departmental goals and individual tasks and objectives. The RP is a document that is personal (not on production-team level where it is owned by the team) and states goals, PM and actions for a quarter of a year.
This document is then followed up through weekly, quarterly and yearly meetings (Figure 4.3). The weekly meetings purposed to measure progress, follow-up tasks and actions and ensure that help is given if needed when a problem too hard to deal with. The quarterly meetings existed in order to update the goals and PM based on the experience and time gained. The yearly meetings allowed the factory to set new PM and goals for the coming year and improve the whole SEQDCH structure. The yearly and quarterly meetings had to be executed downwards in the organisation whilst the weekly meeting had to be done upwards. The controller said that the downward meetings were important as they allowed the management to decide the scope and direction of the goals and PM. He argued that the output of the yearly and quarterly meetings become input for the meetings that were
29
executed downwards in the factory. The quality manager said that the idea of the upward weekly meetings was to ensure that important problems could reach the management.
Figure 4.3: The outline of the RP tool.
The production manager was the one deciding that the RP tool was to be implemented at Operations Eskilstuna. He argued:
“I felt that we did not have a process for working with our KPIs, we did not have a good tool that was integrated throughout the factory that allowed us to use the same language and quickly being able to change direction when needed. So I got this external team to implement the result plans and I personally think that it has been very successful.”
Just like the production manager explained, several other interviewees said that the RP tool had been implemented by an external consultancy. Several interviewees also said that the consultancy gave the organisation education on how the RP tool worked. The education form was flexible and could range from individual to group sessions. Documentation was also obtained that seemed to be
30
educational material from the consultancy. The production engineer explained regarding the training:
“Besides giving us an introduction training you could say, they also were around a lot in the beginning at all sorts of meetings, weekly, monthly, quarterly and yearly. That was very good because the production manager really liked this stuff and he wanted us to learn it. But, in the end, they were never around anymore. I think they didn’t care in the end when their contract was soon over.”
4.4 PM effectiveness evaluation
The PM effectiveness evaluation was discussed from two aspects, structural and behavioural. These are presented separately under this section.
4.4.1 Structural aspect
Observations from the factory tour and analysis of documentation and interviews shows that Operations Eskilstuna has a structure for PM. However, the structure is not consistent. The production and quality manager said that the structure was good. However, the people from the lower areas of Operations Eskilstuna felt that the structure was bad. The interviewees agreed about the inconsistency of the structure, the production manager argued that the structure was more important at the top of the factory because it is where most of the PM are created or deleted. When asked what the structure was, the business controller said:
“The structure is important because it is the objective reality that a PM is introduced within, if our structure dictates that the PM needs to be defined in X amount of ways, then it has to be. If it does not dictate that, then it doesn’t need to be defined at all. The structure allows us to be systematic regarding our PM, what we do introduce and what we do abolish…No, I don’t think we have a good structure over the whole factory yet, but we are on our way.”
The structure at Operations Eskilstuna was divided into three parts. The first part was the SEQDCH-system, the second part was the RP tool and the third part was the definition sheets of the PM (Figure 4.4). A PM at Operations Eskilstuna is defined along seven dimensions: a title of the PM, a perspective that the PM relates to, a goal level, a frequency of measurement, an owner, someone that collects the data and a data formula. Besides, other information and the next review session were also mentioned.
31
Figure 4.4: The PM definition sheet.
The interviewees thought that the structure was good but that a purpose was missing. The quality manager said:
“We have said it before and will probably need to think through this soon for real, we need a purpose in order to know how effective we actually are in our PM work. Today, if we are to criticize a PM it is easy because the purpose is not clear, it is not printed somewhere.”
Most interviewees said the same thing, a purpose was not available and that did make the effectiveness evaluation hard. The production manager said that during the management meetings when discussing if a PM was effective or not, it was discussed around how well it fulfilled its purpose and how well the results were. The purpose was divided into two parts, the purpose of having the actual PM (the goal or overall objective that the PM supported) and the purpose of having the PM within the structure for PM at the factory. Thus, how well it functioned within the SEQDCH-framework, the RP tool and the PM definition sheet. He also said that before Operations Eskilstuna though it was enough to relate the PM to a perspective (one of SEQDCH) but that was not enough as no purpose was made clear. The controller said the factory was working on changing the structure in order to allow the purpose to be included. He said it was crazy not to have a purpose when it was very important to understand if the PM is effective or not. When asked if they thought that the IT-systems provided timely information and data for the PM, the answers were different. The business controller and controller though the information was timely, the HR-partner thought it was not. The production manager thought that the quality and delivery PM of the factory were