Drivers Ability to Acquire In-Car Information
Presented in the Peripheral Field
of View without Fixating
- A Simulator Study
Reprint from Proceedings of Vision in Vehicles VII, 2000,
Marseilles, France, September, 1997, pp. 83-91
O O c N N m m x 0 > :. Ha. 35 U)
Lena Nilsson, VTI
Torbjörn Falkmer, VTI and Division
of Preventive and Social Medicine, Dept. of Health
and Environment, University of Linköping
Stefan Samuelsson, VTI
Swedish National Road and
vr| särtryck 337 - 2000
Drivers Ability to Acquire In-Car Information
Presented in the Peripheral Field
of View without Fixating
- A Simulator Study
Reprint from Proceedings of Vision in Vehicles VII, 2000,
Marseilles, France, September, 1997, pp. 83-91
Lena NiIsson, VTI
Torbjörn Falkmer, VTI and Division
of Preventive and Social Medicine, Dept. of Health
and Environment, University of Linköping
Stefan Samuelsson, VTI
c -m (2000) .",o n , w: ermlssmn. . wedisn , Raw and.
83
Drivers Ability to Acquire In-Car Information Presented in the Peripheral Field
of View without Fixating - A Simulator Study
Lena Nilsson 1, Torbjörn Falkmer 1,2 & Stefan Samuelsson ]
1Swedish National Road and Transport Research Institute (VTI), Linköping, Sweden
2Division of Preventive and Social Medicine, Dept. of Health and Environment, University of Linköping, SE-581 85 Linköping, Sweden
1. INTRODUCTION
The amount of information available in the car is increasing. A contributory cause is the introduction of different driver support systems. These Intelligent Transport Systems (ITS) are often designed to display visual information, meaning that they address the human sense most
occupied during driving. The additional visual information can reduce traf c safety by increasing the load on the driver and/or by causing divided attention and distraction [1]. Besides consideration of the amount of information, alternative ways of presenting the in car
information are also needed. Visual information presented in the car, including the use of Head-Up displays (HUDs), is still assumed to be acquired via central vision, i.e. via fixation. The main advantage of HUDs being reduced changes of xation and thus reduced acquisition times [2]. A recent suggestion is that the load imposed on the driver can be reduced if the information acquisition is distributed between central and peripheral vision. This could be
achieved by presenting in-car information in the peripheral eld of view, provided that the
information is designed so the driver can acquire it without shifting the focus of attention from the forward eld of view. To our knowledge only the VISOR-prototype for navigation support
[3] is based on this idea for road vehicles, although military aircraft have used peripheral
vision displays for many years [4].
From the literature it is obvious that human beings are able to perceive visual information
in the periphery [S, 6]. But, the number of detected and correctly identi ed stimuli has been
shown to vary with the angle between the stimulus and the xation point, the visual and/or
cognitive load induced in the central eld of view and the stimuli characteristics. Generally, in
the central (functional) eld of View small differences and details in the information can be distinguished and identi ed with high accuracy, while the main task of the peripheral vision is to detect movements and light changes [7]. In the traf c environment, the demands and complexity of developing situations rather than speed have been reported to determine the extension of the driver s peripheral eld of view [8]. According to Miura [8] a reduction of the functional eld of view while driving, as a result of attentional focusing, is followed by a corresponding extension of the peripheral eld of view.
The objective of the study was to investigate drivers ability to acquire in-car information displayed in the vertical periphery during driving and to determine whether this is achievable
without the driver shifting focus from the forward eld of view. Based on a literature review
[5], the in uence of different codes to convey the information and the complexity of the driving task were also examined.
2. METHODS
2.1 Subjects
Thirty-two subjects, 16 men and 16 women, participated in the study. They were between
23 and 49 years old, with a mean of 34 years (sd 8 years). All were experienced drivers in the sense that they drive at least 10 000 km per year (mean 17 000 km) and have had their driving
licence for at least ve years (mean 15 years). Many of them were also experienced simulator drivers having participated in earlier simulator studies. It was a requirement that the subjects
did not need glasses while driving. The subjects were paid 750 SEK. V
2.2 Apparatus
The study was conducted in the VTI driving simulator [9]. It is an advanced simulator consisting of six subsystems: a computer system including the simulation model, a moving base system, a 120° wide visual system, a vibration-generating system, a sound system and a temperature-regulating system. Via a control strategy, the subsystems work together to evoke
driver impressions, reactions and actions which are very similar to those appearing during real
driving. A short time delay is crucial for reaching a high degree of realism. The additional _ time delay introduced in the VTI simulator is 40ms, which is extremely short.
2.3 Road and traffic conditions
The test route was a two-lane, seven-metre-wide road with hard shoulders. It contained both horizontal and vertical curves, which were not sharp. There were daylight conditions, with a visibility distance of 600 m and high friction road surface conditions. The road was 80
km long and composed of four identical 20 km sections with varying combinations of traf c
conditions (with/without traf c) and speed limits (90/110km/h). The traf c consisted of a car
driving with varying speed in front of the subject and a stream of oncoming cars driving at 90km/h. The lateral position of the oncoming cars varied, as did the distance between them.
The subjects were instructed to follow the speed limits and not to overtake the car ahead but keep a short and constant distance to it.
2.4 Peripherally presented in-car information
Two displays were designed and installed in the simulator car (Volvo 850). They were mounted together under each other in the upper edge of the windscreen, approximately SOcm in front of the driver. The vertical distance between the centre lines of the two displays was 3.50. The displays were 3 x 30m and contained a con guration of 33 LEDs for the generation of information.
Two types of information were presented on the displays, stationary and moving. The stationary information was created by lighting up LEDs forming the letter T. The T was shown either correctly oriented or upside down. The moving information was a running light , either to the left or to the right. The running light was created by successively lighting
In-Car Information Presented Peripherally 85 The subjects task was to detect and identify the presented information via peripheral
vision (without xating) as quickly as possible. They responded by pressing the correct button corresponding to each of the four possible presentations (T correct/upside down, running light left/right). The set of buttons was mounted to the right on the steering wheel, with the buttons arranged so the subjects could distinguish them by touching and did not have to change the grasp of the wheel or take their eyes from the environment when responding.
2.5 Design
Four factors were varied in the experiment: the type of information (moving, stationary), the display position (upper, lower), the traf c condition (with, without traf c) and the speed limit (90, llOkm/h). Information was presented 64 times along the test route and all subjects
were exposed to all combinations of the four factors (Table 1). The design was a completely balanced within-subject 2 x 2 x 2x 2 factorial design. Also the orientation of the two types of
information was balanced. Sixteen random orders of combinations of the presentations and
conditions were used. One man and one woman were randomly assigned to each of them. Table 1. Experimental design. Upper/Lower indicate display position, S = stationary, M =
moving information, numerals within brackets show number of presentations, the 4 presentations of S and M per cell at the bottom line include 2 presentations of each orientation.
With traf c (32) Without traf c (32)
90km/h(16) 110km/h(16) 90km/h (16) 110km/h (16)
S M S M S M S M S M S M S M S M
(4) (4) (4) (4) (4) (4) (4) (4) (4) (4) (4) (4) (4) (4) (4) (4)
Upper Lower Upper Lower Upper Lower Upper Lower
(8)
(8)
(8)
(8)
(8) .
(8)
(8)
(8)
2.6 Experimental procedure
Eye movements were recorded using a NAC 600 device. By manual inspection of the video
tapes it was determined whether the subjects had acquired the information by peripheral vision or not. Presentations when central vision was used to acquire the information were excluded from further analysis. The response times and proportions of identi cation errors in the presented information were recorded and also the speed and the distance to the car ahead. Statistical analysis was performed by ANOVA. The signi cance level S% was used.
Before the experiment the subjects practised simulator driving, as well as the information acquisitiontask by driving a 10 km long training route. After the driving session they rated the workload level [10] and their experiences.
3. RESULTS
3.1 Non xations and fixations
Information was presented on the peripheral displays in the car 2048 times (32 subjects x 64 presentations). Figure 1 shows that a great majority of the information (95%) was acquired by peripheral vision. Only in 94 cases did the subjects use central vision, i.e. fixate the
information. Thus, the amount of data excluded from the analysis was very small. The letter T
(stationary information) was more frequently xated (74 times) than the running light (moving information, 20 times). The number of xations did not differ between information
presented on the upper (46 times) and on the lower (48 times) display.
479
471
499
505 .
a Not fixated I Fixated Numb er s of no t fixa te d an d fi xate d pr esen ta ti on s of 51 2 pe r co nd itio nStationary Stationary Moving Moving
upper lower upper lower
Type of information and display position
Figure 1. Distributions of not xated and xated information for the 4 combinations of type of information and display position.
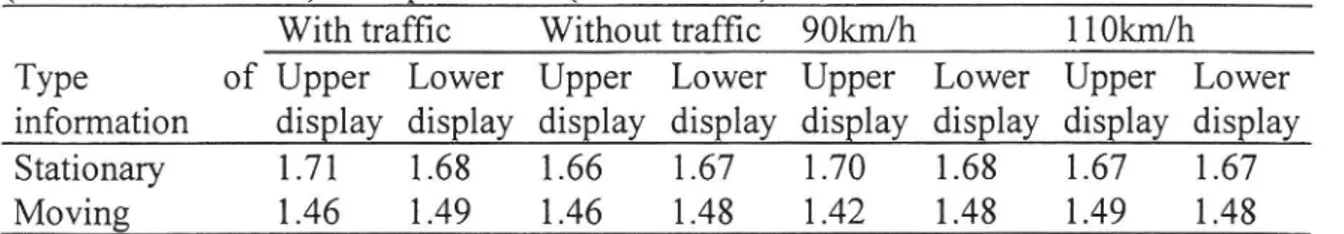
3.2 Response time
The mean times of responding to the peripherally presented in-car information are shown in Table 2, separately for type of information, display position and the studied traf c and speed conditions. The ANOVA showed a signi cant effect of type of information (F(1, 31) = 16.01 , p < .OOl). Using the peripheral vision, the subjects responded faster to the running light (moving information) than to the letter T (stationary information). The overall means were 1.5 sec and 1.7 sec, respectively. No other effects were revealed. The difference in response time between types of information was valid over all other conditions in the study.
ln-Car Information Presented Peripherally 87
Table 2. Mean response times (sec) of stationary (letter T) and moving (running light)
information when presented on the upper and lower display under the studied traf c
(with/without traf c) and speed limit (90/110km/h) conditions.
With traffic Without traffic 90km/h 1 10km/h Type of Upper Lower Upper Lower Upper Lower Upper Lower information display display display display display display display display Stationary 1.71 1.68 1.66 1.67 1.70 1.68 1.67 1.67 Moving 1.46 1.49 1.46 1.48 1.42 1.48 1.49 1.48 3.3 Identification errors
The mean proportions of identification errors of in-car information presented in the peripheral field of view during driving are shown in Table 3, separately for type of information, display position and the studied traffic and speed conditions. The ANOVA resulted in three significant main effects; of type of information, of display position and of speed. Using peripheral vision, the subjects identified the in-car information incorrectly more often when it was stationary compared with when it was moving (F( 1, 31) = 68.75, p < .OOl).
On average, 27% of the presented T letters were incorrectly identified, but only 2% of the
running lights. Also, presenting the information on the upper display led to more identification
errors compared with a presentation on the lower display (F(1, 31) = 11.44, p = .002). The proportions of errors were 16% for the upper display and 12% for the lower display. Finally, the subjects made more identification errors when the speed level was llOkm/h compared
with when it was 90krn/h (F(l, 31) = 5.78, p = .022). The respective error rates were 15 and
13%.
Table 3. Mean proportions of incorrect identifications (%) of stationary (letter T) and moving
(running light) information when presented on the upper and lower display under the studied
traffic (with/without traffic) and speed limit (90/110km/h) conditions.
With traffic Without traffic 90km/h llOkm/h
Type of Upper Lower Upper Lower Upper Lower Upper Lower
information display display display display display display display display
Stationary 33 25 28 22 31 20 30 26
Moving 2 2 2 2 1 O 3 2
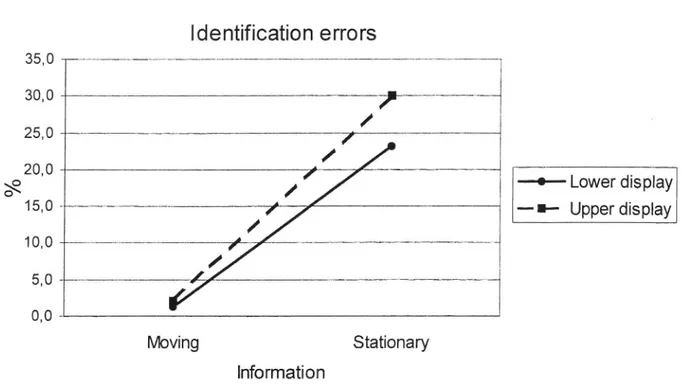
The ANOVA of the proportions of identification errors also resulted in a significant interaction between the type of information and the position of the display where it was presented (F(1, 31) = 5.98, p = .O20). The interaction is shown in Figure 2. It indicates that when the letter T (stationary information) was acquired via the peripheral vision, the generally high error rate was in uenced by the angle between the subject and the display. The proportion of incorrect identifications was higher when the information was presented on the upper display, i.e. more peripherally (30%), compared with when it was presented on the lower display (23%). The running light (moving information) was on the other hand not influenced by the angle between the subject and the information, but was identified with a
similarly low error rate irrespective of the display position. The proportions of incorrect
identifications of the moving information were 2 and 1% for the upper and lower display, respectively.
Identification errors
35,0
30,0 )
25,0 j /
20,0 I / _
oxo
/ /
_o Lower display
150 f l Upper display // ' 10,0 ,,
5.
/1/
0,0 Moving Stationary InformationFigure 2. Proportions of identi cation errors (%), interaction effect of type of information (stationary/moving) and display position (upper/lower), means of all 32 subjects.
3.4 In uence of cognitive load
The 32 subjects were divided into two groups depending on the following distance to the car ahead, which was assumed to re ect the cognitive load from the driving task. The mean distance was 21 m for the 16 subjects keeping shorter distances and 48 m for the 16 subjects keeping longer distances. The ANOVA did not reveal any differences in response time
between the groups when the peripheral information was presented. The overall mean was 1.6
sec in both groups.
However, there was a tendency of shorter following distances to lead to more identi cation errors (F(1, 30) = 3.68, p = .065). The subjects driving close to the car in front identi ed 17% of the peripheral information incorrectly, while the error rate was 11% for the subjects following at longer distances.
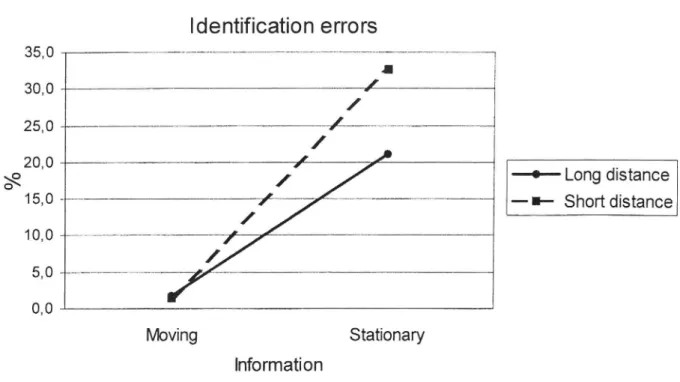
Furthermore, the ANOVA of the proportions of identi cation errors resulted in a
signi cant interaction between the type of information and the following distance (F(1, 30) =
4.19, p = 049). The interaction is shown in Figure 3. It indicates that the variations in the load from the driving task (different following distances) in uenced the acquisition of peripheral information differently depending on the type of information presented. The generally high proportion of identi cation errors for the letter T (stationary information) was in uenced by the cognitive load. More identi cation errors were made when the T was presented during close following (33%), compared with T-presentations when the distance to the car ahead was
longer (21%). The running light (moving information) was, on the other hand, not in uenced by the following distance, but was identi ed with a similarly low error rate for both short (l%) and long (2%) distances.
In-Car Information Presented Peripherally 89 Identification errors 35,0 I 30,0 ! / 25,0 / /
20,0
/
)
L
d' t
o\° ,, / -+ ong IS ance
15,0 , l Short distance / / 10,0 ;
/
5,0 / 0,0 Moving Stationary InformationFigure 3. Proportions of identi cation errors (%), interaction effect of type of information
(stationary/moving) and following distance (short/long), means of subgroups of 16 subjects.
4. DISCUSSION
The results of the study clearly show that drivers are able to acquire peripheral in-car information without shifting the focus of attention from the forward eld of view. But, the acquisition process is more or less in uenced by type of information, display position and level of cognitive load. Therefore, a careful design of the presentation of the information is a prerequisite for quick and accurate acquisition of information via peripheral vision.
The response time varies depending on the type of information. It takes essentially longer time to perceive stationary information than moving information in the peripheral eld of view while driving. The difference is in the order of magnitude of 0.2 sec, which at 90km/h equals a distance of ve metres. Also, the drivers possibility of correctly identifying the peripheral information varies. The pr0portion of identification errors of stationary information exceeds that of moving information by about 25 percent. It is questionable whether the high error rate obtained for stationary information (27%) would be acceptable in traf c. Another factor in uencing the error rate is the angle between the driver and the display. Information presented further out in the peripheral eld of view is generally identi ed incorrectly more often than information presented at a smaller angle. As far as we know there are no comparable studies, presenting in-car information in the vertical periphery with the aim that it should be acquired by peripheral vision. However, the results obtained are in agreement with previous research concerning human information acquisition and visual search reviewed in recent literature studies [4, 5]. _
Response time was not found to be in uenced by the angle between the driver and the display, which could have been expected. The reason may be that, from a detection point of
view, there is little difference between lighting up LEDs forming a sign on a display and
letting a light wave move across the display. In both cases the important factor is the light change, a type of visual stimulus that has been reported to be detected relatively easy via the
peripheral vision [5]. The in uence of position becomes apparent only when it comes to
identi cation of the information, which is con rmed in this study by the different error rates obtained for information presented on displays 3.5° apart. From an identi cation point of view stationary information (e.g. a sign) has to be looked upon as a static pattern, while identi cation of moving information is still based on informative changes in light and position.
Another important result concerning the proportion of identi cation errors is the interacting effect between type of information and display position. The difference in the possibility of identifying the two types of information increases when the display is located more
peripherally. The generally poor ability to correctly identify stationary information while driving deteriorates when the angle between the driver and the display increases. The ability to
identify moving information is, on the contrary, independent of where in the vertical peripheral eld of view the information is located (within practical limits for car applications).
Variations in the cognitive load from the driving task (speed and distance control) in uenced the information acquisition only slightly. On average, the drivers made more identi cation errors when they drove faster. The effect of speed was small and can probably to a large extent be attributed to the very small number of errors in identifying the moving information. The interaction effect between type of information and following distance points
to the risk that more loading driving situations can reduce the ability to acquire stationary information, while the acquisition of moving information seems to be unaffected by the traf c
complexity factor.
The workload experienced and subjectively rated by the drivers using NASA-RTLX scales
[10] was somewhat higher than the workload levels recorded in comparable studies using the same instrument [3, 10]. A reasonable explanation, for the lower level found in the other study presenting information peripherally in the car [3], is that it investigated only moving information and that the additional workload in our study is probably caused by the stationary
information. In the second study [1 1] the in-car information was presented more traditionally. The lower level of workload may in this case be explained by the different way of conveying the in-formation compared with our study, i.e. from a central position on the dashboard combined with audible commands in the other study compared with the peripheral displays
used in this study.
The drivers opinions about peripheral presentation of information were on average neither positive nor negative. Their experiences related to the information acquisition were in agreement with recorded performance data. The drivers estimated that they xated the stationary information a little more often than the moving information and con rmed the recorded difference in error rates between stationary and moving information by reporting a higher degree of uncertainty concerning the identi cation of the stationary information. The results of the study are valuable for the design of new information systems to be installed in cars. The recorded effects imply that information aimed at being perceived by peripheral vision should preferably be moving. Also, if stationary information is presented in the
peripheral eld of view, there is a substantial risk that the generally high proportion of
In Car Information Presented Peripherally 91
traf c situations. These drawbacks must be considered carefully in the process of system
design.
ACKNOWLEDGEMENT
The authors are most grateful to the subjects, without whom the study would have been
impossible. We are also indebted to our colleagues Maria Berlin, Håkan Jansson, Leif Lantto, Beatrice Söderström and Roland Östergren, who assisted in planning, realising and
conducting the study and also in analysing the data. The study was nancially supported by
the Swedish National Road Administration (SNRA). Updating of the equipment used for registration of eye movements was supported by Sunnerdals Handikappfond.
REFERENCES
1. Malaterre G. & Fontaine H. (1993). Drivers safety needs and the possibility of satisfying
them using RTI systems. In: Parkes A.M. and Franzén S.(eds.) Driving Future vehicles,
Taylor & Francis, London, pp. 157 169.
2. Kiefer R.J. (1995). De ning the HUD bene t time window . In: A.G. Gale et al. (Eds.), Vision in Vehicles VI. Amsterdam: Elsevier Science Publisher B.V. (North Holland).
3. Alm H. & Berlin M. (1997). Fältstudie av användaracceptans: Personbil utrustad med
* VISOR. Report 199725, Swedish National Road Administration (SNRA), Borlänge,
ISSN 1401-9612, in Swedish.
4. Brown I.D., Holmqvist S.D. & Woodhouse M.G. (1961). A laboratory comparison of tracking with four ight-director displays. Ergonomics, 4, 229-251.
5. Samuelsson S. & Nilsson L. (1996). About the possibilities to detect and identify in-car information in the peripheral field of view. VTIrapport Nr 412, in Swedish (English
version, VTIrapport No 412A, in preparation).
6. Lansdown TC. (1996). Visual Demand and the Introduction of Advanced Driver
Information Systems into Road Vehicles. Doctoral Thesis, Department of Human
Sciences, Loughborough University, England.
7. Leibowitz H.W. (1986). Recent advances in our understanding of peripheral vision and some implications. Proceedings of the 30th Annual Meeting of the Human Factors Society, pp. 605-607.
8. Miura T. (1992). Visual search in intersections - An underlying mechanism. IATSS, Vol. 16, No. 1, pp. 42-47.
9. Nilsson L. (1993). Behavioural Research in an Advanced Driving Simulator - Experiences of the VTI Systern. Proceedings of 37th Annual Meeting of the Human Factors and Ergonomics Society, October 11-15, Seattle, Washington, USA, pp. 612-616.
10. Byers J.C., Bittner Jr., A.C. & Hill S.G. (1989). Traditional and raw task load index
(TLX) correlations: are paired comparisons necessary? Advances in Industrial Ergonomics and Safety 1. Taylor & Francis, London.
11. Alm. H., Nilsson L., Järmark S., Savelid J. & Hennings U. (1992). The effects of
landmark presentation on driver performance and uncertainty in a navigation task. VTImeddelande 692A; Swedish National Road and Transport Research Institute (VTI).